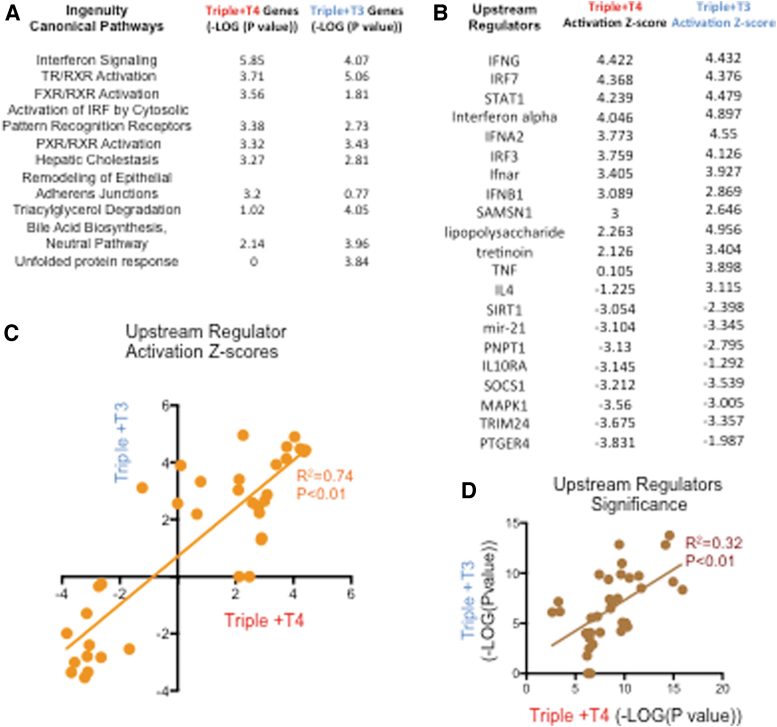
FIG. 4.
Compared results of IPA of genes regulated by T4 and those regulated by T3. (A) Most significantly enriched canonical pathways. (B) Activation z-scores of upstream regulators whose pathways are most significantly affected in T4- and T3-treated triples. (C, D) Correlation of upstream regulator activation z-scores (C) and p-values (D) between experimental groups treated with T3 or T4. IPA, Ingenuity Pathway Analysis.

