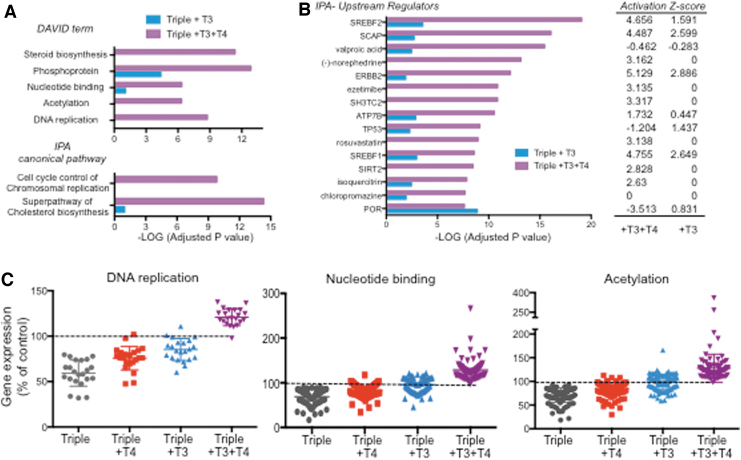
FIG. 6.
Synergistic and specific effects of the T3+T4 treatment. (A) DAVID terms and IPA canonical pathways exhibiting most differential significance between 535 genes regulated by T3 (adjusted p < 0.05) and 535 genes specifically regulated by T4+T3 showing top statistical significance. (B) IPA upstream regulators showing highest differences in statistical significance and z-activation between the same set of genes. (C) RNA-sequence data as a percentage of control values of genes identified by DAVID as related to DNA replication, nucleotide binding, and acetylation. DAVID, Database for Annotation, Visualization and Integrated Discovery.

