

Abstract
While several microRNAs (miRNAs) that regulate the endotheliogenesis and further promote angiogenesis have been identified in various cancers, the identification of miRNAs that can drive the differentiation of adipose derived stromal/stem cells (ASCs) into the endothelial lineage has been largely unexplored. In this study, CD34+ ASCs sorted using magnetic bead separation were induced to differentiate along the endothelial pathway. miRNA sequencing of ASCs at day 3, 9, and 14 of endothelial differentiation was performed on Ion Proton sequencing system. The data obtained by this high-throughput method were aligned to the human genome HG38, and the differentially expressed miRNAs during endothelial differentiation at various time points (day 3, 9, and 14) were identified. The gene targets of the identified miRNAs were obtained through miRWalk database. The network-pathway analysis of miRNAs and their targets was performed using the Database for Annotation, Visualization and Integrated Discovery (DAVID) bioinformatic tools to determine the potential candidate miRNAs that promote endothelial differentiation. Based on these analyses, six upregulated miRNAs (miR-181a-5p, miR-330-5p, miR-335-3p, miR-15b-5p, miR-99a-5p, and miR-199a-5p) and six downregulated miRNAs (miR-145-5p, miR-155-5p, miR-193a-3p, miR-125a-5p, miR-221-5p, and miR-222-3p) were chosen for further studies. In vitro evaluation of these miRNAs to induce endothelial differentiation when transfected into CD34+ sorted ASCs was studied using Von Willebrand Factor (VWF) staining and quantitative real time–polymerase chain reaction (qRT-PCR). Our results suggest that miRNAs: 335-5p, 330-5p, 181a-5p and anti-miRNAs: 125a-5p, 145-5p can likely induce endothelial differentiation in CD34+ sorted ASCs. Further studies are clearly required to elucidate the specific mechanisms on how miRNAs or anti-miRNAs identified through bioinformatics approach can induce the endotheliogenesis in ASCs.
Keywords: endotheliogenesis, adipose stem cells, CD34+, miRNA-Seq, Kyoto Encyclopedia of Genes and Genomes (KEGG)
Introduction
Advancements in the fields of tissue engineering and regenerative medicine have led to the development of engineered tissues for the treatment of various musculoskeletal disorders [1–3]. Similarly, for breast cancer patients who have undergone mastectomy and for cosmetic and plastic reconstructive surgeries, autologous fat grafting is often used to achieve the desired outcome [4–7]. However, the successful integration of either engineered tissue grafts or transplanted autologous fat grafts mainly depends on the proper development and synchronization between the adipose vasculature with the surrounding arterial and venous structures.
Endotheliogenesis (differentiation of progenitors into mature endothelial cells) is the first step in the vascularization process followed by vasculogenesis (formation of new blood vessels from endothelial cells) and finally angiogenesis (growing of the blood vessel network) [8–10]. Without proper vascularization of the transplanted tissues, the cells deep inside the tissue structure lack a sufficient supply of nutrients and oxygen and eventually die as a consequence of necrosis. Therefore, understanding the process of angiogenesis is crucial for successful outcome of transplanted tissue grafts and has the potential to beneficially impact the field of tissue engineering and regenerative medicine.
In normal tissues, neovascularization is initiated by the endothelial progenitor cells. Nevertheless, it is cumbersome to access large numbers of these cells to construct and integrate the vasculature of engineered tissues since their major source is the bone marrow, a depot with limited accessibility and volume. Alternatively, endothelial progenitors expressing CD34+ and CD31− can be isolated from the stromal vascular fraction (SVF) of adipose tissue [11]. This particular cell subpopulation within the SVF has the potential to differentiate along the endothelial lineage when exposed to vascular endothelial growth factors present within serum [11–13].
Adipose derived stromal/stem cells (ASCs) are another subpopulation from SVF that are multipotent and can be differentiated into adipogenic, chondrogenic, and osteogenic lineages [14,15]. Due to their multipotent nature, higher yield quantities, and ease of isolation relative to other adult stromal/stem cells, ASCs have become prominent tools in the field of tissue engineering. However, induction of endothelial differentiation of ASCs requires subjecting them to physiological shear force (to mimic the natural blood flow in capillaries) in the presence of endothelial growth supplements, vascular endothelial growth factors (VEGFs) [16,17], and/or use of complex three-dimensional cell culture systems such as spheroid culture, polyglycolic acid/polylactic acid scaffolds [18,19].
MicroRNAs (miRNAs) are short noncoding RNA nucleotides which regulate various physiological and pathological cellular mechanisms by binding to mRNA sequences and blocking their translation into proteins [20,21]. Cellular differentiation is one of the vital processes that is regulated by miRNAs. For example, studies of adipose and/or bone marrow stromal/stem cells have determined that the upregulation of miRNA 148b [22] and miR-146a [23] results in the induction of osteogenesis, upregulation of miR-150 [24] in adipogenesis, upregulation of miR-410 [25] and miR-218 [26] in chondrogenesis, and downregulation of miR-145 [27] in endotheliogenesis. However, few if any miRNAs have been reported to induce endothelial differentiation in ASCs.
In this article, we used next-generation sequencing method to sequence and identify the miRNAs expressed in CD34+ sorted ASCs during the period of endothelial differentiation at different time points. Using bioinformatic analytical techniques, we identified several miRNAs (both upregulated and downregulated) as potential candidates to induce endotheliogenesis in ASCs. The goal of this article is to present the bioinformatic findings of differentially expressed miRNAs on various time points during the period of endotheliogenesis so that it can serve as an open repository source. In vitro testing of miRNAs identified on day 3 was performed by transfecting CD34+ ASCs with either miRNA mimics (for upregulation) or anti-miRNAs (to downregulate) of the candidate miRNAs identified by Database for Annotation, Visualization and Integrated Discovery (DAVID) bioinformatics tools.
Methods
Magnetic bead sorting of CD34+ cells
All protocols were reviewed and approved by the Louisiana State University Institutional Research Board (protocols E9379 and E9119). Cryopreserved ASCs from three different donors originally harvested at P0 (Obatala Sciences, Inc., New Orleans, LA) were thawed, tested for viability, counted, and pooled together in equal amounts. The sorting of CD34+ cells from ASCs was done using CD34 MicroBead Kit (Miltenyi Biotec) according to the manufacturer's instructions. Briefly, the ASC pellet was suspended in a 300 μL of buffer (pH 7.2) containing 0.5% bovine serum albumin (BSA) and 2 mM ethylenediaminetetraaceticacid. This was followed by the addition of 100 μL of FcR blocking reagent and 100 μL of CD34 microbeads, mixed well, and incubated at 4°C for 30 min. The phycoerythrin (PE) conjugated CD34 antibody (BD Biosciences) was added to this mixture, incubated for another 5 min at 4°C, and subsequently used to characterize the CD34+ population by flow cytometry. After incubation the cells were washed and resuspended in buffer, which is then added to the magnetic separation column that is on the magnetic stand. The flow through the column contains CD34 depleted ASCs, which was collected. Later the column was removed from the magnetic stand, and more buffer was added to the column. The CD34+ cells were flushed, and the numbers of CD34+ and CD34 depleted ASCs were counted by hemocytometer. The sorted cells were then plated in six-well plates at a density of 8,000 cells per cm2 and cultured till 80%–90% confluence was obtained in basal media, which is composed of 10% fetal bovine serum (FBS), 1% antibiotics in dulbecco's modified eagle medium (DMEM)/F12 media.
CD34 surface marker characterization
The CD34+ sorted cells and CD34 depleted ASCs were stained with CD34-PE antibody during the magnetic bead sorting process as explained in the above section. Both the sorted cell populations were analyzed by flow cytometry for the expression of CD34 antibody (Supplementary Fig. S1).
Induction of endothelial differentiation
Upon reaching confluence the CD34+ cells were treated with endothelial medium containing 50 ng/mL of VEGF, 2% FBS, and 1% antibiotic in DMEM/F12 media. The CD34+ cells and CD34 depleted ASCs treated with basal medium served as controls. The media was replaced every 3 days for up to 14 days.
Endothelial staining
To confirm endothelial genesis, cells were stained using UEA I lectin conjugated with fluorescein isothiocyanate (FITC) or Von Willebrand Factor (VWF) primary antibody (Abcam; ab6994) and a secondary antibody conjugated with Alexa Fluor 488 (Abcam; ab150077). Briefly, the cells on days 3, 9, and 14 of culture were washed with phosphate-buffered saline (PBS) and fixed with 4% paraformaldehyde for 20 min at room temperature. Later, they were permeabilized with 0.1% Triton X-100 for 10 min at room temperature and washed with cold PBS thrice. Unspecific binding sites were blocked with 1% BSA in phosphate-buffered saline with Tween detergent for 30 min at room temperature. UEA I lectin FITC was then added to the cells in the dilution of 1:200 and incubated for 1 h at 4°C in the dark. After this step the cells were washed several times with PBS and imaged using fluorescence microscope. For VWF staining, VWF antibody was then added to the cells in the dilution of 1:400 and incubated for 1 h at 4°C in dark. After this step the cells were washed several times with PBS, and secondary antibody conjugated with Alexa Fluor 488 was added in a dilution of 1:200 in 1% BSA before incubating for 1 h. The cells were later washed several times with PBS. For counter staining, 4′,6-diamidino-2-phenylindole stain was added to the cells, incubated for 5 min, washed with PBS, and imaged using fluorescence microscope.
miRNA isolation and quantitation
miRNAs on the respective days were isolated using PureLink miRNA Isolation Kit (Thermo Fisher Scientific; K157001) following manufacturer's instructions. The quality and purity of miRNAs were analyzed using fragment analyzer (Advanced Analytical Technologies, Inc.) (Supplementary Fig. S2).
miRNA library preparation and sequencing
cDNA libraries were constructed using the Ion Total RNA-Seq Kit v2 (Catalog number: 4475936), protocol for the small RNA libraries. Templates for RNASeq were prepared with the Ion PI™ Hi-Q OT2 200 Template Kit (A26434) using the Ion OneTouch™ 2 System for Ion Proton™ System semiconductor sequencing. These templates were sequenced using the Ion PI Hi-Q Sequencing 200 Kit (A26433) and Ion PI Chip v3 on the Ion Proton Sequencer. Preliminary analysis of the ensuing sequencing data pertaining to quality of the run, read lengths, and coverage was performed using the torrent suite software.
miRNA-Seq data alignment and data analysis
The FastQ files obtained from sequencing were used to generate output alignments translated into transcript coordinates by STAR program that were later used as an input for RSEM program to find expression [28]. The output bam files were sorted and visualized using Integrated Genomics Viewer to check for proper alignment [29]. Later, bedtools program was used to extract the miRNA data by interspersing the bam files with mature human miRNA sequences from miRbase.org The miRNAs with low counts <25 were filtered out, and the differential expression was calculated using edgeR program in R [30]. The miRNAs with P values <0.05 were considered significant for further analysis. The miRNAs with fold change (FC) above 1.2 or below 0.8 are only considered as either upregulated or downregulated. The data discussed in this publication have been deposited in National Center for Biotechnology Information's Gene Expression Omnibus (GEO) [31] and are accessible through GEO Series accession number GSE151561(https://www.ncbi.nlm.nih.gov/geo/query/acc.cgi?acc=GSE151561)
Kyoto Encyclopedia of Genes and Genomes analysis of experimentally validated miRNA targets
Experimentally validated miRNA targets for each differentially expressed miRNA at various time points were obtained through miRWalk [32,33]. miRWalk algorithm finds out the experimentally validated published interactions on miRNA-gene targets. To obtain the miRNA targets, the mirbase database was selected in the miRWalk program. Kyoto Encyclopedia of Genes and Genomes (KEGG) analysis was performed on these miRNA targeted genes using DAVID bioinformatics [34,35]. The miRNA-gene targets and the respective pathways are presented in Supplementary Table S4.
miRNAs or anti-MiRNA mimics transfection
The sequences for miRNA and anti-miRNA mimics, listed in Supplementary Tables S1 and S2, were purchased from IDTdna Technologies. Transfection of these was transfected into CD34+ ASCs at concentrations of 400, 800, 1,600, and 3,200 nM individually using RNAiMAX transfecting reagent as per manufacturer's guidelines (Thermo Fisher Scientific; 13778030). After 24 h of transfection the media was replaced and cells were cultured for 14 days at which time the cells were stained with VWF antibody as explained above in the “Endothelial staining” section and examined under fluorescence microscopy.
RNA isolation, reverse transcription, and quantitative real time–polymerase chain reaction
RNA was isolated using the PureLink RNA Kit (Life Technologies, Carlsbad, CA) according to the manufacturer's instructions on day 14 for adipogenic samples and on day 21 for osteogenic samples. The quality and quantity of isolated RNA were measured using a NanoDrop spectrophotometer (Thermo Fisher Scientific, Waltham, MA). The first strand cDNA synthesis was done using a High Capacity cDNA Synthesis Kit (Applied Biosciences, Beverly Hills, CA). For quantitative real time–polymerase chain reaction (qRT-PCR), a SYBR Green (Applied Biosystems) Kit was used as per the manufacturer's instructions for the ABI-7900 qRT-PCR machine. The primer sequences used in this study are listed in Supplementary Table S3. The FC in gene expression was normalized to glyceraldehyde 3-phosphate dehydrogenase and FC calculated by 2ΔΔCt method [36].
Results
Endothelial differentiation
The sorted CD34+ ASCs were cultured until reaching 90% confluence and then treated with endothelial media containing 50 ng/mL of VEGF for 14 days. Positive fluorescence staining of UEA I lectin was observed on days 9 and 14 with CD34+ ASCs treated with endothelial media, whereas no staining was observed in the control samples (treated with basal media), as well as samples on day 3 (Fig. 1). The cells imaged on day 3 did not show any fluorescence. The qRT-PCR evaluation of endothelial gene biomarkers [endothelial nitric oxide synthase (eNOS), VWF, and CD31] on days 3, 9, and 14 indicated an increase in expression (Fig. 2). The expression of endothelial genes was found to be increasing from day 3 and 9 with a maximum on day 14. Thus, UEA I lectin fluorescence staining and qRT-PCR endothelial gene evaluation studies indicated the differentiation of CD34+ ASCs along the endothelial pathway.
FIG. 1.

Endothelial differentiation of CD34+ sorted ASCs stained with UEA I lectin—fluorescein isothiocyanate. Top two rows: CD34+ sorted ASCs treated with either endothelial or basal media for 14 days, Middle two rows: 9 days, and Bottom two rows: 3 days; Fluorescent and bright field images are taken from the same cells. No fluorescence was observed from the samples treated for 3 days. Images shown are of magnification of 10 × and scale bar 100 μm. ASC, adipose derived stromal/stem cell.
FIG. 2.
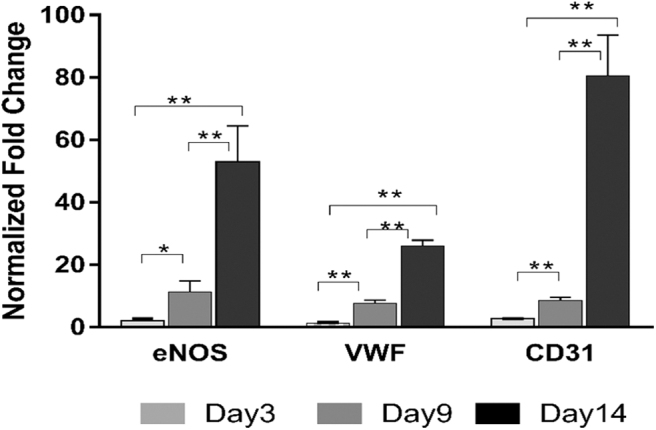
qRT-PCR. The bar graph shown indicates the relative fold change expression of endothelial genes (eNOS, VWF, CD31) in CD34+ sorted ASCs treated with endothelial media (Endo-CD34+) in relation to control/basal media treated CD34+ sorted ASCs on days 3, 9, and 14; *P value <0.05 and **P value <0.02. Two tailed Student's t-test was employed, with P < 0.05 considered significant. The experiments were repeated thrice on the ASCs derived from each donor (n = 3 per group). A total of three donors were used in the study. qRT-PCR, quantitative real time–polymerase chain reaction; eNOS, endothelial nitric oxide synthase; VWF, Von Willebrand factor.
miRNA expression by miRNA-Seq
Heat maps indicated the expression of miRNAs on day 3, 9, and 14 with P values <0.05 at one or more time points (Figs. 3 and 4). The top five upregulated miRNAs on day 3 are miRs 330-5p FC (FC 2.16), let7c-3p (FC 2.13), 15b-5p (FC 1.9), 99a-5p (FC 1.86), and 335-5p (FC 1.76), while top five downregulated miRNAs are miRs 342-5p (FC 0.43), 32-3p (FC 0.48), 455-3p (FC 0.51), 32-5p (FC 0.54), and let7a-2-3p (FC 0.56). Similarly for day 9, the upregulated miRNAs are 190a-5p (FC 6.16), 126-3p (FC 4.84), 1301-3p (FC 4.80), 195-5p (FC 4.55), and let7c-5p (FC 4.46), and the downregulated ones are miRNAs 181a-2-3p (FC 0.19), 4638-3p (FC 0.24), 574-5p (FC 0.25), let-7a-3p (FC 0.38), and let-7e-3p (FC 0.39). On day 14, the miRNAs 126-3p (FC 11.86), 204-5p (FC 8.41), 675-5p (FC 3.89), 99a-5p (FC 3.27), and 335-5p (FC 3.04) are upregulated, and the miRNAs 143-5p (FC 0.32), 342-5p (FC 0.36), 155-5p (FC 0.36), 146a-5p (0.41), and 145-5p (FC 0.42) are downregulated. Furthermore, the miRNAs shared in common across all time points were displayed using Venn diagrams (Fig. 5; Tables 1 and 2).
FIG. 3.

The expression of upregulated miRNAs on days 3, 9, and 14. Log 2 of fold change shown in the heatmaps. (A) miRNAs with higher expression on day 3 with fold change above 1.2 and P value <0.05. (B) miRNAs with higher expression on day 9 with fold change above 1.2 and P value <0.05. (C) miRNAs with higher expression on day 14 with fold change above 1.2 and P value <0.05. The P-values showed here are a result of differential expression analysis performed using edgeR program. miRNA, microRNA.
FIG. 4.

The expression of downregulated miRNAs on days 3, 9, and 14. Log 2 of fold change shown in the heatmaps. (A) miRNAs with lowest expression on day 3 with fold change below 0.8 and P value <0.05. (B) miRNAs with lowest expression on day 9 with fold change below 0.8 and P value <0.05. (C) miRNAs with lowest expression on day 14 with fold change below 0.8 and P value <0.05. The P-values showed here are a result of differential expression analysis performed using edgeR program.
FIG. 5.

The number of miRNAs expressed on days 3, 9, and 14 during CD34+ ASC differentiation into endothelial cells. (A) Upregulated miRNAs. (B) Downregulated miRNAs.
Table 1.
Upregulated microRNAs That Are Common Between Days 3, 9, and 14 During CD34+ Adipose Derived Stromal/Stem Cells Differentiating into Endothelial Cells
| Day 3, 9, and 14 | Day 3 and 9 | Day 9 and 14 | Day 3 and 14 |
|---|---|---|---|
| let-7c-3p | let-7c-3p | miR-126-3p | miR-10395-3p |
| miR-1301-3p | miR-1301-3p | miR-1301-3p | let-7c-3p |
| let-7c-5p | miR-10395-5p | ||
| let-7c-3p | miR-99a-5p | ||
| miR-379-5p | miR-335-5p | ||
| let-7b-5p | miR-199b-5p | ||
| let-7d-5p | miR-675-5p | ||
| miR-362-5p | miR-1301-3p | ||
| miR-218-5p | miR-423-5p | ||
| miR-454-3p | miR-3184-3p | ||
| miR-152-3p | miR-10396b-3p | ||
| miR-23b-3p |
Table 2.
Downregulated microRNAs That Are Common Between Days 3, 9, and 14 During CD34+ Adipose Derived Stromal/Stem Cells Differentiating into Endothelial Cells
| Day 3, 9, and 14 | Day 3 and 9 | Day 9 and 14 | Day 3 and 14 |
|---|---|---|---|
| miR-145-5p | miR-145-5p | miR-3675-5p | miR-23a-3p |
| miR-138-5p | miR-138-5p | miR-3675-3p | miR-145-5p |
| miR-31-3p | miR-31-3p | miR-574-5p | miR-138-5p |
| miR-193a-3p | miR-574-3p | miR-221-5p | |
| let-7a-3p | miR-31-5p | ||
| miR-143-5p | miR-155-5p | ||
| miR-671-5p | miR-31-3p | ||
| let-7i-3p | miR-29a-5p | ||
| miR-138-5p | let-7a-2-3p | ||
| miR-143-3p | miR-342-5p | ||
| miR-452-3p | |||
| miR-452-5p | |||
| miR-19b-3p | |||
| miR-652-5p | |||
| miR-222-5p | |||
| miR-31-3p | |||
| miR-30a-5p | |||
| miR-145-5p |
KEGG analysis of experimentally validated miRNA targets
All the miRNA targets that are used for the KEGG analysis are presented in a supplemental excel file in multiple worksheets. The enriched pathways modulated by the miRNAs at each time point were determined (Figs. 6–8). The P-values and number of genes within each pathway targeted by the miRNA are shown in Tables 1 and 2. The enriched pathways found from KEGG analysis included ErbB signaling, NF-KB signaling, Notch signaling, hypoxia inducible factor (HIF) signaling, phosphoinositide 3-kinase (PI3K)-AKT signaling, P53 signaling, VEGF signaling, Hippo signaling, Ras signaling, Rap1 signaling, mTOR signaling, tumor necrosis factor (TNF) signaling, transforming growth factor-beta (TGF-β) signaling, Insulin signaling, mitogen-activated protein kinase (MAPK) signaling, cGMP-PKG signaling, and cAMP signaling (Figs. 6–8; Tables 3–8). The genes associated with the specific miRNAs at various time points are shown in the Supplementary Table S4.
FIG. 6.

Enriched pathways from the genes targeted by the upregulated (left) and downregulated miRNAs (right) on day 3. From all the day 3 upregulated miRNAs, KEGG analysis suggested that miRNAs 181a-5p, 330-5p, 335-3p, 15b-5p, 99a-5p, 199a-5p are targeting the genes associated with the pathways as shown (left). Similarly, the downregulated miRNAs 145-5p, 155-5p, 193a-3p, 125a-5p, 221-5p, 222-3p are targeting the genes associated with the pathways as shown (right). The miRNAs are shown in yellow diamonds with the pink lines to the targeted pathways in blue nodes. KEGG, Kyoto Encyclopedia of Genes and Genomes.
FIG. 7.

Enriched pathways from the genes targeted by the upregulated (left) and downregulated miRNAs (right) on day 9. The miRNAs are shown in yellow diamonds with the pink lines to the targeted pathways in blue nodes. From all the day 9 upregulated miRNAs, KEGG analysis suggested that represented miRNAs are targeting the genes associated with the pathways as shown.
FIG. 8.

Enriched pathways from the genes targeted by the upregulated (left) and downregulated miRNAs (right) on day 14. The miRNAs are shown in yellow diamonds with the pink lines to the targeted pathways in blue nodes. From all the day 14 upregulated miRNAs, KEGG analysis suggested that represented miRNAs are targeting the genes associated with the pathways as shown.
Table 3.
Day 3 Upregulated microRNAs and Their Potential Target Pathways
| miRNA | Pathway | No. of genes | P value |
|---|---|---|---|
| miR-15b-5p | p53 signaling pathway | 12 | 1.90E-04 |
| PI3K-AKT signaling pathway | 32 | 2.00E-04 | |
| Insulin signaling pathway | 17 | 5.10E-04 | |
| Phosphatidylinositol signaling system | 13 | 1.60E-03 | |
| ErbB signaling pathway | 12 | 1.90E-03 | |
| MAPK signaling pathway | 21 | 1.20E-02 | |
| HIF-1 signaling pathway | 11 | 1.30E-02 | |
| FoxO signaling pathway | 13 | 1.90E-02 | |
| Hippo signaling pathway | 14 | 2.00E-02 | |
| mTOR signaling pathway | 7 | 4.70E-02 | |
| Wnt signaling pathway | 12 | 5.00E-02 | |
| TGF-beta signaling pathway | 8 | 8.80E-02 | |
| miR-99a-5p | HIF-1 signaling pathway | 5 | 1.10E-02 |
| cGMP-PKG signaling pathway | 5 | 6.10E-02 | |
| Endocrine regulated calcium reabsorption | 3 | 6.10E-02 | |
| miR-145-3p | FoxO signaling pathway | 4 | 5.50E-03 |
| miR-181a-5p | MAPK signaling pathway | 22 | 5.90E-06 |
| FoxO signaling pathway | 13 | 3.00E-04 | |
| Hippo signaling pathway | 12 | 2.90E-03 | |
| VEGF signaling pathway | 7 | 6.30E-03 | |
| TGF-beta signaling pathway | 8 | 8.10E-03 | |
| HIF-1 signaling pathway | 8 | 1.80E-02 | |
| TNF signaling pathway | 8 | 2.60E-02 | |
| NF-kappa B signaling pathway | 7 | 3.20E-02 | |
| Notch signaling pathway | 5 | 4.20E-02 | |
| Adherens junction | 6 | 4.50E-02 | |
| PI3K-AKT signaling pathway | 16 | 5.20E-02 | |
| Wnt signaling pathway | 8 | 8.50E-02 | |
| ErbB signaling pathway | 6 | 9.10E-02 | |
| Ras signaling pathway | 11 | 9.30E-02 | |
| miR-199a-5p | TNF signaling pathway | 6 | 1.90E-03 |
| HIF-1 signaling pathway | 5 | 9.00E-03 | |
| Adherens junction | 4 | 2.10E-02 | |
| NF-kappa B signaling pathway | 4 | 3.60E-02 | |
| Hippo signaling pathway | 5 | 3.70E-02 | |
| miR-330-5p | AMPK signaling pathway | 5 | 1.10E-02 |
| Insulin signaling pathway | 5 | 1.60E-02 | |
| cGMP-PKG signaling pathway | 5 | 2.90E-02 | |
| FoxO signaling pathway | 4 | 6.90E-02 | |
| VEGF signaling pathway | 3 | 6.90E-02 | |
| miR-335-5p | PI3K-AKT signaling pathway | 69 | 1.70E-04 |
| Ras signaling pathway | 48 | 5.00E-04 | |
| Calcium signaling pathway | 38 | 2.20E-03 | |
| MAPK signaling pathway | 49 | 4.00E-03 | |
| Rap1 signaling pathway | 37 | 4.40E-02 | |
| Hippo signaling pathway | 28 | 4.70E-02 | |
| Wnt signaling pathway | 26 | 4.80E-02 | |
| TGF-beta signaling pathway | 17 | 6.90E-02 | |
| cAMP signaling pathway | 34 | 7.10E-02 | |
| miR-423-5p | MAPK signaling pathway | 9 | 5.90E-02 |
| p53 signaling pathway | 4 | 9.80E-02 | |
| let-7c-3p | Insulin signaling pathway | 6 | 1.70E-03 |
miRNA, microRNA.
Table 4.
Day 3 Downregulated microRNAs and Their Potential Target Pathways
| miRNA | Pathway | No. of genes | P value |
|---|---|---|---|
| let-7a-2-3p | Adherens junction | 3 | 5.20E-02 |
| miR-23a-3p | p53 signaling pathway | 4 | 6.30E-02 |
| miR-27b-3p | Insulin signaling pathway | 12 | 4.30E-04 |
| AMPK signaling pathway | 10 | 2.50E-03 | |
| TGF-beta signaling pathway | 8 | 3.80E-03 | |
| Ras signaling pathway | 13 | 7.70E-03 | |
| FoxO signaling pathway | 9 | 1.50E-02 | |
| Adherens junction | 6 | 2.70E-02 | |
| MAPK signaling pathway | 12 | 4.10E-02 | |
| ErbB signaling pathway | 6 | 5.60E-02 | |
| miR-125a-5p | HIF-1 signaling pathway | 11 | 1.60E-06 |
| ErbB signaling pathway | 9 | 4.10E-05 | |
| AMPK signaling pathway | 8 | 2.20E-03 | |
| PI3K-AKT signaling pathway | 13 | 5.00E-03 | |
| MAPK signaling pathway | 10 | 1.30E-02 | |
| TNF signaling pathway | 6 | 2.10E-02 | |
| Adherens junction | 5 | 2.10E-02 | |
| TGF-beta signaling pathway | 5 | 3.60E-02 | |
| Insulin signaling pathway | 6 | 5.50E-02 | |
| miR-138-5p | p53 signaling pathway | 5 | 8.20E-04 |
| Hippo signaling pathway | 5 | 1.50E-02 | |
| AMPK signaling pathway | 4 | 4.20E-02 | |
| Wnt signaling pathway | 4 | 5.70E-02 | |
| Adherens junction | 3 | 7.50E-02 | |
| miR-145-5p | FoxO signaling pathway | 12 | 1.00E-05 |
| ErbB signaling pathway | 10 | 1.10E-05 | |
| PI3K-AKT signaling pathway | 18 | 3.90E-05 | |
| TGF-beta signaling pathway | 9 | 6.20E-05 | |
| Adherens junction | 8 | 1.50E-04 | |
| MAPK signaling pathway | 14 | 2.50E-04 | |
| p53 signaling pathway | 7 | 7.40E-04 | |
| Hippo signaling pathway | 10 | 7.70E-04 | |
| HIF-1 signaling pathway | 8 | 1.10E-03 | |
| mTOR signaling pathway | 6 | 2.50E-03 | |
| GnRH signaling pathway | 7 | 3.60E-03 | |
| Rap1 signaling pathway | 10 | 7.20E-03 | |
| Ras signaling pathway | 10 | 1.10E-02 | |
| Wnt signaling pathway | 7 | 2.50E-02 | |
| Notch signaling pathway | 4 | 4.30E-02 | |
| Insulin signaling pathway | 6 | 7.50E-02 | |
| miR-155-5p | TNF signaling pathway | 20 | 9.40E-06 |
| FoxO signaling pathway | 21 | 8.70E-05 | |
| HIF-1 signaling pathway | 16 | 5.00E-04 | |
| AMPK signaling pathway | 17 | 1.80E-03 | |
| PI3K-AKT signaling pathway | 34 | 3.20E-03 | |
| Adherens junction | 11 | 7.70E-03 | |
| Insulin signaling pathway | 16 | 1.40E-02 | |
| mTOR signaling pathway | 9 | 1.80E-02 | |
| ErbB signaling pathway | 11 | 2.90E-02 | |
| Hippo signaling pathway | 16 | 3.00E-02 | |
| Wnt signaling pathway | 15 | 3.00E-02 | |
| Rap1 signaling pathway | 19 | 6.40E-02 | |
| Hedgehog signaling pathway | 5 | 6.90E-02 | |
| p53 signaling pathway | 8 | 9.40E-02 | |
| miR-193a-3p | ErbB signaling pathway | 4 | 2.00E-02 |
| GnRH signaling pathway | 4 | 2.20E-02 | |
| PI3K-AKT signaling pathway | 6 | 7.80E-02 | |
| Adherens junction | 3 | 8.10E-02 | |
| MAPK signaling pathway | 5 | 8.80E-02 | |
| miR-221-5p | Calcium signaling pathway | 5 | 2.80E-02 |
| miR-222-3p | PI3K-AKT signaling pathway | 16 | 9.20E-03 |
| FoxO signaling pathway | 9 | 9.50E-03 | |
| AMPK signaling pathway | 8 | 1.80E-02 | |
| Hippo signaling pathway | 8 | 5.00E-02 | |
| p53 signaling pathway | 5 | 6.10E-02 | |
| miR-425-3p | cAMP signaling pathway | 3 | 8.40E-02 |
| miR-455-3p | p53 signaling pathway | 5 | 8.20E-02 |
Table 5.
Day 9 Upregulated microRNAs and Their Potential Target Pathways
| miRNA | Pathway | No. of genes | P value |
|---|---|---|---|
| miR-10a-5p | AMPK signaling pathway | 9 | 2.10E-02 |
| Hippo signaling pathway | 10 | 2.50E-02 | |
| Wnt signaling pathway | 9 | 3.90E-02 | |
| Insulin signaling pathway | 9 | 3.90E-02 | |
| Adherens junction | 6 | 4.80E-02 | |
| MAPK signaling pathway | 13 | 5.30E-02 | |
| miR-10b-5p | p53 signaling pathway | 6 | 8.30E-03 |
| Wnt signaling pathway | 7 | 4.50E-02 | |
| Notch signaling pathway | 4 | 6.10E-02 | |
| miR-15a-5p | PI3K-AKT signaling pathway | 35 | 3.20E-06 |
| p53 signaling pathway | 11 | 4.80E-04 | |
| MAPK signaling pathway | 24 | 4.90E-04 | |
| ErbB signaling pathway | 11 | 3.70E-03 | |
| Insulin signaling pathway | 14 | 5.70E-03 | |
| Wnt signaling pathway | 14 | 5.70E-03 | |
| FoxO signaling pathway | 13 | 1.10E-02 | |
| Hippo signaling pathway | 14 | 1.20E-02 | |
| Phosphatidylinositol signaling system | 10 | 2.30E-02 | |
| Ras signaling pathway | 17 | 3.10E-02 | |
| HIF-1 signaling pathway | 9 | 5.60E-02 | |
| AMPK signaling pathway | 10 | 7.50E-02 | |
| TNF signaling pathway | 9 | 8.10E-02 | |
| miR-16-5p | PI3K-AKT signaling pathway | 59 | 2.40E-05 |
| p53 signaling pathway | 17 | 5.90E-04 | |
| Hippo signaling pathway | 27 | 3.10E-03 | |
| Insulin signaling pathway | 25 | 3.80E-03 | |
| ErbB signaling pathway | 17 | 9.80E-03 | |
| AMPK signaling pathway | 21 | 1.50E-02 | |
| FoxO signaling pathway | 22 | 2.10E-02 | |
| HIF-1 signaling pathway | 17 | 2.90E-02 | |
| Wnt signaling pathway | 21 | 4.90E-02 | |
| mTOR signaling pathway | 11 | 5.40E-02 | |
| TGF-beta signaling pathway | 14 | 6.50E-02 | |
| Adherens junction | 12 | 8.50E-02 | |
| miR-21-5p | MAPK signaling pathway | 25 | 6.80E-06 |
| HIF-1 signaling pathway | 14 | 2.90E-05 | |
| FoxO signaling pathway | 16 | 5.40E-05 | |
| TNF signaling pathway | 12 | 1.00E-03 | |
| TGF-beta signaling pathway | 10 | 2.30E-03 | |
| PI3K-AKT signaling pathway | 23 | 3.90E-03 | |
| Hippo signaling pathway | 13 | 5.90E-03 | |
| p53 signaling pathway | 8 | 8.10E-03 | |
| NF-kappa B signaling pathway | 9 | 1.00E-02 | |
| Ras signaling pathway | 15 | 2.50E-02 | |
| Rap1 signaling pathway | 14 | 3.00E-02 | |
| miR-23b-3p | FoxO signaling pathway | 9 | 4.00E-03 |
| NF-kappa B signaling pathway | 7 | 6.20E-03 | |
| cAMP signaling pathway | 9 | 3.50E-02 | |
| MAPK signaling pathway | 10 | 5.50E-02 | |
| Notch signaling pathway | 4 | 6.30E-02 | |
| Ras signaling pathway | 9 | 6.70E-02 | |
| ErbB signaling pathway | 5 | 8.40E-02 | |
| miR-26a-5p | p53 signaling pathway | 12 | 9.40E-07 |
| PI3K-AKT signaling pathway | 19 | 3.50E-03 | |
| Wnt signaling pathway | 10 | 9.40E-03 | |
| Hippo signaling pathway | 10 | 1.60E-02 | |
| FoxO signaling pathway | 9 | 2.30E-02 | |
| miR-92a-3p | p53 signaling pathway | 13 | 7.10E-03 |
| FoxO signaling pathway | 20 | 1.20E-02 | |
| PI3K-AKT signaling pathway | 41 | 1.30E-02 | |
| TGF-beta signaling pathway | 14 | 1.70E-02 | |
| Hippo signaling pathway | 21 | 2.00E-02 | |
| AMPK signaling pathway | 17 | 3.80E-02 | |
| Wnt signaling pathway | 18 | 5.50E-02 | |
| Endocrine regulated calcium reabsorption | 8 | 6.90E-02 | |
| Notch signaling pathway | 8 | 9.10E-02 | |
| ErbB signaling pathway | 12 | 9.40E-02 | |
| HIF-1 signaling pathway | 13 | 9.90E-02 | |
| miR-92b-3p | PI3K-AKT signaling pathway | 21 | 1.80E-02 |
| FoxO signaling pathway | 11 | 1.90E-02 | |
| TGF-beta signaling pathway | 8 | 2.70E-02 | |
| cGMP-PKG signaling pathway | 12 | 3.10E-02 | |
| MAPK signaling pathway | 15 | 6.30E-02 | |
| Hippo signaling pathway | 10 | 8.30E-02 | |
| miR-103a-3p | AMPK signaling pathway | 10 | 2.40E-03 |
| PI3K-AKT signaling pathway | 16 | 1.70E-02 | |
| p53 signaling pathway | 6 | 2.10E-02 | |
| Hippo signaling pathway | 9 | 2.70E-02 | |
| Phosphatidylinositol signaling system | 7 | 2.90E-02 | |
| mTOR signaling pathway | 5 | 4.80E-02 | |
| miR-126-3P | FoxO signaling pathway | 8 | 1.60E-06 |
| Rap1 signaling pathway | 9 | 2.80E-06 | |
| PI3K-AKT signaling pathway | 10 | 1.30E-05 | |
| Insulin signaling pathway | 7 | 2.80E-05 | |
| ErbB signaling pathway | 6 | 3.70E-05 | |
| HIF-1 signaling pathway | 6 | 6.60E-05 | |
| VEGF signaling pathway | 5 | 1.40E-04 | |
| Ras signaling pathway | 7 | 4.20E-04 | |
| TNF signaling pathway | 5 | 1.20E-03 | |
| Leukocyte transendothelial migration | 5 | 1.80E-03 | |
| mTOR signaling pathway | 4 | 2.10E-03 | |
| NF-kappa B signaling pathway | 4 | 6.70E-03 | |
| cAMP signaling pathway | 5 | 1.10E-02 | |
| cGMP-PKG signaling pathway | 4 | 3.70E-02 | |
| miR-152-3p | PI3K-AKT signaling pathway | 13 | 3.80E-05 |
| AMPK signaling pathway | 6 | 4.30E-03 | |
| FoxO signaling pathway | 6 | 6.30E-03 | |
| Ras signaling pathway | 7 | 1.40E-02 | |
| ErbB signaling pathway | 4 | 4.10E-02 | |
| Hippo signaling pathway | 5 | 4.40E-02 | |
| miR-190a-5p | FoxO signaling pathway | 3 | 5.10E-02 |
| PI3K-AKT signaling pathway | 4 | 6.60E-02 | |
| miR-195-5p | PI3K-AKT signaling pathway | 32 | 4.00E-06 |
| p53 signaling pathway | 12 | 3.20E-05 | |
| FoxO signaling pathway | 15 | 4.40E-04 | |
| Insulin signaling pathway | 15 | 6.00E-04 | |
| ErbB signaling pathway | 11 | 1.40E-03 | |
| Hippo signaling pathway | 15 | 1.50E-03 | |
| Wnt signaling pathway | 13 | 5.30E-03 | |
| MAPK signaling pathway | 19 | 6.80E-03 | |
| Phosphatidylinositol signaling system | 10 | 1.10E-02 | |
| AMPK signaling pathway | 11 | 1.60E-02 | |
| Ras signaling pathway | 16 | 2.20E-02 | |
| mTOR signaling pathway | 6 | 6.40E-02 | |
| HIF-1 signaling pathway | 8 | 7.30E-02 | |
| VEGF signaling pathway | 6 | 7.60E-02 | |
| miR-196a-5p | FoxO signaling pathway | 6 | 8.80E-02 |
| miR-218-5p | PI3K-AKT signaling pathway | 31 | 1.40E-03 |
| Adherens junction | 11 | 2.20E-03 | |
| Hippo signaling pathway | 16 | 6.60E-03 | |
| Ras signaling pathway | 21 | 6.90E-03 | |
| Wnt signaling pathway | 14 | 1.70E-02 | |
| Rap1 signaling pathway | 17 | 5.00E-02 | |
| ErbB signaling pathway | 9 | 6.10E-02 | |
| AMPK signaling pathway | 11 | 7.40E-02 | |
| miR-221-5p | Calcium signaling pathway | 5 | 2.80E-02 |
| miR-222-3p | PI3K-AKT signaling pathway | 16 | 9.20E-03 |
| FoxO signaling pathway | 9 | 9.50E-03 | |
| AMPK signaling pathway | 8 | 1.80E-02 | |
| Hippo signaling pathway | 8 | 5.00E-02 | |
| p53 signaling pathway | 5 | 6.10E-02 | |
| miR-301a-3p | FoxO signaling pathway | 9 | 4.20E-03 |
| p53 signaling pathway | 6 | 9.10E-03 | |
| TGF-beta signaling pathway | 6 | 2.30E-02 | |
| Adherens junction | 5 | 4.70E-02 | |
| Hippo signaling pathway | 7 | 7.10E-02 | |
| miR-362-5p | PI3K-AKT signaling pathway | 4 | 4.30E-02 |
| miR-454-3p | TGF-beta signaling pathway | 6 | 2.10E-02 |
| p53 signaling pathway | 5 | 3.70E-02 | |
| FoxO signaling pathway | 7 | 4.00E-02 | |
| Adherens junction | 5 | 4.40E-02 | |
| miR-494-3p | FoxO signaling pathway | 7 | 1.00E-03 |
| HIF-1 signaling pathway | 6 | 1.50E-03 | |
| p53 signaling pathway | 5 | 2.60E-03 | |
| PI3K-AKT signaling pathway | 10 | 2.70E-03 | |
| Hippo signaling pathway | 6 | 9.70E-03 | |
| mTOR signaling pathway | 4 | 1.40E-02 | |
| Insulin signaling pathway | 5 | 3.10E-02 | |
| cGMP-PKG signaling pathway | 5 | 5.50E-02 | |
| MAPK signaling pathway | 6 | 7.00E-02 | |
| AMPK signaling pathway | 4 | 8.90E-02 | |
| cAMP signaling pathway | 5 | 9.20E-02 | |
| let-7a-5p | p53 signaling pathway | 15 | 5.60E-08 |
| FoxO signaling pathway | 17 | 1.70E-05 | |
| ErbB signaling pathway | 11 | 8.90E-04 | |
| PI3K-AKT signaling pathway | 23 | 4.80E-03 | |
| HIF-1 signaling pathway | 10 | 7.30E-03 | |
| VEGF signaling pathway | 7 | 2.00E-02 | |
| MAPK signaling pathway | 15 | 6.50E-02 | |
| Hippo signaling pathway | 10 | 8.40E-02 | |
| let-7b-5p | AMPK signaling pathway | 19 | 1.60E-03 |
| p53 signaling pathway | 13 | 1.80E-03 | |
| FoxO signaling pathway | 20 | 1.90E-03 | |
| Adherens junction | 12 | 8.60E-03 | |
| Insulin signaling pathway | 18 | 1.30E-02 | |
| HIF-1 signaling pathway | 14 | 1.60E-02 | |
| Hippo signaling pathway | 18 | 3.00E-02 | |
| ErbB signaling pathway | 12 | 3.50E-02 | |
| TGF-beta signaling pathway | 11 | 6.10E-02 | |
| let-7d-5p | p53 signaling pathway | 6 | 6.40E-03 |
| FoxO signaling pathway | 8 | 9.30E-03 | |
| PI3K-AKT signaling pathway | 12 | 4.10E-02 | |
| Jak-STAT signaling pathway | 7 | 4.30E-02 | |
| Hippo signaling pathway | 7 | 5.00E-02 | |
| HIF-1 signaling pathway | 5 | 9.50E-02 | |
| let-7f-5p | p53 signaling pathway | 9 | 5.00E-05 |
| Hippo signaling pathway | 9 | 1.00E-02 | |
| FoxO signaling pathway | 8 | 1.70E-02 | |
| Jak-STAT signaling pathway | 8 | 2.60E-02 | |
| TGF-beta signaling pathway | 5 | 8.70E-02 |
Table 6.
Day 9 Downregulated microRNAs and Their Potential Target Pathways
| miRNA | Pathway | No. of genes | P value |
|---|---|---|---|
| miR-19b-3p | FoxO signaling pathway | 15 | 6.80E-04 |
| TNF signaling pathway | 13 | 8.00E-04 | |
| p53 signaling pathway | 10 | 1.10E-03 | |
| TGF-beta signaling pathway | 11 | 1.50E-03 | |
| Rap1 signaling pathway | 17 | 7.60E-03 | |
| MAPK signaling pathway | 19 | 1.00E-02 | |
| cAMP signaling pathway | 15 | 2.20E-02 | |
| mTOR signaling pathway | 7 | 2.40E-02 | |
| Ras signaling pathway | 16 | 3.00E-02 | |
| Hippo signaling pathway | 12 | 3.30E-02 | |
| Insulin signaling pathway | 11 | 4.20E-02 | |
| AMPK signaling pathway | 10 | 4.80E-02 | |
| Wnt signaling pathway | 10 | 8.90E-02 | |
| miR27a-5p | cAMP signaling pathway | 3 | 5.20E-02 |
| miR-30a-5p | p53 signaling pathway | 8 | 3.20E-02 |
| FoxO signaling pathway | 12 | 4.10E-02 | |
| Adherens junction | 8 | 4.10E-02 | |
| Ras signaling pathway | 16 | 8.80E-02 | |
| ErbB signaling pathway | 8 | 1.00E-01 | |
| miR-31-3p | TGF-beta signaling pathway | 3 | 3.70E-02 |
| miR-125a-3p | MAPK signaling pathway | 8 | 6.90E-02 |
| Endocytosis | 8 | 7.30E-02 | |
| Rap1 signaling pathway | 7 | 7.70E-02 | |
| miR-138-5p | p53 signaling pathway | 5 | 8.20E-04 |
| Hippo signaling pathway | 5 | 1.50E-02 | |
| AMPK signaling pathway | 4 | 4.20E-02 | |
| Wnt signaling pathway | 4 | 5.70E-02 | |
| miR-145-5p | FoxO signaling pathway | 12 | 1.00E-05 |
| ErbB signaling pathway | 10 | 1.10E-05 | |
| PI3K-AKT signaling pathway | 18 | 3.90E-05 | |
| TGF-beta signaling pathway | 9 | 6.20E-05 | |
| MAPK signaling pathway | 14 | 2.50E-04 | |
| p53 signaling pathway | 7 | 7.40E-04 | |
| Hippo signaling pathway | 10 | 7.70E-04 | |
| HIF-1 signaling pathway | 8 | 1.10E-03 | |
| mTOR signaling pathway | 6 | 2.50E-03 | |
| GnRH signaling pathway | 7 | 3.60E-03 | |
| Rap1 signaling pathway | 10 | 7.20E-03 | |
| Ras signaling pathway | 10 | 1.10E-02 | |
| Wnt signaling pathway | 7 | 2.50E-02 | |
| Notch signaling pathway | 4 | 4.30E-02 | |
| Insulin signaling pathway | 6 | 7.50E-02 | |
| miR-186-5p | TGF-beta signaling pathway | 9 | 2.40E-02 |
| Hippo signaling pathway | 12 | 5.20E-02 | |
| miR-193a-3p | ErbB signaling pathway | 4 | 2.00E-02 |
| GnRH signaling pathway | 4 | 2.20E-02 | |
| PI3K-AKT signaling pathway | 6 | 7.80E-02 | |
| MAPK signaling pathway | 5 | 8.80E-02 | |
| miR-193b-3p | p53 signaling pathway | 11 | 2.40E-03 |
| AMPK signaling pathway | 13 | 2.70E-02 | |
| miR-222-5p | PI3K-AKT signaling pathway | 6 | 1.50E-02 |
| miR-361-5p | p53 signaling pathway | 4 | 2.60E-02 |
| miR-365a-3p | PI3K-AKT signaling pathway | 10 | 1.80E-04 |
| FoxO signaling pathway | 6 | 1.20E-03 | |
| Insulin signaling pathway | 5 | 9.50E-03 | |
| Wnt signaling pathway | 5 | 9.50E-03 | |
| Ras signaling pathway | 6 | 1.10E-02 | |
| cAMP signaling pathway | 5 | 3.10E-02 | |
| AMPK signaling pathway | 4 | 3.70E-02 | |
| VEGF signaling pathway | 3 | 5.30E-02 | |
| Jak-STAT signaling pathway | 4 | 5.70E-02 | |
| MAPK signaling pathway | 5 | 6.80E-02 | |
| ErbB signaling pathway | 3 | 9.80E-02 | |
| miR-505-3p | Hippo signaling pathway | 8 | 2.10E-03 |
| Wnt signaling pathway | 7 | 6.10E-03 | |
| FoxO signaling pathway | 6 | 2.20E-02 | |
| Hedgehog signaling pathway | 3 | 4.10E-02 | |
| TGF-beta signaling pathway | 4 | 8.00E-02 |
Table 7.
Day 14 Upregulated microRNAs and Their Potential Target Pathways
| miRNA | Pathway | No. of genes | P value |
|---|---|---|---|
| miR-23b-3p | FoxO signaling pathway | 9 | 4.00E-03 |
| NF-kappa B signaling pathway | 7 | 6.20E-03 | |
| cAMP signaling pathway | 9 | 3.50E-02 | |
| MAPK signaling pathway | 10 | 5.50E-02 | |
| Notch signaling pathway | 4 | 6.30E-02 | |
| Ras signaling pathway | 9 | 6.70E-02 | |
| ErbB signaling pathway | 5 | 8.40E-02 | |
| miR-29b-3p | PI3K-AKT signaling pathway | 31 | 3.80E-16 |
| FoxO signaling pathway | 11 | 2.30E-05 | |
| Rap1 signaling pathway | 13 | 5.00E-05 | |
| Ras signaling pathway | 12 | 4.30E-04 | |
| MAPK signaling pathway | 12 | 1.20E-03 | |
| p53 signaling pathway | 6 | 2.80E-03 | |
| HIF-1 signaling pathway | 7 | 3.00E-03 | |
| TNF signaling pathway | 7 | 4.40E-03 | |
| TGF-beta signaling pathway | 6 | 7.50E-03 | |
| mTOR signaling pathway | 5 | 1.00E-02 | |
| VEGF signaling pathway | 5 | 1.20E-02 | |
| Hippo signaling pathway | 7 | 2.30E-02 | |
| miR-99a-5p | HIF-1 signaling pathway | 5 | 1.10E-02 |
| cGMP-PKG signaling pathway | 5 | 6.10E-02 | |
| Endocrine regulated calcium reabsorption | 3 | 6.10E-02 | |
| miR-101-3p | MAPK signaling pathway | 14 | 1.10E-03 |
| PI3K-AKT signaling pathway | 15 | 5.90E-03 | |
| Hippo signaling pathway | 9 | 8.10E-03 | |
| FoxO signaling pathway | 8 | 1.40E-02 | |
| Ras signaling pathway | 10 | 2.90E-02 | |
| TGF-beta signaling pathway | 5 | 7.60E-02 | |
| cAMP signaling pathway | 8 | 8.40E-02 | |
| ErbB signaling pathway | 5 | 8.40E-02 | |
| miR-126-3p | FoxO signaling pathway | 8 | 1.60E-06 |
| Rap1 signaling pathway | 9 | 2.80E-06 | |
| PI3K-AKT signaling pathway | 10 | 1.30E-05 | |
| Insulin signaling pathway | 7 | 2.80E-05 | |
| ErbB signaling pathway | 6 | 3.70E-05 | |
| HIF-1 signaling pathway | 6 | 6.60E-05 | |
| VEGF signaling pathway | 5 | 1.40E-04 | |
| Ras signaling pathway | 7 | 4.20E-04 | |
| TNF signaling pathway | 5 | 1.20E-03 | |
| Leukocyte transendothelial migration | 5 | 1.80E-03 | |
| mTOR signaling pathway | 4 | 2.10E-03 | |
| NF-kappa B signaling pathway | 4 | 6.70E-03 | |
| cAMP signaling pathway | 5 | 1.10E-02 | |
| cGMP-PKG signaling pathway | 4 | 3.70E-02 | |
| miR-152-3p | PI3K-AKT signaling pathway | 13 | 3.80E-05 |
| AMPK signaling pathway | 6 | 4.30E-03 | |
| FoxO signaling pathway | 6 | 6.30E-03 | |
| Ras signaling pathway | 7 | 1.40E-02 | |
| ErbB signaling pathway | 4 | 4.10E-02 | |
| Hippo signaling pathway | 5 | 4.40E-02 | |
| miR-204-5p | cGMP-PKG signaling pathway | 13 | 9.50E-05 |
| cAMP signaling pathway | 14 | 1.30E-04 | |
| Hippo signaling pathway | 11 | 7.40E-04 | |
| MAPK signaling pathway | 13 | 4.30E-03 | |
| Wnt signaling pathway | 8 | 1.90E-02 | |
| TGF-beta signaling pathway | 6 | 2.50E-02 | |
| HIF-1 signaling pathway | 6 | 4.40E-02 | |
| FoxO signaling pathway | 7 | 4.80E-02 | |
| TNF signaling pathway | 6 | 5.70E-02 | |
| Calcium signaling pathway | 8 | 6.30E-02 | |
| miR-218-5p | PI3K-AKT signaling pathway | 31 | 1.40E-03 |
| Hippo signaling pathway | 16 | 6.60E-03 | |
| Ras signaling pathway | 21 | 6.90E-03 | |
| Wnt signaling pathway | 14 | 1.70E-02 | |
| Rap1 signaling pathway | 17 | 5.00E-02 | |
| ErbB signaling pathway | 9 | 6.10E-02 | |
| AMPK signaling pathway | 11 | 7.40E-02 | |
| miR-335-5p | PI3K-AKT signaling pathway | 69 | 1.70E-04 |
| Ras signaling pathway | 48 | 5.00E-04 | |
| Calcium signaling pathway | 38 | 2.20E-03 | |
| MAPK signaling pathway | 49 | 4.00E-03 | |
| Rap1 signaling pathway | 37 | 4.40E-02 | |
| Hippo signaling pathway | 28 | 4.70E-02 | |
| Wnt signaling pathway | 26 | 4.80E-02 | |
| TGF-beta signaling pathway | 17 | 6.90E-02 | |
| cAMP signaling pathway | 34 | 7.10E-02 | |
| miR-362-5p | PI3K-AKT signaling pathway | 4 | 4.30E-02 |
| miR-425-3p | cAMP signaling pathway | 3 | 8.40E-02 |
| miR-454-3p | TGF-beta signaling pathway | 6 | 2.10E-02 |
| p53 signaling pathway | 5 | 3.70E-02 | |
| FoxO signaling pathway | 7 | 4.00E-02 | |
| miR-500b-5p | PI3K-AKT signaling pathway | 4 | 3.00E-02 |
| let-7b-5p | AMPK signaling pathway | 19 | 1.60E-03 |
| p53 signaling pathway | 13 | 1.80E-03 | |
| FoxO signaling pathway | 20 | 1.90E-03 | |
| Insulin signaling pathway | 18 | 1.30E-02 | |
| HIF-1 signaling pathway | 14 | 1.60E-02 | |
| Hippo signaling pathway | 18 | 3.00E-02 | |
| ErbB signaling pathway | 12 | 3.50E-02 | |
| TGF-beta signaling pathway | 11 | 6.10E-02 | |
| let-7c-3p | Insulin signaling pathway | 6 | 1.70E-03 |
| let-7d-5p | p53 signaling pathway | 6 | 6.40E-03 |
| FoxO signaling pathway | 8 | 9.30E-03 | |
| PI3K-AKT signaling pathway | 12 | 4.10E-02 | |
| Jak-STAT signaling pathway | 7 | 4.30E-02 | |
| Hippo signaling pathway | 7 | 5.00E-02 | |
| HIF-1 signaling pathway | 5 | 9.50E-02 |
Table 8.
Day 14 Downregulated microRNAs and Their Potential Target Pathways
| miRNA | Pathway | No. of genes | P value |
|---|---|---|---|
| miR-17-5p | TGF-beta signaling pathway | 18 | 2.20E-05 |
| p53 signaling pathway | 14 | 3.20E-04 | |
| FoxO signaling pathway | 19 | 2.50E-03 | |
| PI3K-AKT signaling pathway | 37 | 3.10E-03 | |
| Hippo signaling pathway | 20 | 4.10E-03 | |
| TNF signaling pathway | 14 | 2.00E-02 | |
| HIF-1 signaling pathway | 13 | 2.50E-02 | |
| mTOR signaling pathway | 9 | 3.30E-02 | |
| MAPK signaling pathway | 25 | 4.30E-02 | |
| AMPK signaling pathway | 13 | 9.90E-02 | |
| miR-19b-3p | Wnt signaling pathway | 10 | 8.90E-02 |
| miR-20a-5p | TGF-beta signaling pathway | 17 | 1.40E-05 |
| p53 signaling pathway | 13 | 3.00E-04 | |
| PI3K-AKT signaling pathway | 34 | 1.70E-03 | |
| MAPK signaling pathway | 26 | 4.40E-03 | |
| FoxO signaling pathway | 16 | 7.90E-03 | |
| Wnt signaling pathway | 14 | 4.60E-02 | |
| Rap1 signaling pathway | 19 | 4.70E-02 | |
| HIF-1 signaling pathway | 11 | 4.70E-02 | |
| ErbB signaling pathway | 10 | 5.40E-02 | |
| miR-21-5p | MAPK signaling pathway | 25 | 6.80E-06 |
| HIF-1 signaling pathway | 14 | 2.90E-05 | |
| FoxO signaling pathway | 16 | 5.40E-05 | |
| TNF signaling pathway | 12 | 1.00E-03 | |
| TGF-beta signaling pathway | 10 | 2.30E-03 | |
| PI3K-AKT signaling pathway | 23 | 3.90E-03 | |
| Hippo signaling pathway | 13 | 5.90E-03 | |
| p53 signaling pathway | 8 | 8.10E-03 | |
| NF-kappa B signaling pathway | 9 | 1.00E-02 | |
| Ras signaling pathway | 15 | 2.50E-02 | |
| Rap1 signaling pathway | 14 | 3.00E-02 | |
| miR-23a-3p | p53 signaling pathway | 4 | 6.30E-02 |
| miR-27a-3p | FoxO signaling pathway | 15 | 1.80E-06 |
| MAPK signaling pathway | 17 | 2.00E-04 | |
| Ras signaling pathway | 15 | 5.90E-04 | |
| ErbB signaling pathway | 9 | 7.60E-04 | |
| AMPK signaling pathway | 10 | 1.80E-03 | |
| TGF-beta signaling pathway | 8 | 2.90E-03 | |
| PI3K-AKT signaling pathway | 16 | 1.20E-02 | |
| Insulin signaling pathway | 9 | 1.30E-02 | |
| Hippo signaling pathway | 9 | 2.10E-02 | |
| Wnt signaling pathway | 8 | 3.70E-02 | |
| mTOR signaling pathway | 5 | 4.20E-02 | |
| p53 signaling pathway | 5 | 6.50E-02 | |
| HIF-1 signaling pathway | 6 | 7.20E-02 | |
| miR-30a-5p | p53 signaling pathway | 8 | 3.20E-02 |
| FoxO signaling pathway | 12 | 4.10E-02 | |
| Ras signaling pathway | 16 | 8.80E-02 | |
| ErbB signaling pathway | 8 | 1.00E-01 | |
| miR-30b-5p | p53 signaling pathway | 6 | 1.50E-02 |
| Jak-STAT signaling pathway | 7 | 9.50E-02 | |
| miR-132-3p | MAPK signaling pathway | 9 | 3.30E-02 |
| miR-138-5p | p53 signaling pathway | 5 | 8.20E-04 |
| Hippo signaling pathway | 5 | 1.50E-02 | |
| AMPK signaling pathway | 4 | 4.20E-02 | |
| Wnt signaling pathway | 4 | 5.70E-02 | |
| miR-146a-5p | NF-kappa B signaling pathway | 9 | 2.80E-06 |
| TNF signaling pathway | 6 | 4.80E-03 | |
| PI3K-AKT signaling pathway | 9 | 2.60E-02 | |
| MAPK signaling pathway | 7 | 4.90E-02 | |
| HIF-1 signaling pathway | 4 | 8.20E-02 | |
| miR-155-5p | TNF signaling pathway | 20 | 9.40E-06 |
| FoxO signaling pathway | 21 | 8.70E-05 | |
| HIF-1 signaling pathway | 16 | 5.00E-04 | |
| AMPK signaling pathway | 17 | 1.80E-03 | |
| PI3K-AKT signaling pathway | 34 | 3.20E-03 | |
| Insulin signaling pathway | 16 | 1.40E-02 | |
| mTOR signaling pathway | 9 | 1.80E-02 | |
| ErbB signaling pathway | 11 | 2.90E-02 | |
| Hippo signaling pathway | 16 | 3.00E-02 | |
| Wnt signaling pathway | 15 | 3.00E-02 | |
| Rap1 signaling pathway | 19 | 6.40E-02 | |
| Hedgehog signaling pathway | 5 | 6.90E-02 | |
| p53 signaling pathway | 8 | 9.40E-02 | |
| miR-222-5p | PI3K-AKT signaling pathway | 6 | 1.50E-02 |
| miR-223-3p | FoxO signaling pathway | 9 | 3.70E-06 |
| p53 signaling pathway | 5 | 1.20E-03 | |
| PI3K-AKT signaling pathway | 9 | 2.70E-03 | |
| MAPK signaling pathway | 7 | 8.80E-03 | |
| AMPK signaling pathway | 5 | 1.10E-02 | |
| TNF signaling pathway | 4 | 3.90E-02 | |
| Jak-STAT signaling pathway | 4 | 8.30E-02 | |
| miR-455-5p | ErbB signaling pathway | 3 | 5.80E-02 |
| miR-503-5p | p53 signaling pathway | 9 | 7.80E-06 |
| PI3K-AKT signaling pathway | 17 | 7.10E-05 | |
| FoxO signaling pathway | 9 | 1.10E-03 | |
| MAPK signaling pathway | 11 | 5.90E-03 | |
| HIF-1 signaling pathway | 6 | 1.80E-02 | |
| Ras signaling pathway | 9 | 2.40E-02 | |
| Jak-STAT signaling pathway | 7 | 2.50E-02 | |
| AMPK signaling pathway | 6 | 4.00E-02 | |
| Rap1 signaling pathway | 8 | 4.40E-02 | |
| NF-kappa B signaling pathway | 5 | 4.50E-02 | |
| mTOR signaling pathway | 4 | 6.00E-02 | |
| Insulin signaling pathway | 6 | 6.20E-02 | |
| miR-708-5p | Jak-STAT signaling pathway | 5 | 9.50E-03 |
| Hippo signaling pathway | 4 | 5.60E-02 |
Experimental miRNA and anti-miRNA validation
Based on the validated miRNA targets and their KEGG analysis of all the downregulated miRNAs, six downregulated miRNAs with antiangiogenic properties were selected as potential candidates to induce endothelial genesis: miR-145-5p [37–39], miR-155-5p [40], miR-193a-3p [41], miR-125a-5p [42–44], miR-221-5p [45,46], and miR-222-3p [45,46]. Supporting evidence that these miRNAs are antiangiogenic can be found in the cancer literature where they have each been associated with suppression of angiogenesis. The following preliminary experimental studies tested the hypothesis that downregulation of the abovementioned miRNAs in the CD34+ ASCs by transfection with their respective antagomirs could result in the induction of endothelial genesis.
Similarly, six upregulated miRNAs (miR-181a-5p, miR-330-5p, miR-335-3p, miR-15b-5p, miR-99a-5p, and miR-199a-5p) based on the KEGG analysis of all the upregulated miRNAs were chosen to induce endotheliogenesis in ASCs. The following studies tested the hypothesis that upregulation of the abovementioned miRNAs by transfection will promote endotheliogenesis. The initial staining studies indicate that cells treated with miR-335-5p (400 nM), miR-330-5p (800 nM), miR-181a-5p (400, 800, and 1,600 nM), anti-miR-125a-5p (1,600 and 3,200 nM), anti-miR-145-5p (3,200 nM), and anti-miR-155-5p (1,600 nM) mimics showed extensive VWF staining (Supplementary Figs. S3 and S4). Therefore, these miRNAs and anti-miRNA mimics are selected for further conformational studies. Each of these miRNAs and anti-miRNA mimics are transfected into cells in 12-well plates at the respective concentrations as mentioned above and imaged. In addition, mRNA was isolated from all the samples, and qRT-PCR was performed for the expression of endothelial genes (VEGF, CD31, and VWF). Robust fluorescence imaging of VWF antibody staining was observed in the samples transfected with miR-330-5p (800 nM), miR-181a-5p (1,600 nM), anti-miR-125a-5p (1,600 nM), anti-miR-125a-5p (3,200 nM), and anti-miR-145-5p (3,200 nM) mimics (Fig. 9). qRT-PCR analysis determined that cells transfected with miR-335-5p (400 nM), miR-330-5p (800 nM), and miR-181a-5p (400 nM) mimics induced the expression of all three endothelial associated genes (VEGF, CD31, and VWF), while miR-181a-5p mimic (800 nM) upregulated CD31 and VWF genes. Highest gene expression of all the three endothelial genes was induced by miR-181a-5p mimic (400 nM) (Fig. 10). However, transfection with anti-miR mimics did not significantly induce the expression of the endothelial biomarker genes. Interestingly, the anti-miR mimics, anti-miR-125a-5p (at 1,600 and 3,200 nM), and anti-miR-145-5p (3,200 nM) resulted in robust positive staining for VWF (Fig. 9).
FIG. 9.

CD34+ ASCs transfected with miRNAs (335-5p at 400 nM, 330-5p at 800 nM, 181a-5p at 400, 800, and 1,600 nM) and anti-miRs (125a-5p at 1,600 and 3,200 nM, 155-5p at 1,600 nM, 145-5p at 3,200 nM) screen down from the preliminary studies (Supplementary Figs. S1 and S2). The cells were stained with primary antibody for VWF and secondary antibody conjugated with Alexa Fluor 488 and counter stain 4′,6-diamidino-2-phenylindole. Two images from each condition at magnifications 10 × and 20 × shown. Scale bar 100 μm.
FIG. 10.

Gene expression of endothelial genes VWF, VEGF, CD31 in miRNAs and anti-miRNAs transfected CD34+ ASCs determined by qRT-PCR. Transfection with miR-335-5p (at 400 and 800 nM), miR-181a-5p (at 400 and 800 nM) induced the upregulation of endothelial genes. VEGF, vascular endothelial growth factor.
Discussion
Since their discovery in Caenorhabditis elegans in 1993, the biogenesis of miRNAs and their functional role in various cellular and physiological processes have been extensively studied [47,48]. Each of these small noncoding RNAs regulate the transcription and translational processes, thus deciding the fate of cellular differentiation either individually or together in clusters [49,50]. Furthermore, a single miRNA can target multiple gene transcripts or a single gene can be targeted by multiple miRNAs or multiple genes targeted by miRNA clusters [49,50]. Therefore, identifying the miRNAs and their targets and the associated mechanistic pathways provides deeper insights in the cellular differentiation process.
Endothelial differentiation is the primary step in the angiogenesis process. This formation and expansion of new blood vessel network is a double-edged sword that can be either beneficial or insidious. For example, in case of novel tissue engineered constructs or autologous transplantations, it is extremely crucial for the transplanted grafts to develop new vasculature for the proper integration within the host. In contrast, new blood vessel formation facilitates the aggressive growth and expansion of cancerous tissues. Similarly, angiogenesis is also associated with the obesity where the adipose tissue stimulates the new blood vessel formation by secreting various growth factors and proangiogenic cytokines and chemokines [51]. Furthermore, the stromal microenvironment in the fat tissues in obese patients promotes angiogenesis and, consequently, provides a growth promoting environment for tumors and cancers [52].
Studying what miRNAs are expressed and how they regulate the endothelial differentiation and subsequent angiogenic pathways provides deeper insights that can be used to better understand and develop new therapeutical strategies for tissue engineering applications, cancer, and obesity. In this study, we used next generation sequencing, a high throughput method, to identify the miRNAs and targeted pathways that are associated with the endothelial differentiation of CD34+ ASCs at different time points. In addition these identified miRNAs are evaluated for their efficacy to induce endothelial differentiation in vitro.
miRNA-based sequencing approach was used to identify pathways associated with endothelial differentiation by human ASC in a temporal manner. On day 3 of exposure to endotheliogenesis factors, human ASC displayed 22 upregulated and 18 downregulated miRNAs (Figs. 2 and 3). The target mRNAs for these miRNAs are identified using miRWalk and subjected to KEGG analysis to identify the enriched pathways that involve these mRNAs. Based on the obtained results, we chose six upregulated (miR-181a-5p, miR-330-5p, miR-335-3p, miR-15b-5p, miR-99a-5p, and miR-199a-5p) and six downregulated miRNAs (miR-145-5p, miR-155-5p, miR-193a-3p, miR-125a-5p, miR-221-5p, and miR-222-3p) with the targeted mRNAs associated in the several regulatory pathways in endotheliogenesis. The enriched pathways are MAPK signaling, PI3K-AKT signaling, VEGF signaling, ErbB signaling, NF-KB signaling, Notch signaling, HIF-signaling, P53 signaling, Hippo signaling, Ras signaling, Rap1 signaling, mammalian target of rapamycin (mTOR) signaling, TNF signaling, TGF-β signaling, Insulin signaling, cGMP-PKG signaling, and cAMP signaling (Tables 3 and 4).
The MAPK pathways and PI3K pathway play a vital role in the induction and maintenance of endothelial cell differentiation of human-induced pluripotent stem cells through mediation of ETS-related Gene (ERG) and friend leukemia integration 1 transcription factor (FLI1) [53]. A critical proangiogenic factor, VEGF, promotes endothelial progenitor survival, proliferation, and invasion by activating MAPK and PI3K pathways through VEGFR-2 binding [54]. From our selected list of miRNAs for the initial in vitro study, the day 3 upregulated miRNAs 181a-5p, 335-3p, 15b-5p and the day 3 downregulated miRNAs 145-5p, 155-5p, 193a-3p, 125a-5p, 222-3p are found to be targeting MAPK and PI3K-AKT pathways by KEGG analysis (Tables 3 and 4).
The overexpression of miR-181a-5p has been shown by others to enhance tumor angiogenesis through targeting of the SRC kinase signaling inhibitor 1 (SRCIN1) in colorectal cancer [55]. It was also reported that expression of miR-181a induces the progression of ovarian cancer by facilitating the epithelial to mesenchymal transition through TGF-β signaling pathway [56]. In chondrosarcoma, the upregulation of miR-181a was found to be positively correlated with the increased expression of VEGF and matrix metalloprotease 1 (MMP1), thereby increasing angiogenesis [57]. Furthermore, miR-181a repressed RGS16 gene, which was a negative regulator of CXC chemokine receptor 4 (CXCR4) signaling associated with enhanced VEGF expression [57]. However, in MDA-MB-231 cancerous cells, miR-181a-5p attenuated the metastasis and angiogenesis by repressing the expression of MMP-14 [58]. Thus, the literature indicates that the role of miR-181a-5p in promoting or inhibiting angiogenesis is cell specific. Our current study noted increased expression of miR-181a-5p on day 3 during ASC endothelial differentiation suggesting a possible role in positively regulating endothelial genesis. KEGG analysis revealed that the enriched pathways associated with the miR-181a-5p targeted genes are known to play regulatory roles in endothelial and angiogenic differentiation. Consistent with this, transfection of miR-181a-5p at 400 nM resulted in the upregulation of VWF, VEGF, and CD31 (Fig. 10). Furthermore, increasing the concentration to 1,600 nM resulted in more robust VWF antibody staining (Fig. 9).
In the current study, miR-125a-5p was identified as downregulated using miRNA sequencing of ASCs undergoing endothelial genesis, and knockdown of miR-125a-5p expression using anti-miR-125a-5p (1,600 and 3,200 nM) resulted in extensive VWF antibody staining (Fig. 9). The miR-125a-5p has been recognized as a tumor suppressor. In breast cancer [59], ovarian cancer [60], lung cancer [61], and medulloblastoma [62], it was found that the expression of miR-125a-5p was extremely low. This low expression of miR-125a-5p correlated with the overexpression of proangiogenic factor VEGF, thereby promoting both proliferation and angiogenesis [42,43]. Conversely, Dai et al., showed that upregulation of miR-125a caused the downregulation of VEGF-A and reduced progression of gastric cancer [42]. Che et al., found that endothelial cells from older mice had increased expression of miR-125a-5p associated with defective angiogenesis, whereas endothelial cells from young mice had higher expression levels of miR-125a-5p [43]. Furthermore, inhibition of miR-125a-5p in endothelial cells from older mice significantly improved the angiogenic potential [43].
While the functional role of miR-335-5p in enhancing osteogenesis [63–65] and inhibiting the metastasis and invasion of gastric cancer has been documented in the literature [66,67], its direct role in regulating angiogenesis is less well explored. The current study determined that expression of miR-335-5p was increased on day 3 suggesting its positive role in endothelial genesis regulation, and transfection of ASCs with miR-335-5p at 400 nM concentration resulted in the upregulation of VWF and CD31 genes (Fig. 10) and similarly resulted in VWF antibody staining (Fig. 9).
While the role of miR-330-5p in the angiogenesis remains relatively under explored, it has been found to promote metastasis in hepatocellular carcinoma [68]. Interestingly, in human umbilical vein endothelial cells, miR-330-5p's expression was decreased upon exposure to angiopoietin-1, and upregulation of miR-330-5p resulted in the reduction of capillary-like tube formation [69]. The current study found that miR-330-5p was upregulated during endothelial differentiation of ASCs, and when miR-330-5p was transfected, there was both upregulation of VWF gene expression and VWF antibody staining. We found that transfection of miR-33-5p at 800 nM resulted in higher endothelial differentiation in comparison to the miRNA concentration at 400, 1,600, and 3,200 nM (Supplementary Fig. S3). This possibly suggests that miR-330-5p may have the dual activity as the higher dosage (above 1,600 nM) of miR-330-5p might be downregulating while the lower dosage could have a positive effect on endothelial differentiation. However, further studies are required to test the dose versus functional relationship of the miR-330-5p.
In breast, colon, glioma, ovary, prostate, and pancreatic cancers, miRNA-145 expression has been found to be suppressed [70]. Upregulation of miR-145 inhibited the metastasis and angiogenesis of osteosarcoma cells by downregulating VEGF expression [37]. Several studies have shown that miR-145 downregulates VEGF and Ras, thereby impairing angiogenesis [38,71]. miRNA-145 also targeted HIF-2α in neuroblastoma models, thereby inhibiting angiogenesis and metastasis [72]. Moreover, miRNA-145 downregulation using the anti-miR-145 in ASCs induced endothelial differentiation and promoted the angiogenesis by activation of endothelial transcription factor ETS1 [27]. In the current study, miR-145-5p knockdown using anti-miR-145-5p at 3,200 nM concentration resulted in extensive VWF antibody staining, in agreement with the published literature.
In the current study, in vitro analysis of the miRNAs that are upregulated or downregulated on the day 3 of endothelial differentiation is evaluated by qRT-PCR and VWF staining. Additional experimental validation studies such as matrigel assay (a gold standard to test the sprouting behavior endothelial cells) and western blotting analysis to measure the expression of endothelial proteins will be conducted in future studies to further strengthen our findings that these miRNAs or anti-miRNAs induce endotheliogenesis in ASCs. The miRNAs from day 9 to 14 can also be explored for future studies to evaluate their potential for inducing endothelial genesis. One possible strategy is to temporally transfect the miRNAs and/or anti-miRNAs expressed on different days during the course of differentiation at discrete time points to get an efficient differentiation outcome.
Conclusion
We have presented the expression of differentially expressed miRNAs identified by miRNA sequencing during the endotheliogenesis of CD34+ ASCs. The gene targets of these miRNAs were identified using miRWalk program using mirbase database, and the KEGG analysis using DAVID bioinformatics on these miRNA targets revealed the enrichment of MAPK signaling, PI3K-AKT signaling, VEGF signaling, ErbB signaling, NF-KB signaling, Notch signaling, HIF-signaling, P53 signaling, Hippo signaling, Ras signaling, Rap1 signaling, mTOR signaling, TNF signaling, TGF-β signaling, Insulin signaling, cGMP-PKG signaling, and cAMP signaling pathways. Our article is primarily aimed to serve as an open repository source of the miRNA sequencing findings of the differential temporal expression of miRNAs during endotheliogenesis of CD34+ ASCs. In vitro experimental validation of miRNAs identified on day 3 was performed by transfecting ASCs with either miRNA mimics (for upregulation) or anti-miRNAs (to downregulate) and studied by VWF staining and qRT-PCR techniques. Transfection of these day 3 miRNAs with most gene targets in the endothelial regulatory pathways showed that the overexpression of miR-335-5p, miR-330-5p, miR-181a-5p and downregulation of miR-125a-5p and mir-145-5p suggested the likelihood of the differentiation of CD34+ sorted ASCs into endothelial lineage.
Supplementary Material
Acknowledgment
The authors thank Dr. Chouljenko at the GeneLab of LSU School of Veterinary Medicine for his technical assistance in preparing cDNA libraries.
Disclaimer
The content is solely the responsibility of the authors and does not necessarily represent the official views of the National Institutes of Health.
Author Disclosure Statement
During the study period, J.G. was employed at LaCell, LLC and Obatala Sciences, a for-profit biotech companies cofounded and co-owned by Dr. J.G. The remaining coauthors have no conflicts to disclose.
Funding Information
Research reported in this publication was supported by the National Institute Diabetes, Digestive and Kidney Diseases of the National Institutes of Health under award R21 DK 91852 and by the National Institute of Dental and Craniofacial Research of the National Institutes of Health under award R01 DE024790.
Supplementary Material
References
- 1. Nukavarapu S, Freeman J and Laurencin C. (2015). Regenerative Engineering of Musculoskeletal Tissues and Interfaces. Woodhead Publishing, Cambridge, UK [Google Scholar]
- 2. Dzobo K, Thomford NE, Senthebane DA, Shipanga H, Rowe A, Dandara C, Pillay M and Motaung KSCM. (2018). Advances in regenerative medicine and tissue engineering: innovation and transformation of medicine. Stem Cells Int 2018:2495848. [DOI] [PMC free article] [PubMed] [Google Scholar]
- 3. Berthiaume F, Maguire TJ and Yarmush ML. (2011). Tissue engineering and regenerative medicine: history, progress, and challenges. Annu Rev Chem Biomol Eng 2:403–430 [DOI] [PubMed] [Google Scholar]
- 4. Stark RY, Mirzabeigi MN, Vonderhaar RJ and Bucky LP. (2018). Utilizing large volume fat grafting in breast reconstruction after nipple sparing mastectomies. Gland Surg 7:337–346 [DOI] [PMC free article] [PubMed] [Google Scholar]
- 5. Sterodimas A, de Faria J, Nicaretta B and Boriani F. (2011). Autologous fat transplantation versus adipose-derived stem cell–enriched lipografts: a study. Aesthet Surg J 31:682–693 [DOI] [PubMed] [Google Scholar]
- 6. Simonacci F, Bertozzi N, Grieco MP, Grignaffini E and Raposio E. (2016). Autologous fat transplantation for breast reconstruction: a literature review. Ann Med Surg (Lond) 12:94–100 [DOI] [PMC free article] [PubMed] [Google Scholar]
- 7. Bellini E, Grieco MP and Raposio E. (2017). The science behind autologous fat grafting. Ann Med Surg (Lond) 24:65–73 [DOI] [PMC free article] [PubMed] [Google Scholar]
- 8. Adair TH and Montani JP. (2010). Overview of angiogenesis. In: Angiogenesis. Morgan & Claypool Publishers, San Rafael, CA, pp 1–8 [Google Scholar]
- 9. Nishida N, Yano H, Nishida T, Kamura T and Kojiro M. (2006). Angiogenesis in cancer. Vasc Health Risk Manag 2:213–219 [DOI] [PMC free article] [PubMed] [Google Scholar]
- 10. Kolte D, McClung JA and Aronow WS. (2016). Vasculogenesis and angiogenesis. In: Translational Research in Coronary Artery Disease. Elsevier, San Diego, CA, pp 49–65 [Google Scholar]
- 11. Sengenès C, Miranville A, Maumus M, de Barros S, Busse R and Bouloumié A. (2007). Chemotaxis and differentiation of human adipose tissue CD34+/CD31− progenitor cells: role of stromal derived factor-1 released by adipose tissue capillary endothelial cells. Stem Cells 25:2269–2276 [DOI] [PubMed] [Google Scholar]
- 12. Miranville A, Heeschen C, Sengenes C, Curat C, Busse R and Bouloumie A. (2004). Improvement of postnatal neovascularization by human adipose tissue-derived stem cells. Circulation 110:349–355 [DOI] [PubMed] [Google Scholar]
- 13. Forghani A, Koduru SV, Chen C, Leberfinger AN, Ravnic DJ and Hayes DJ. (2019). Differentiation of adipose tissue-derived CD34+/CD31− cells into endothelial cells in vitro. Regen Eng Transl Med 6:101–110 [DOI] [PMC free article] [PubMed] [Google Scholar]
- 14. Gimble JM, Katz AJ and Bunnell BA. (2007). Adipose-derived stem cells for regenerative medicine. Circ Res 100:1249–1260 [DOI] [PMC free article] [PubMed] [Google Scholar]
- 15. Zuk PA, Zhu M, Ashjian P, De Ugarte DA, Huang JI, Mizuno H, Alfonso ZC, Fraser JK, Benhaim P and Hedrick MH. (2002). Human adipose tissue is a source of multipotent stem cells. Mol Biol Cell 13:4279–4295 [DOI] [PMC free article] [PubMed] [Google Scholar]
- 16. Fischer LJ, McIlhenny S, Tulenko T, Golesorkhi N, Zhang P, Larson R, Lombardi J, Shapiro I and DiMuzio PJ. (2009). Endothelial differentiation of adipose-derived stem cells: effects of endothelial cell growth supplement and shear force. J Surg Res 152:157–166 [DOI] [PMC free article] [PubMed] [Google Scholar]
- 17. Colazzo F, Alrashed F, Saratchandra P, Carubelli I, Chester AH, Yacoub MH, Taylor PM and Somers P. (2014). Shear stress and VEGF enhance endothelial differentiation of human adipose-derived stem cells. Growth Factors 32:139–149 [DOI] [PubMed] [Google Scholar]
- 18. Clark K and Janorkar A. (2018). Milieu for endothelial differentiation of human adipose-derived stem cells. Bioengineering 5:82. [DOI] [PMC free article] [PubMed] [Google Scholar]
- 19. Deng M, Gu Y, Liu Z, Qi Y, Ma GE and Kang N. (2015). Endothelial differentiation of human adipose-derived stem cells on polyglycolic acid/polylactic acid mesh. Stem Cells Int 2015:350718. [DOI] [PMC free article] [PubMed] [Google Scholar]
- 20. Winter J, Jung S, Keller S, Gregory RI and Diederichs S. (2009). Many roads to maturity: microRNA biogenesis pathways and their regulation. Nat Cell Biol 11:228–234 [DOI] [PubMed] [Google Scholar]
- 21. Martin EC, Qureshi AT, Dasa V, Freitas MA, Gimble JM and Davis TA. (2016). MicroRNA regulation of stem cell differentiation and diseases of the bone and adipose tissue: perspectives on miRNA biogenesis and cellular transcriptome. Biochimie 124:98–111 [DOI] [PubMed] [Google Scholar]
- 22. Qureshi AT, Monroe WT, Dasa V, Gimble JM and Hayes DJ. (2013). miR-148b-nanoparticle conjugates for light mediated osteogenesis of human adipose stromal/stem cells. Biomaterials 34:7799–7810 [DOI] [PubMed] [Google Scholar]
- 23. Xie Q, Wei W, Ruan J, Ding Y, Zhuang A, Bi X, Sun H, Gu P, Wang Z and Fan X. (2017). Effects of miR-146a on the osteogenesis of adipose-derived mesenchymal stem cells and bone regeneration. Sci Rep 7:42840.5 [DOI] [PMC free article] [PubMed] [Google Scholar]
- 24. Li X, Zhao Y, Li X, Wang Q, Ao Q, Wang X, Tian X, Tong H, Kong D and Chang S. (2019). MicroRNA-150 modulates adipogenic differentiation of adipose-derived stem cells by targeting notch3. Stem Cells Int 2019:2743047. [DOI] [PMC free article] [PubMed] [Google Scholar]
- 25. Zhang Y, Huang X and Yuan Y. (2017). MicroRNA-410 promotes chondrogenic differentiation of human bone marrow mesenchymal stem cells through down-regulating Wnt3a. Am J Transl Res 9:136–145 [PMC free article] [PubMed] [Google Scholar]
- 26. Chen S, Xu Z, Shao J, Fu P and Wu H. (2019). MicroRNA-218 promotes early chondrogenesis of mesenchymal stem cells and inhibits later chondrocyte maturation. BMC Biotechnol 19:1–10 [DOI] [PMC free article] [PubMed] [Google Scholar]
- 27. Arderiu G, Peña E, Aledo R, Juan-Babot O, Crespo J, Vilahur G, Oñate B, Moscatiello F and Badimon L. (2019). MicroRNA-145 regulates the differentiation of adipose stem cells toward microvascular endothelial cells and promotes angiogenesis. Circ Res 125:74–89 [DOI] [PubMed] [Google Scholar]
- 28. Dobin A, Davis CA, Schlesinger F, Drenkow J, Zaleski C, Jha S, Batut P, Chaisson M and Gingeras TR. (2013). STAR: ultrafast universal RNA-seq aligner. Bioinformatics 29:15–21 [DOI] [PMC free article] [PubMed] [Google Scholar]
- 29. Robinson JT, Thorvaldsdóttir H, Winckler W, Guttman M, Lander ES, Getz G and Mesirov JP. (2011). Integrative genomics viewer. Nat Biotechnol 29:24–26 [DOI] [PMC free article] [PubMed] [Google Scholar]
- 30. Robinson MD, McCarthy DJ and Smyth GK. (2010). edgeR: a Bioconductor package for differential expression analysis of digital gene expression data. Bioinformatics 26:139–140 [DOI] [PMC free article] [PubMed] [Google Scholar]
- 31. Edgar R, Domrachev M and Lash AE. (2002). Gene expression omnibus: NCBI gene expression and hybridization array data repository. Nucleic Acids Res 30:207–210 [DOI] [PMC free article] [PubMed] [Google Scholar]
- 32. Dweep H, Sticht C, Pandey P and Gretz N. (2011). miRWalk-database: prediction of possible miRNA binding sites by “walking” the genes of three genomes. J Biomed Inform 44:839–847 [DOI] [PubMed] [Google Scholar]
- 33. Dweep H and Gretz N. (2015). miRWalk2. 0: a comprehensive atlas of microRNA-target interactions. Nat Methods 12:697. [DOI] [PubMed] [Google Scholar]
- 34. Sherman BT and Lempicki RA. (2009). Systematic and integrative analysis of large gene lists using DAVID bioinformatics resources. Nat Protoc 4:44. [DOI] [PubMed] [Google Scholar]
- 35. Huang DW, Sherman BT and Lempicki RA. (2009). Bioinformatics enrichment tools: paths toward the comprehensive functional analysis of large gene lists. Nucleic Acids Res 37:1–13 [DOI] [PMC free article] [PubMed] [Google Scholar]
- 36. Livak KJ and Schmittgen TD. (2001). Analysis of relative gene expression data using real-time quantitative PCR and the 2− ΔΔCT method. Methods 25:402–408 [DOI] [PubMed] [Google Scholar]
- 37. Fan L, Wu Q, Xing X, Wei Y and Shao Z. (2012). MicroRNA-145 targets vascular endothelial growth factor and inhibits invasion and metastasis of osteosarcoma cells. Acta Biochim Biophys Sin 44:407–414 [DOI] [PubMed] [Google Scholar]
- 38. Zou C, Xu Q, Mao F, Li D, Bian C, Liu L-Z, Jiang Y, Chen X, Qi Y and Zhang X. (2012). MiR-145 inhibits tumor angiogenesis and growth by N-RAS and VEGF. Cell Cycle 11:2137–2145 [DOI] [PMC free article] [PubMed] [Google Scholar]
- 39. Xu Q, Liu L-Z, Qian X, Chen Q, Jiang Y, Li D, Lai L and Jiang B-H. (2011). MiR-145 directly targets p70S6K1 in cancer cells to inhibit tumor growth and angiogenesis. Nucleic Acids Res 40:761–774 [DOI] [PMC free article] [PubMed] [Google Scholar]
- 40. Yang D, Wang J, Xiao M, Zhou T and Shi X. (2016). Role of Mir-155 in controlling HIF-1α level and promoting endothelial cell maturation. Sci Rep 6:35316. [DOI] [PMC free article] [PubMed] [Google Scholar]
- 41. Khoo CP, Roubelakis MG, Schrader JB, Tsaknakis G, Konietzny R, Kessler B, Harris AL and Watt SM. (2017). miR-193a-3p interaction with HMGB1 downregulates human endothelial cell proliferation and migration. Sci Rep 7:44137. [DOI] [PMC free article] [PubMed] [Google Scholar]
- 42. Dai J, Wang J, Yang L, Xiao Y and Ruan Q. (2015). miR-125a regulates angiogenesis of gastric cancer by targeting vascular endothelial growth factor A. Int J Oncol 47:1801–1810 [DOI] [PubMed] [Google Scholar]
- 43. Che P, Liu J, Shan Z, Wu R, Yao C, Cui J, Zhu X, Wang J, Burnett MS and Wang S. (2014). miR-125a-5p impairs endothelial cell angiogenesis in aging mice via RTEF-1 downregulation. Aging Cell 13:926–934 [DOI] [PMC free article] [PubMed] [Google Scholar]
- 44. Yang X, Qiu J, Kang H, Wang Y and Qian J. (2018). miR-125a-5p suppresses colorectal cancer progression by targeting VEGFA. Cancer Manag Res 10:5839–5853 [DOI] [PMC free article] [PubMed] [Google Scholar]
- 45. Wu F, Yang Z and Li G. (2009). Role of specific microRNAs for endothelial function and angiogenesis. Biochem Biophys Res Commun 386:549–553 [DOI] [PMC free article] [PubMed] [Google Scholar]
- 46. Li Y, Song Y-H, Li F, Yang T, Lu YW and Geng Y-J. (2009). microRNA-221 regulates high glucose-induced endothelial dysfunction. Biochem Biophys Res Commun 381:81–83 [DOI] [PMC free article] [PubMed] [Google Scholar]
- 47. Lee RC, Feinbaum RL and Ambros V. (1993). The C. elegans heterochronic gene lin-4 encodes small RNAs with antisense complementarity to lin-14. Cell 75:843–854 [DOI] [PubMed] [Google Scholar]
- 48. Wightman B, Ha I and Ruvkun G. (1993). Posttranscriptional regulation of the heterochronic gene lin-14 by lin-4 mediates temporal pattern formation in C. elegans. Cell 75:855–862 [DOI] [PubMed] [Google Scholar]
- 49. Shivdasani RA. (2006). MicroRNAs: regulators of gene expression and cell differentiation. Blood 108:3646–3653 [DOI] [PMC free article] [PubMed] [Google Scholar]
- 50. Hashimoto Y, Akiyama Y and Yuasa Y. (2013). Multiple-to-multiple relationships between microRNAs and target genes in gastric cancer. PLoS One 8:e6258923667495 [Google Scholar]
- 51. Lijnen HR. (2008). Angiogenesis and obesity. Cardiovasc Res 78:286–293 [DOI] [PubMed] [Google Scholar]
- 52. Williams SC. (2013). Link between obesity and cancer. Proc Natl Acad Sci U S A 110:8753–8754 [DOI] [PMC free article] [PubMed] [Google Scholar]
- 53. Harding A, Cortez-Toledo E, Magner NL, Beegle JR, Coleal-Bergum DP, Hao D, Wang A, Nolta JA and Zhou P. (2017). Highly efficient differentiation of endothelial cells from pluripotent stem cells requires the MAPK and the PI3K pathways. Stem Cells 35:909–919 [DOI] [PubMed] [Google Scholar]
- 54. Oswald J, Boxberger S, Jørgensen B, Feldmann S, Ehninger G, Bornhäuser M and Werner C. (2004). Mesenchymal stem cells can be differentiated into endothelial cells in vitro. Stem Cells 22:377–384 [DOI] [PubMed] [Google Scholar]
- 55. Sun W, Wang X, Li J, You C, Lu P, Feng H, Kong Y, Zhang H, Liu Y and Jiao R. (2018). MicroRNA-181a promotes angiogenesis in colorectal cancer by targeting SRCIN1 to promote the SRC/VEGF signaling pathway. Cell Death Dis 9:438. [DOI] [PMC free article] [PubMed] [Google Scholar]
- 56. Parikh A, Lee C, Joseph P, Marchini S, Baccarini A, Kolev V, Romualdi C, Fruscio R, Shah H and Wang F. (2014). microRNA-181a has a critical role in ovarian cancer progression through the regulation of the epithelial–mesenchymal transition. Nat Commun 5:2977. [DOI] [PMC free article] [PubMed] [Google Scholar]
- 57. Sun X, Charbonneau C, Wei L, Chen Q and Terek RM. (2015). miR-181a targets RGS16 to promote chondrosarcoma growth, angiogenesis, and metastasis. Mol Cancer Res 13:1347–1357 [DOI] [PMC free article] [PubMed] [Google Scholar]
- 58. Li Y, Kuscu C, Banach A, Zhang Q, Pulkoski-Gross A, Kim D, Liu J, Roth E, Li E and Shroyer KR. (2015). miR-181a-5p inhibits cancer cell migration and angiogenesis via downregulation of matrix metalloproteinase-14. Cancer Res 75:2674–2685 [DOI] [PMC free article] [PubMed] [Google Scholar]
- 59. Yan L, Yu MC, Gao GL, Liang HW, Zhou XY, Zhu ZT, Zhang CY, Wang YB and Chen X. (2018). MiR-125a-5p functions as a tumour suppressor in breast cancer by downregulating BAP1. J Cell Biochem 119:8773–8783 [DOI] [PubMed] [Google Scholar]
- 60. Tong Z, Liu N, Lin L, Guo X, Yang D and Zhang Q. (2015). miR-125a-5p inhibits cell proliferation and induces apoptosis in colon cancer via targeting BCL2, BCL2L12 and MCL1. Biomed Pharmacother 75:129–136 [DOI] [PubMed] [Google Scholar]
- 61. Zhong L, Sun S, Shi J, Cao F, Han X and Chen Z. (2017). MicroRNA-125a-5p plays a role as a tumor suppressor in lung carcinoma cells by directly targeting STAT3. Tumour Biol 39:1010428317697579. [DOI] [PubMed] [Google Scholar]
- 62. Coppola N, de Stefano G, Panella M, Onorato L, Iodice V, Minichini C, Mosca N, Desiato L, Farella N and Starace M. (2017). Lowered expression of microRNA-125a-5p in human hepatocellular carcinoma and up-regulation of its oncogenic targets sirtuin-7, matrix metalloproteinase-11, and c-Raf. Oncotarget 8:25289. [DOI] [PMC free article] [PubMed] [Google Scholar]
- 63. Zhang J, Tu Q, Bonewald LF, He X, Stein G, Lian J and Chen J. (2011). Effects of miR-335-5p in modulating osteogenic differentiation by specifically downregulating Wnt antagonist DKK1. J Bone Miner Res 26:1953–1963 [DOI] [PMC free article] [PubMed] [Google Scholar]
- 64. Tornero-Esteban P, Rodríguez-Rodríguez L, Abásolo L, Tomé M, López-Romero P, Herranz E, González MA, Marco F, Moro E and Fernández-Gutiérrez B. (2015). Signature of microRNA expression during osteogenic differentiation of bone marrow MSCs reveals a putative role of miR-335-5p in osteoarthritis. BMC Musculoskelet Disord 16:182. [DOI] [PMC free article] [PubMed] [Google Scholar]
- 65. Zhang L, Tang Y, Zhu X, Tu T, Sui L, Han Q, Yu L, Meng S, Zheng L and Valverde P. (2017). Overexpression of MiR-335-5p promotes bone formation and regeneration in Mice. J Bone Miner Res 32:2466–2475 [DOI] [PMC free article] [PubMed] [Google Scholar]
- 66. Sandoval-Bórquez A, Polakovicova I, Carrasco-Véliz N, Lobos-González L, Riquelme I, Carrasco-Avino G, Bizama C, Norero E, Owen GI and Roa JC. (2017). MicroRNA-335-5p is a potential suppressor of metastasis and invasion in gastric cancer. Clin Epigenetics 9:114. [DOI] [PMC free article] [PubMed] [Google Scholar]
- 67. Xu Y, Zhao F, Wang Z, Song Y, Luo Y, Zhang X, Jiang L, Sun Z, Miao Z and Xu H. (2012). MicroRNA-335 acts as a metastasis suppressor in gastric cancer by targeting Bcl-w and specificity protein 1. Oncogene 31:1398. [DOI] [PMC free article] [PubMed] [Google Scholar]
- 68. Tréhoux S, Lahdaoui F, Delpu Y, Renaud F, Leteurtre E, Torrisani J, Jonckheere N and Van Seuningen I. (2015). Micro-RNAs miR-29a and miR-330-5p function as tumor suppressors by targeting the MUC1 mucin in pancreatic cancer cells. Biochim Biophys Acta 1853:2392–2403 [DOI] [PubMed] [Google Scholar]
- 69. Sanchez V, Golyardi F, Mayaki D, Echavarria R, Harel S, Xia J and Hussain SN. (2019). Negative regulation of angiogenesis by novel micro RNAs. Pharmacol Res 139:173–181 [DOI] [PubMed] [Google Scholar]
- 70. Cui SY, Wang R and Chen LB. (2014). MicroRNA-145: a potent tumour suppressor that regulates multiple cellular pathways. J Cell Mol Med 18:1913–1926 [DOI] [PMC free article] [PubMed] [Google Scholar]
- 71. Yin Y, Yan Z-P, Lu N-N, Xu Q, He J, Qian X, Yu J, Guan X, Jiang B-H and Liu L-Z. (2013). Downregulation of miR-145 associated with cancer progression and VEGF transcriptional activation by targeting N-RAS and IRS1. Biochim Biophys Acta 1829:239–247 [DOI] [PubMed] [Google Scholar]
- 72. Zhang H, Pu J, Qi T, Qi M, Yang C, Li S, Huang K, Zheng L and Tong Q. (2014). MicroRNA-145 inhibits the growth, invasion, metastasis and angiogenesis of neuroblastoma cells through targeting hypoxia-inducible factor 2 alpha. Oncogene 33:387. [DOI] [PubMed] [Google Scholar]
Associated Data
This section collects any data citations, data availability statements, or supplementary materials included in this article.