

Abstract
The COVID‐19 pandemic has affected daily lives of people around the world. People have already started to live wearing masks, keeping a safe distance from others, and maintaining a high level of hygiene. This paper deals with an in‐depth analysis of riskness associated with COVID‐19 infections in Kolkata Municipal Corporation (KMC) at the subcity (ward) level. Attempts have been made to identify the areas with high or low risk of infections using GIS‐based geostatistical approach. Cosine Similarity Index has been used to rank different wards of KMC according to the degree of riskness. Four indices were computed to address intervention objectives and to determine “Optimized Prevention Rank” of wards for future policy decisions. The highest risk areas were located in the eastern and western part of the city, to a great extent overlapped with wards containing larger share of population living in slums and/or below poverty level. On the other hand, highly infected areas lie in central Kolkata and in several wards at the eastern and northeastern periphery of the KMC. The “Optimized Prevention Rank” have indicated that the lack of social awareness along with lack of social distancing have contributed to the increasing number of containments of COVID‐19 cases. The rankings of the wards would no doubt provide the policy makers a basis to control further spread of the disease. Since effective antiviral drugs are already in the market, the best application of our research would be in the ensuing vaccination drive against further COVID‐19 infections.
Keywords: COVID‐19, Kolkata, risk analysis, social awareness, social distancing
Key Points
Subcity level risk analysis has identified the areas of higher and lower risk for COVID‐19 transmission in Kolkata Metropolitan City
Central Kolkata has been identified as the hotspots of COVID‐19 containments
Lack of social distancing and social awareness are found to be the primary driver for COVID‐19 transmission
1. Introduction
The entire world is currently grappling with deadly infections from a novel coronavirus disease, COVID‐19. The COVID‐19 infection is caused by the outbreak of severe acute respiratory syndrome coronavirus 2 (SARS‐CoV‐2) (Lai et al., 2020). The disease has flu‐like symptoms and affects each individual differently (Wu, 2020). The World Health Organization (WHO) has declared this catastrophe as a pandemic in March, 2020. Because, a widespread case of COVID‐19 infection is observed in many countries across the globe during the initial months of 2020. As of December 31, 2020, more than 83 million people globally have been infected with the COVID‐19 virus, together with a total global deaths of 1.8 million people (Johns Hopkins University & Medicine, 2020). Due to this pandemic, the global economy has taken a serious blow. Many people have lost their livelihood, and faced serious challenges in getting healthcare facilities and food for survival. The disease has brought a serious hardship to the people in every spheres of life together with interruption in social and human interactions.
COVID‐19 infections have shown no barriers in terms of geography, race, wealth, religion, and ethnicity (Johns Hopkins University & Medicine, 2020). Among the hard hit countries, the USA, India, Brazil, and Russia together share the burden of over 50% of all positive cases. Increasing trend of COVID‐19 infections especially in the developing countries has put the health infrastructure nearer to its breaking point (Nguyen et al., 2020). The risk of COVID‐19 infections has been rising all over the world. People are worried about the pace of the disease spreading to the society. Several potential risk factors have been identified, such as age, race/ethnicity, preexisting medical conditions, poverty, crowding, hygiene, and certain occupations, that are associated with the spread of COVID‐19 infections (CDC, 2020). Social factors such as housing, physical environment, food, and poverty have shown a detrimental effect on COVID‐19 infections and mortality (Abrams & Szefler, 2020; Sasikumar et al., 2020). In addition to that, poor living conditions, lack of clean drinking water, and proper sanitation facilities could increase the risk to the problem (Das et al., 2020; UN SDG, 2020). Lack of access to quality healthcare would add further risk to the contraction and transmission of the virus. Homeless people living in shelters or on streets are prone to much higher risk of transmitting the virus due to their inability to maintain social distancing and also due to lack of basic hygiene supplies (Baggett et al., 2020; Tsai & Wilson, 2020). It might take several months before the general public would get a chance for vaccination (Kormann, 2020). Till that happens, a focused planning is absolutely essential to protect people from contracting this infectious virus.
India is one of the poorest countries in the world with a total population of 1.35 billion. About 22% of the total population are below poverty level (BPL), while the literacy rate is about 74% (Census, 2011). A large section of the workforce in the country is in the unorganized sectors (typically employed on a daily wage basis). Various preventive measures including social and economic lockdown initiated at the early phase of COVID‐19 infection had no doubt helped India to slow down the spread of the virus (Mahajan & Kaushal, 2020). However, such measures have badly affected the economy in almost every sector, especially the unorganized sectors. Migrant workers have returned to their native place in a miserable condition (Sur & Mitra, 2020; Thachil, 2020). The U.S. and other developed countries also adopted stringent measures to control COVID‐19 infection. The U.S. Government has taken care of the vulnerable population by providing foods, shelters, and other stimulus packages during the critical time of economic lockdown (U.S. Government response to coronavirus, COVID‐19, 2020). Despite several policies undertaken by the Government of India and other State Governments to combat the disease, India shows an exponential rise in COVID‐19 cases. However, the reported COVID‐19 cases varied regionally and are mostly clustered around large cities coinciding with higher population densities, such as Delhi, Mumbai, Kolkata, and Chennai (Das et al., 2020; Sasikumar et al., 2020).
The city of Kolkata, which is under Kolkata Municipal Corporation (KMC), with 141 wards (subcity), has a total of 4.5 million inhabitants (Census, 2011). Roughly 30% of inhabitants are living in slums where living conditions are poor (S. Ghosh, 2013). The total number of COVID‐19 infections is over 120,000 along with a total death of 9,700 (COVID‐19 India, 2020). The heightened COVID‐19 cases are reported from few pockets and/or settlements (The New Indian Express, 2020). The West Bengal State Government has followed a strategy to identify the areas of heightened COVID‐19 cases for the purpose of containing those areas to break the chain of virus transmission (West Bengal State Government, 2020). These contained areas are of three types: broad‐based zones, which are typically a locality where the number of infections are many, isolation zones/units where the number of infections are one to many, and standalone houses/premises where the number of infections are limited to family members (typically one to a few). The detailed list of contained areas were made public to alert people regarding the risks of virus transmission (West Bengal State Government, 2020). Our interest is to have a closer scrutiny of the COVID‐19 infections at the subcity level based on the containment zone listings till August 31, 2020 to identify infected areas and analyze the risk of virus transmission.
Several articles have published highlighting the role of socioeconomic conditions and physical environments on the COVID‐19 transmissions by comparing large cities and countries (e.g., Acharya & Porwal, 2020; Sasikumar et al., 2020; You & Pan, 2020). However, a few studies have highlighted the risk at the subcity level that considered the heterogeneity in the distribution of various risk factors including important heath indicators (e.g., Hu et al., 2020). In this article, we analyzed subcity (ward) level COVID‐19 infections in Kolkata city and considered several socioeconomic and health indicators to examine the cause of virus transmission and its containments in different locations. Hence, this paper had attempted to: i) identify locations with high or low risk of COVID‐19 infection, and ii) examine the nature and causes of infections within the KMC area. The paper also analyzed various intervention criteria under optimized conditions for future policy decisions in order to control further spread of SARS‐CoV‐2 and/or to prevent new virus infections. It is no doubt the fact that the disease is highly infectious and transmits rapidly to the communities. Therefore, attention from the part of the state to be given in order to control the spread of virus transmission through intervention measures such as to plan for an effective vaccination drive. So the risk mapping of different zones of COVID‐19 transmission and the identification of nature and causes of such risk would no doubt benefit the policy makers to undertake various prevention and/or intervention programs at the subcity level.
2. Data and Methodology
2.1. Data Used
The data were collected from the Primary Census Abstract, 2011 of the Government of India (Census, 2011). The data were extrapolated to reflect the current situation on the basis of decadal growth rate from census record. We have computed ward wise population living in slums and below poverty level from Basu (2015) and Das Gupta, (2009). The data on homeless people sleeping on the streets were collected from Sabuj Sangha (2014). Average persons per household in each ward is computed by dividing total population with total households. The description of socioeconomic variables used in our analysis are detailed in Table 1.
Table 1.
Descriptions of Demographic and Other Variables Used in the Analysis and Discussion
| Risk criteria | Independent variables | Descriptions (ward wise) |
|---|---|---|
| Lack of social distancing | Population density | People per km2 |
| Large family (9+ people) residential households | Percentage of household to total households | |
| Nonexclusive bedroom | Percentage of household to total households | |
| Drinking water sources—far away from home | Percentage of household to total households | |
| Lack of social awareness | Uneducated population | Percentage of uneducated population |
| Slum population | Percentage of population living in slums | |
| Susceptibility | Households below poverty level | Percentage of household to total households |
| Marginal workers | Percentage of marginal workers | |
| Homeless sleeping on streets a | Percentage of homeless people | |
| Poor health and hygiene condition | Untreated water sources | Percentage of household to total households |
| Community latrines | Percentage of household to total households | |
| Open/No wastewater drains | Percentage of household to total households | |
| Other variables (used in the discussion) | Arsenic in untreated groundwater b | Average concentration |
| Cancer risk index b | Calculated from average As concentrations and consumption rate | |
| Tuberculosis (TB) burden c | High or low |
Data source: Census 2011 of India (Census, 2011). Decadal growth rate was used to extrapolate the data to reflect the current situation.
Homeless people sleeping on streets are from Sabuj Sangha (2014).
Arsenic in untreated groundwater used for drinking and cancer risk index from Chakraborti et al. (2017)
Tuberculosis (TB) burden is from Dey et al. (2019).
Lack of clean drinking water and proper sanitation are the major causes of disease intensity in developing countries like India (Nath, 2003). The use of water from untreated sources is likely to cause weak immune systems due to the presence of pathogens, and toxic trace elements such as As, Fe, and Mn (Chakraborti et al., 2017). In India, the poorer section of the community is highly susceptible to Tuberculosis (TB) and poses greater risk of COVID‐19 infections (Dey et al., 2019; MOHFW, 2020). Hence, arsenic (As) concentration in untreated groundwater used for drinking, cancer risk in southern KMC wards, and TB burden were used in the analysis (data from Chakraborti et al., 2017 and Dey et al., 2019).
To understand the status of COVID‐19 infections in different KMC wards, we have collected the record of publicly accessible containment zones and/or isolation units till the end of August, 2020 (Deccan Herald, 2020; Javed, 2020; Mehta, 2020; Shaurya, 2020; The Bengal Story, 2020; West Bengal State Government, 2020). These containment zones and/or isolation units were established when one or more positive COVID‐19 cases were reported in these zones/units. These zones/units were contained for 14 days of no new cases to control virus transmission.
2.2. Identification of COVID‐19 Risk Locations
We used Cosine Similarity Index (CSI) to identify locations of the highest risk of contracting COVID‐19 across different wards of KMC. In order to compute this index, the relevant input variables were standardized through a z‐transformation. This means that all the input values (X) were subtracted from the mean (X̅) for all variables and then divided by the standard deviation (σ) to keep all the variables on the same scale. We then used Cosine similarity mathematics to compare vectors of standardized data for each KMC wards (a candidate feature) and the vectors of standardized data for the worst‐case scenario (a target feature).
The Cosine similarity of two vectors, A and B, was computed using the following formula:
The analysis was performed using the “Similarity Search” tool in ArcGIS Pro 2.5.1 (ESRI). The tool finds features similar to a worst‐case scenario based on input variables. A hypothetical “target feature” was created by adding all the worst values of input variables. These variables were: population density, percentage of households with nonexclusive bedrooms, percentage of households with more than nine family members, percentage of households depending on community water source, percentage of uneducated population, percentage of slum population, percentage of marginal workers, percentage of BPL population, percentage of houseless population sleeping on the street, percentage of households drinking water from untreated source, percentage of households using community latrine, and percentage of households with no wastewater drains.
The CSI ranges between 1.0 (perfect similarity) and −1.0 (perfect dissimilarity). The wards were then ranked on the basis of values of the CSI. The wards with the highest ranking indicate the highest risk, while the ward with the lowest ranking indicate the lowest risk for contracting COVID‐19.
2.3. Measuring the Risk of COVID‐19 Infection
In order to assess the degree of riskness of COVID‐19 infection, we have formulated four risk indices as social distancing index, social awareness index, susceptibility index, and health and hygiene index. These indices were based on several socioeconomic factors which affect mostly to the spread of COVID‐19 infections (CDC, 2020). Since all these indices associated with different indicators show nonattainment situations, larger index values indicate higher risk, for example, a ward with the largest social distancing index would rank the highest, suggesting that the social distancing is lacking.
Social distancing or physical isolation is one of the most important risk factors that control the transmission of the virus (Kaur et al., 2020). Following variables were used in the calculation of social distancing index:
-
(a)
Population density, that is, the number of people per km2.
-
(b)
Percentage of households with more than nine persons.
-
(c)
Availability of exclusive bed room for household members (in percentage).
-
(d)
Percentage of households having access to community drinking water sources.
The choice of these variables were based on the notion that the areas with high population density will pose a greater risk of getting infections from an asymptomatic and/or infected individuals. Likewise, we have considered that a household with more than nine persons would make it extremely difficult to maintain physical isolation in case one of the family members gets infected (or become asymptomatic). We choose nine persons by considering an extreme scenario where the average household size within the KMC area is 4.5 (Census, 2011). Similarly, physical isolation would be difficult to maintain in the absence of an exclusive bedroom for a household member. This is also true for a household member when he/she has to collect drinking water from community wells or tap water sources. The chance of social distancing or physical isolation is compromised to an extent in our society during drinking water collection (Sur & Mitra, 2020).
For social awareness index, we have used two important demographic variables, such as the percentage of population living in slums and percentage of uneducated population. Social awareness is an important indicator fighting COVID‐19 infections. Adequate knowledge of virus transmission would reduce the risk of infections to any individuals because the COVID‐19 transmission can occur by both direct and indirect contacts with an infected individual (Jayaweera et al., 2020). Additionally, individuals living in slums are naturally lagging behind in terms of COVID‐19 pandemic (Sur & Mitra, 2020). Thus, the transmission of virus would still be higher even if the area has been contained due to lack of social awareness. Therefore, educational attainment and proper knowledge are needed to keep the infection under control.
For susceptibility index, we have used the following indicators:
-
(a)
Percentage of BPL households.
-
(b)
Percentage of homeless people sleeping on the streets.
-
(c)
Percentage of marginal workers.
Susceptibility index was computed to address the needs of the most vulnerable population in the community. Because during the pandemic and economic lockdown, most of these vulnerable groups of people as determined by the associated variables would be out of work. It would be essential to address the needs of these people otherwise deprivation for foods and/or poverty may create conditions for the greater transmission to infectious diseases (Quinn & Kumar, 2014).
Lastly, we have calculated a health and hygiene index to address vulnerable areas where people have the greater likelihood of a weak immune system due to lack of access to clean drinking water, sanitation, and hygiene and thereby increasing the risk of COVID‐19 infections (Das et al., 2020). Such areas are typically prone to greater incidences of TB and other infectious diseases (Dey et al., 2019). Therefore, we have considered the following variables:
-
(a)
Percentage of households having drinking water from untreated sources (typically contain pathogens, toxic trace elements such as As, Fe, and Mn, and chances of waterborne viruses, Chakraborti et al., 2017).
-
(b)
Percentage of households without proper sanitation facilities within the premises (community latrine usually have poor hygiene conditions).
-
(c)
Percentage of households having no proper drainage system for wastewater.
Data of each indicator variable was normalized to create an index, that is, IX. Normalization was done by using the formula outlined in United Nations Development Programme (UNDP) for Human Development Index (UNDP, 2010):
Then, four risk indices (X CI) were computed through weighted average of all individual index values (IX), that is,
where ranks were used as weights. IX ri denotes the rank (across location) of an individual index for ith indicator/variable.
2.4. Identification of Priority Wards for Future Policy Decisions
Spearman's rank correlation coefficient was applied to derive “optimized prevention rank” of the wards based on social distancing, social awareness, susceptibility, and health and hygiene index. We have used a different combination of weight factors to each of the risk criteria to compute “optimized prevention ranks” of wards for future policy decisions.
The Spearman's correlation (ρ) was used as follows:
where, d i = difference in paired ranks and n = number of cases.
3. Results and Discussion
3.1. COVID‐19 Infections in KMC Area
We have considered a total of 3,288 COVID‐19 case records from March 17 to June 30, 2020 to identify hard hit areas of KMC. The total number of infected people in different wards of KMC were estimated by assigning one positive case for each case record. In doing so, we could assign wards to about 60% of the government reported positive cases reported to June 30, 2020. This indicates that some of the case records are either missing in our database or there could be several infected persons in one record. In total, 43 out of 141 wards within the KMC area have greater than or equal to 25 COVID‐19 cases (Figure 1a). These wards are in the central and eastern part of the city. While, the intensity of COVID‐19 cases (i.e., the number of cases per 1,000 people) is significantly higher in the wards of central Kolkata together with a few wards in northeast Kolkata (Figure 1b).
Figure 1.
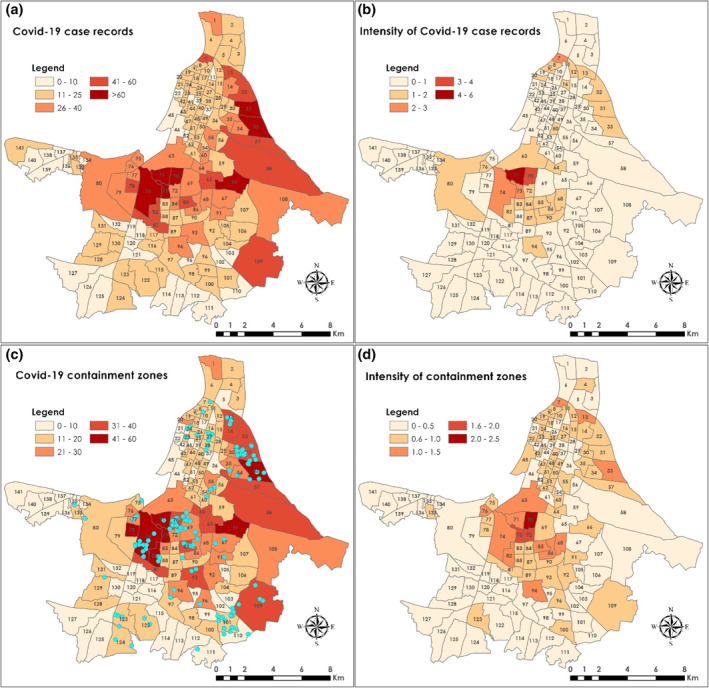
The map shows: (a) Ward wise distribution of total COVID‐19 case records until June 30, within the Kolkata Municipal Corporation (KMC), (b) intensity of COVID‐19 case records (per 1,000 population) in different wards, (c) ward wise distribution of total COVID‐19 containment zones on the basis of over 2,413 containment zone listings until June 30, and (d) intensity of containment zones (per 1,000 population) illustrate the per capita distribution that helps identifying the worst hit locations. Broad‐based containment zones (between July 1 and August 31, 2020, total = 135) are shown as a point symbol in cyan color and are not included in (b and d), due to changes in the definition of these containment zones.
The summary of containment zones have revealed a total 2,413 locations in the KMC area contained between April 27 and June 30, 2020. Among them, nine wards have contained more than 40 locations over 3 months (Figure 1c). The data further revealed that the containment zones have increased over time, from 227 locations in April 27 to 724 locations in June 8. On April 27, more than four containment zones or isolation units were reported in 12 wards located in central and north Kolkata, while the number of wards have increased to 21 on May 11 and spread toward east and west of the city. On June 8, 61 wards have been contained in more than four locations. The data suggests that the most contained areas are associated with the most case records (Figure S1).
The hotspots of highly intensive containment zones (i.e., greater than one containment zones per 1,000 population) were localized in central Kolkata than in other parts of the KMC area (Figure 1d). While, the July and August “broad‐based” containment zones were shown to scatter in three areas of central, northeast, and southeast Kolkata, which largely overlapped the areas contained extensively till June 30, 2020. The majority of July and August containment zones were apartment complexes where individuals live in high‐rise buildings. The report suggested that almost 50% of COVID‐19 cases during the first 25 days of July were recorded in these apartment complexes (D. Ghosh, 2020). This indicates a greater community transmission of COVID‐19 infections in apartment complexes perhaps due to a greater level of social interactions and lack of physical separation. Which is contrary to the general belief that slums are potential coronavirus hotspots (Pasricha, 2020). Effectively three most important safety protocols were suggested, that is, wearing masks, keeping a safe distance, and maintaining hand hygiene that helped minimize the risks to COVID‐19 transmission (Brauer et al., 2020; NIPH, 2020).
3.2. Community Characteristics of KMC Wards
Since there is a heterogeneity in the distribution of containment zones, it is important to analyze community characteristics of infected wards before making a plan for intervention so that resources could be readied in the event of a second wave of virus infections and/or controlling the further transmission of the disease. Analysis of the community characteristics revealed that a combination of demographic factors is responsible for the spread of virus infections (Figure S2). Our data showed that five wards with low population density (less than 50,000 people per km2) have been contained greater than 40 times. In contrast, 16 wards with high population density (greater than 75,000 people per km2) have been contained for less than 20 times. Hence, population density is not the only determinant for virus transmission which is analogous to other studies (e.g., Hamidi et al., 2020). Similar relationships were also observed between households with more than nine individuals and total containment zones. We observed an inverse relationship between the percentage of households using untreated water and total containment zones, and percentage of households with no wastewater drains and total containment zones. While, the relationship between total marginal workers and total containment zones is positive. Similar relationship was also observed for the percentage of BPL households, total uneducated population, and total population in slums with total containment zones.
We then chose 15 highly infected wards where the intensity of containments were greater than 1 per 1,000 population and analyzed demographic characteristics so that interward comparison can be made to understand the reason behind the observed hotspots of containments (Figure 2). The analysis revealed that in three wards (ward no. 7, 63, and 72) greater than 8% households have nonexclusive bedrooms for family members, while in four wards (ward no. 13, 63, 70, and 71) greater than 6% households were crowded with more than nine family members (Figure 2). In addition to that, in six wards (ward no. 7, 13, 73, 76, 82, and 85) population density was greater than 40,000 people per km2 (figure not shown). Among other variables, six wards (ward no. 7, 13, 33, 74, 76, and 85) have higher share of population living in slums (greater than 30% of the total population). In three wards (ward no. 7, 13, and 82) greater than 25% households were below poverty level. In addition to that, in six wards (ward no. 7, 68, 82, 85, 86, and 94) greater than 7% households have access to community latrines only, while in 1 ward (ward no. 13) greater than 5% households have access to untreated water sources only. This suggests heterogeneity in the community characteristics across highly infected wards. Therefore, it is important to formulate multiple planning scenarios based on the heterogeneous community characteristics to achieve an optimal outcome.
Figure 2.
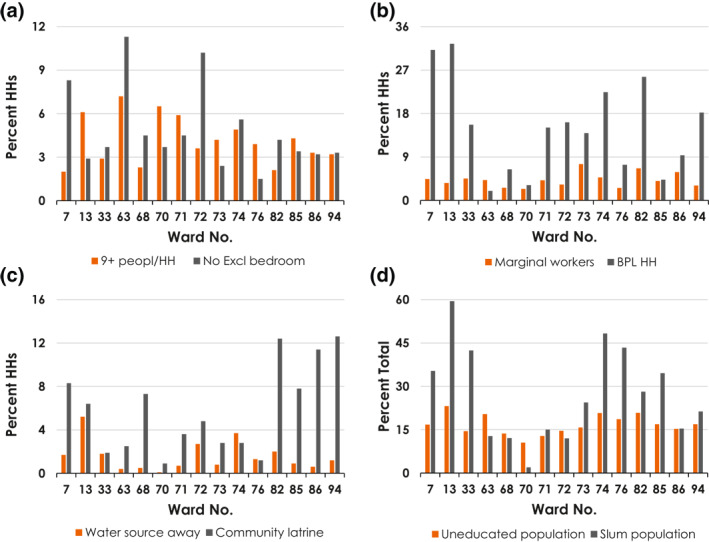
Demographic characteristics of 15 hard hit wards (greater than 1 containment zone per 1,000 population) of Kolkata Municipal Corporation.
3.3. COVID‐19 Risk Mapping at the Ward (Subcity) Level
Different wards were identified as high or low risk of COVID‐19 infections based on the values of CSI. The highest risk wards (rank between 1 and 30) based on CSI were clustered to the eastern and western parts of the KMC area (Figure 3). However, the wards with moderate risk were scattered throughout the KMC area covering both northern and southern parts. The spatial pattern of CSI rank has indicated a widespread nature of COVID‐19 risk across different wards of Kolkata city. This risk map could help policy makers to prioritize prevention strategies to formulate suitable planning.
Figure 3.
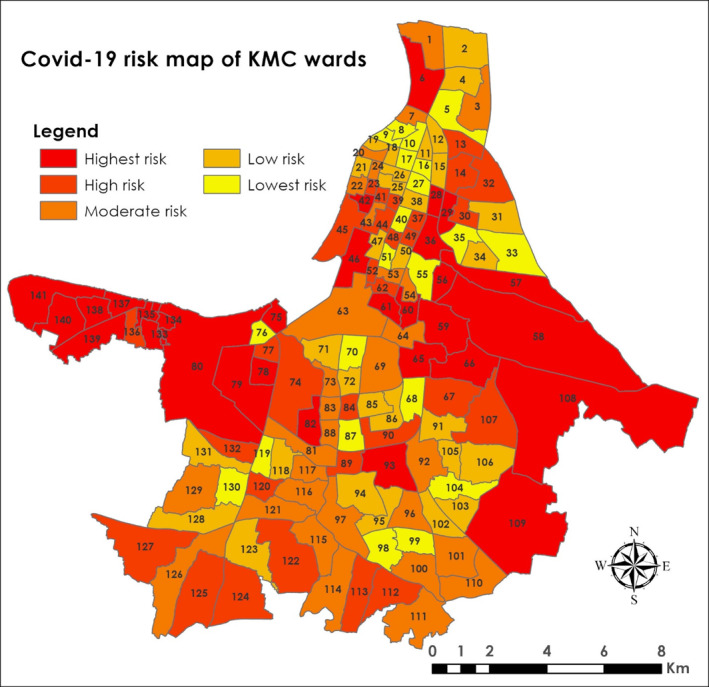
Map showing COVID‐19 risk based on multiple demographic variables. The risk areas were identified on the basis of a “similarity search” in ArcGIS Pro 2.5 (ESRI) using attribute profile and calculation of Cosine Similarity Index (CSI) for 141 wards of Kolkata Municipal Corporation.
COVID‐19 risk mapping showed the ranking of different wards on the basis of different levels of risk, that is, high, moderate, and low. This risk variation across different wards may be explained by variations in different socioeconomic variables. Population density is the highest in north Kolkata and some pockets in central and west Kolkata (Figure 4a). Whereas, population density is less than 25,000 people per km2 in south Kolkata. Population density is one of the major determinants of COVID‐19 infections unless social distancing guidelines are maintained (Hamidi et al., 2020). In New York City, the majority of the infected individuals were reported from the low income zip (PIN) codes and living in crowded households (Comer & Nowlin, 2020). In our study site, the large family households are mostly located (more than 6% households) in the west near Garden Reach and Metiabruz region and parts of north Kolkata. While, in south Kolkata, less than 3% households share their space with more than nine people (Figure 4b). Therefore, population density along with other demographic variables (such as large households and lack of exclusive bed rooms for family members) should play an important role in the virus transmission.
Figure 4.
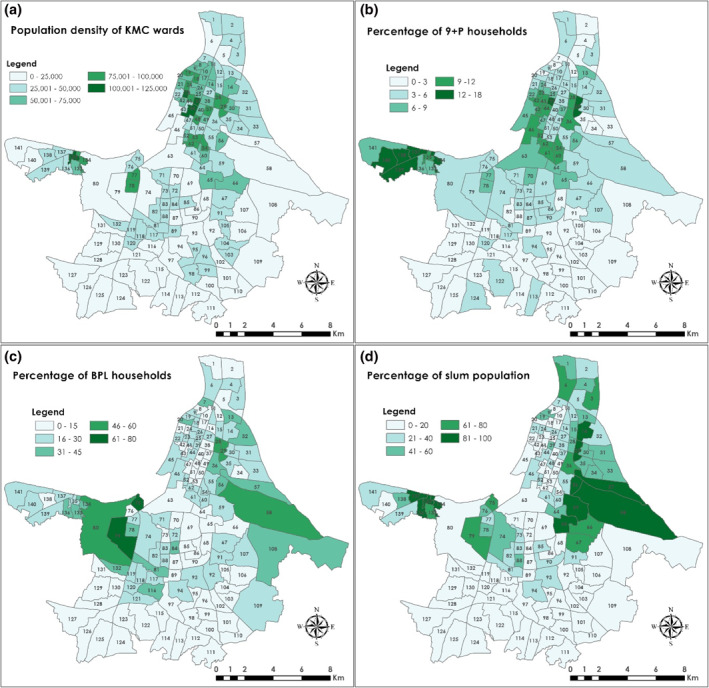
Ward wise distribution of demographic characteristics: (a) Population density (per km2), (b) percentage of 9+ person households, (c) percentage of households below poverty level (BPL), and (d) percentage of people living in slums in Kolkata Municipal Corporation.
Higher percentage of BPL households can be found in several pockets in the eastern and western parts of Kolkata (Figure 4c). These areas also accommodate a larger share of population in slums (Figure 4d). In addition to that higher percentage of uneducated population (greater than 25% of the total population) is closely associated with the people living in slums and BPL (Figure S3a). However, the higher percentage of marginal workers (greater than 6% of the total population) have been located in 24 wards throughout the KMC (Figure S3b). In several wards, people use community latrines of poor hygienic condition which could potentially increase the risk of virus transmission (Figure S3c). In addition to that, a larger share of households in south Kolkata have only access to untreated water sources (Figure S3d). All these factors contribute, to an extent, to the variations in COVID‐19 risk across different wards, because these socially excluded demographics (such as people living in slums and BPL households) lack space and physical environment, access to clean drinking water, sanitation and proper hygiene (Mayne, 2017).
According to the study on groundwater quality, high concentrations of As above WHO guidelines of 10 μg/l were largely found in groundwater sources from southern KMC wards (Figure S4a; Chakraborti et al., 2017). Drinking of As‐contaminated water for a long time could cause carcinogenicity and other noncancerous effects and thus weaken the immune system (Dangleben et al., 2013). Additionally, COVID‐19 virus could potentially source from untreated wastewater (Quilliam et al., 2020). As a larger percentage of households in south Kolkata either do not have drainage systems or connected to an open drainage system for wastewater passing, the chances of infections effectively increases. We believed that case fatality rates could be higher in south Kolkata compared to other parts of KMC due to poor health and hygiene conditions. Additionally, the large parts of east and south Kolkata together with several pockets in slums areas north and west of Kolkata coincided with high TB burden (Figure S4b; Dey et al., 2019). Studies showed that the TB is associated with a 2.1‐fold increased risk of a severe COVID‐19 disease (MOHFW, 2020). According to the WHO, COVID‐19 is expected to affect patients with TB. However, the responses of COVID‐19 and TB complement each other (Dara et al., 2020). Our results showed that some slums and/or other regions in Kolkata with high TB burden exhibited high COVID‐19 infections.
3.4. Nature and Causes of COVID‐19 Infections in KMC Area
Four risk indices were formulated to address the degree of transmission of COVID‐19 virus within the KMC area. These are social distancing index, social awareness index, susceptibility index, and health and hygiene index. All the wards were ranked by using respective index values (Figure 5).
Figure 5.
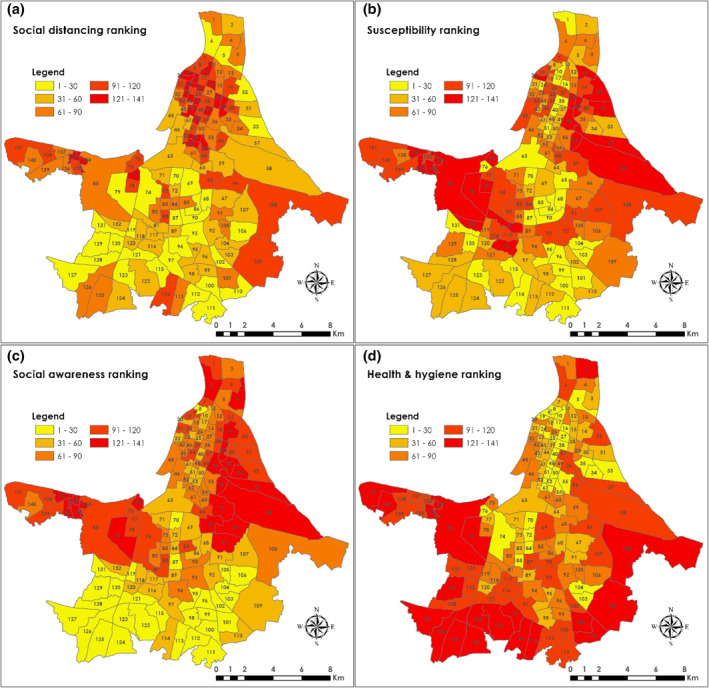
Ranking of KMC wards on the basis of (a) social distancing index, (b) susceptibility index, (c) social awareness index, and (d) health and hygiene index for the formulation of priority strategy(s) to prevent and control transmission of virus infections.
According to the social distancing rank map, the higher ranked wards are located as a cluster which includes parts of north Kolkata, Garden Reach, and Metiabruz in the west, and east Kolkata. These areas have higher population density, higher percentage of large family households (more than nine members), and greater percentage of households access water from outside sources (Figures 5a and S3). According to the Spearman rank correlation coefficient, population density (r R = +0.82) and crowded households (r R = +0.5) have contributed the most in the social distancing ranking.
According to the susceptibility ranking, the eastern and western Kolkata have received higher ranking, which suggests the presence of greater share of susceptible individuals in these locations. Additionally, these are the areas where a larger fraction of the population live below the poverty level together with a higher share of population as marginal workers (Figures 5b and S3). This group of population is among the most vulnerable due to job losses and lockdown of the economy (Sur & Mitra, 2020). According to the Spearman rank correlation coefficient, the percentage of BPL population (r R = +0.95) have contributed the most to the overall rank weighted susceptibility index.
Social awareness index ranking showed highest priority areas in the east and northeastern Kolkata along with parts of Kalighat, Alipore, Mominpore, Garden Reach, and Metiabruz (Figure 5c). Again, these localities included a greater share of slums and uneducated populations. Likewise, Spearman rank correlation coefficient showed that the percentage of uneducated (r R = +0.75) and slum (r R = +0.94) population have contributed to the social awareness ranking and hence the risk of COVID‐19 infections.
Health and hygiene are one of the important factors for COVID‐19 infection because the virus can attack people with weak immune systems. According to health and hygiene index ranking, most of the higher ranked areas are located in the east, south and west Kolkata (Figure 5d). These are the areas where people have limited access to treated water, access to unhygienic community latrines, and households with no drainage system for wastewater (Figure S3). However, the r R values have indicated that the access to untreated water (r R = +0.72) and lack of wastewater drains (r R = +0.85) have played an important role in the health and hygiene ranking.
Health and social inequities can lead to increased risk of virus infection, such as discrimination, occupation, access to healthcare facilities, and choices in job situation (Quinn & Kumar, 2014). Lower socioeconomic status together with poor health and hygiene conditions may exacerbate COVID‐19 infections (Okoi & Bwawa, 2020). According to a study in peri‐urban Tamil Nadu, India, the study population perceived low or no risk of contracting virus instead they feared for economic losses due to COVID‐19 pandemic (Kuang et al., 2020). A considerable proportion of this community did not increase their practice of preventive behaviors, such as social distancing and restricting gatherings. In Kolkata, a section of urban population is still lagging behind from improved living conditions, drinking water, and sanitation facilities. Slum dwellers suffer the most in terms of health and hygiene (Goli et al., 2011). Hence the risk analysis based on four risk indices portrays a clear picture to the policy makers to plan for reducing the risks of COVID‐19 infections in Kolkata as well as in other cities.
4. Implications for Future Policy Decisions
It is easy to emphasize one single risk criterion in an ideal situation when all the other potential risk imposing criteria remain either inert or under control. However, in a real‐world situation all the risk criteria act simultaneously, and thus making it difficult for the policy makers to take immediate measures considering risk criteria individually. Hence, any intervention strategy should focus on an optimized condition based on intertwined rankings to make a greater impact.
We used Spearman's rank correlation coefficient to “optimize” the rankings of the wards by combining social distancing, social awareness, susceptibility, and health and hygiene rankings. A “weighted average” approach was used to evaluate the impact of individual risk criteria during optimization. We then compared the results with current scenarios and highlighted its future usefulness. A “weighted average value” for each risk factor was chosen based on our understanding from interviewing individuals battling the pandemic. It has been well known that the adherence to social distancing would significantly slow the spread of the virus till a scientifically approved clinical solution is achieved and the healthcare system would not be overwhelmed (Tammes, 2020). While, other factors such as susceptibility and health and hygiene conditions should have a lesser impact unless social distancing is not maintained (Hamidi et al., 2020). However, social awareness of the COVID‐19 risk could be as important as social distancing since infections may occur from indirect contacts (Jayaweera et al., 2020). Therefore, we chose to emphasize social distancing and social awareness (while not discarding other indicators) because Kolkata is one of the overcrowded metropolitan cities in the world, where large sections of population are living below the poverty level (Kolb, 2019). The following formulations were considered based on different assigned weight in the optimized ranking of the wards: a) 0.5, 0.3, 0.1, 0.1; b) 0.3, 0.5, 0.1, 0.1; c) 0.4, 0.4, 0.1, 0.1; and d) 0.25, 0.25, 0.25, 0.25, respectively to social distancing, social awareness, susceptibility, and health and hygiene (Figure 6). The calculated Spearman's rank's (r R) positive value indicates that a particular risk criterion in the formulation is playing a more important role than the other on the “optimized performance rank,” whereas negative value highlights less significance (Table S1).
Figure 6.
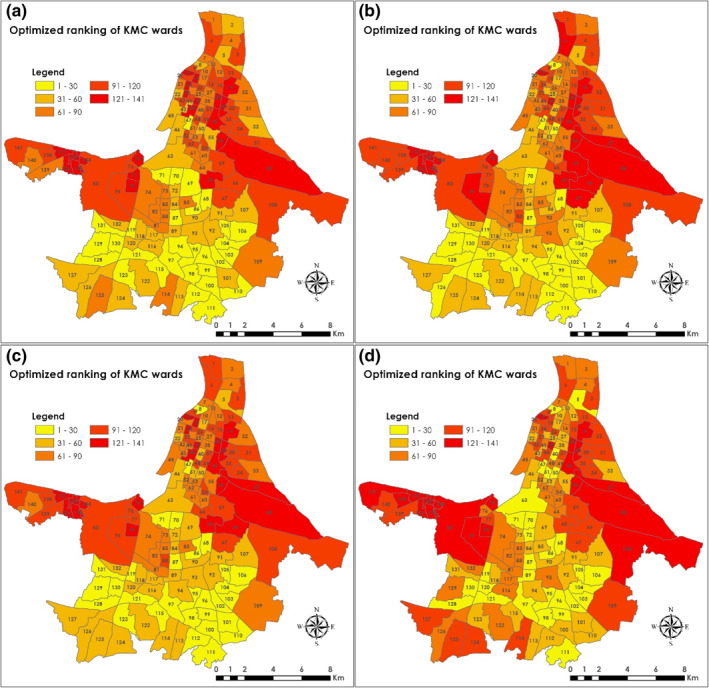
Future scenarios based on the optimized prevention ranking of KMC wards: (a) 0.5 weight to social distancing, 0.3 weight to social awareness, and 0.1 weight equally to the remaining factors; (b) 0.3 weight to social distancing, 0.5 weight to social awareness, and 0.1 weight equally to the remaining factors; (c) 0.4 weight to social distancing, 0.4 weight to social awareness, and 0.1 weight equally to the remaining factors; and (d) 0.25 weight to all four intervention criterion. Based on these optimized rankings targeted prevention on a priority basis would be required to control COVID‐19 infections/transmissions or in the case of future outbreak. Further work is needed to optimize the contributions of different weight factors.
The results indicate that while considering formulation a, the largest ranked wards are mostly located in the north and west of the city, in addition to some wards in the east (Figure 6a). The Spearman's rank correlation coefficient (r R) indicate the greater importance of social awareness (r R = +0.86) and social distancing (r R = +0.73) in formulation a ranks than the susceptibility (r R = +0.57) and health and hygiene (r R = −0.08). However, the highest ranked wards are more intensified to the east and west of the city when the weight of social distancing is lowered to 0.3 and social awareness is increased to 0.5 (formulation b). The rank map showed a few highly ranked wards in central Kolkata (Figure 6b). In this formulation, the major contribution is attributed to social awareness based on Spearman's rank correlation coefficient (r R = +0.96). In formulation c, the largest ranked wards are clustered to the east and west of the city, while majority of the wards in south Kolkata ranked low (Figure 6c). Likewise, Spearman's rank correlation coefficient indicated a major contribution of social awareness (r R = +0.92) in this formulation. When equal weight (0.25) was considered (formulation d), the largest ranked wards are found scattered throughout the KMC, mainly in the east and west of the city (Figure 6d). Again, Spearman's rank correlation coefficient indicated a major contribution of social awareness (r R = 0.79) in this formulation. This suggests that social distancing is not exclusively controlling the transmission of COVID‐19 infections in different parts of Kolkata. Rather, a combination of other factors such as lack of social awareness and high susceptibility are contributing to the current condition of virus transmission in Kolkata.
Our analysis has revealed slow COVID‐19 community transmission in the areas with poor health & hygiene, typically in south Kolkata, perhaps due to lower the number of susceptible individuals than in other localities of the KMC. The knowledge of heterogeneity in the number of susceptible individuals evidently makes varied levels of disease propagation within the KMC area, also suggested by the observed greater containments of COVID‐19 cases in central and northeast Kolkata during early phase of the pandemic (Figure 1c). While modeling the spread of epidemics, Smilkov et al. (2014) had considered heterogeneous susceptibility in their model for an accurate understanding of the epidemic spreading processes. On the other hand, a positive association between ambient temperature and surge in COVID‐19 cases in large cities with higher population densities is indicative of the role physical factors in the survival and transmission of SARS‐CoV‐2 (Sasikumar et al., 2020). The heterogeneity in such physical factors at a subcity level would essentially contribute to the greater success in tackling the pandemic. Hence, while tackling such a pandemic, the policy makers should collectively consider all the risk criteria, rather than focusing on one single risk factor at a time. However, we need to keep in mind that this finding is case sensitive as the assigned “weighted average value” were specific to Kolkata and thus, it could vary from place to place.
5. Limitations of This Research
Due to lack of data at the time of inception of this study, we could not incorporate some other potentially important variables that could have made our analysis a bit more robust. Hence, we had to selectively focus on the reported variables as we have the related data for them in hand (and are publicly available). One may surely look at it as a compromise. However, we are committed to extend this work to explore those missed out variables in the future and incorporate these attributes through machine learning approaches such as “decision tree” and “random forest model” to aid in the decision making process.
6. Conclusion
The identification of high risk and hard hit wards (subcity) of KMC along with associated community characteristics helps formulation of planning scenarios for the future to minimize the impact and ensuing vaccination drive against future COVID‐19 infections. Three major COVID‐19 hotspots have been identified, which are central Kolkata, southeast Kolkata, and northeast Kolkata. Our results have indicated that social distancing alone is not causing the transmission of virus, instead a combination of multiple risk factors is playing a critical role in increasing COVID‐19 containments in Kolkata. Raising awareness among the population living in the areas of higher risk regarding use of masks, hand hygiene, and keeping a safe distance would reduce the spread of virus to a great extent until we have the vaccines available for the general public. Ranking of wards in terms of the degree of riskness as measured by four risk indices would no doubt help policy makers to address various preventive measures to control virus infections. We strongly believe that our scientific analysis provides the policy makers and Government agencies an idea to fight a possible second wave of COVID‐19 infections. Finally, our study presents a universal application of the methodology to tackle any pandemic situation just by tweaking and tuning the parameters and values a bit according to necessity.
Conflict of Interest
The authors declare no conflicts of interest relevant to this study.
Supporting information
Supporting Information S1
Acknowledgments
The authors thank the Department of Geography, Hunter College of the City University of New York for providing ArcGIS Pro 2.5.1 and IBM SPSS 25 software package. BN attended a GIS course run by Dr. Williamson and thanked him for his support.
Nath, B. , Majumder, S. , Sen, J. , & Rahman, M. M. (2021). Risk analysis of COVID‐19 infections in Kolkata metropolitan city: A GIS‐based study and policy implications. GeoHealth, 5, e2020GH000368. 10.1029/2020GH000368
Data Availability Statement
In addition to that the data is available through a supplementary file added to this manuscript and can be downloaded from HydroShare, http://www.hydroshare.org/resource/fbde8047969f43b9b24dbfdb012983d8. The data is also available through the following directions (detailed citations are provided in the reference list):
1. The data were collected from the Primary Census Abstract, 2011 of the Government of India (Census, 2011).
2. Homeless people sleeping on streets were taken from Sabuj Sangha (2014).
3. Arsenic concentrations in untreated groundwater used for drinking and cancer risk index were taken from Chakraborti et al. (2017).
4. Tuberculosis (TB) burden was adapted from Dey et al. (2019).
5. We have computed ward wise percentages of population below poverty level and slums from Basu (2015) and Das Gupta (2009).
6. Publicly accessible containment zones and/or isolation units were collected from: Deccan Herald, (2020); Javed, (2020); Mehta, (2020); Shaurya, (2020); The Bengal Story, (2020); and West Bengal State Government, (2020).
References
- Abrams, E. M. , & Szefler, S. J. (2020). COVID‐19 and the impact of social determinants of health. The Lancet Respiratory Medicine, 8, 659–661. [DOI] [PMC free article] [PubMed] [Google Scholar]
- Acharya, R. , & Porwal, A. (2020). A vulnerability index for the management of and response to the COVID‐19 epidemic in India: An ecological study. Lancet Global Health, 8, e1142–e1151. [DOI] [PMC free article] [PubMed] [Google Scholar]
- Baggett, T. P. , Keyes, H. , Sporn, N. , & Gaeta, J.M. (2020). Prevalence of SARS‐CoV‐2 infection in residents of a large homeless shelter in Boston. Journal of the American Medical Association, 323, 2191–2192. 10.1001/jama.2020.6887 [DOI] [PMC free article] [PubMed] [Google Scholar]
- Basu, A. (2015). A critical appreciation of fund utilization by the people's representatives and its impact on local area development in Kolkata Municipal Corporation area since 2000 (PhD thesis). Department of Geography, University of Calcutta.
- Brauer, M. , Zhao, J. T. , Bennitt, F. B. , & Stanaway, J. D. (2020). Global access to handwashing: Implications for COVID‐19 control in low‐income countries. Environmental Health Perspectives, 128, 57005. 10.1289/EHP7200 [DOI] [PMC free article] [PubMed] [Google Scholar]
- CDC . (2020). Center for disease control and prevention. Retrieved from https://www.cdc.gov/
- Census. (2011). Census of India website: Office of the Registrar General & Census Commissioner. Ministry of Home Affairs, Government of India. Retrieved from https://censusindia.gov.in/ [Google Scholar]
- Chakraborti, D. , Das, B. , Rahman, M. M. , Nayak, B. , Pal, A. , Sengupta, M. K. , et al. (2017). Arsenic in groundwater of the Kolkata Municipal Corporation (KMC), India: Critical review and modes of mitigation. Chemosphere, 180, 437–447. [DOI] [PubMed] [Google Scholar]
- Comer, K. , & Nowlin, M. (2020). Socioeconomic factors explain why some New York ZIP codes were hit hardest by COVID‐19. Retrieved from https://www.savi.org/2020/06/24/socioeconomic-factors-explain-why-some-new-york-zip-codes-were-hit-hardest-by-covid-19/
- COVID‐19 India . (2020). Retrieved from Coronavirus outbreak in India. Retrieved from https://www.covid19india.org/
- Dangleben, N. L. , Skibola, C. F. , & Smith, M. T. (2013). Arsenic immunotoxicity: A review. Environmental Health, 12, 73. [DOI] [PMC free article] [PubMed] [Google Scholar]
- Dara, M. , Sotgiu, G. , Reichler, M. R. , Chiang, C.‐Y. , Chee, C. B. E. , & Migliori, G. B. (2020). New diseases and old threats: Lessons from Tuberculosis for the COVID‐19 response. International Journal of Tuberculosis & Lung Disease, 24, 544–545. [DOI] [PubMed] [Google Scholar]
- Das, A. , Ghosh, S. , Das, K. , Dutta, I. , Basu, T. , & Das, M. (2020). Re:(In) visible impact of inadequate WaSH Provision on COVID‐19 incidences can be not be ignored in large and megacities of India. Public Health, 185, 34–36. [DOI] [PMC free article] [PubMed] [Google Scholar]
- Das Gupta, S. (2009). Geography of urban poverty in the city of Kolkata (PhD thesis). Department of Geography, University of Calcutta.
- Deccan Herald . (2020). Coronavirus: Here's full list of 338 containment zones in Kolkata. Retrieved from https://www.deccanherald.com/national/east-and-northeast/coronavirus-heres-full-list-of-338-containment-zones-in-kolkata-836460.html
- Dey, A. , Thekkur, P. , Ghosh, A. , Dasgupta, T. , Bandopadhyay, S. , Lahiri, A. , et al. (2019). Active case finding for Tuberculosis through TOUCH agents in selected high TB burden wards of Kolkata, India: A mixed methods study on outcomes and implementation challenges. Travel Medicine and Infectious Disease, 4, 134. 10.3390/tropicalmed4040134 [DOI] [PMC free article] [PubMed] [Google Scholar]
- Ghosh, D. (2020). Kolkata 15 high‐rises, two slums on list of 31 containment zones. Retrieved from https://timesofindia.indiatimes.com/city/kolkata/15-high-rises-2-slums-on-list-of-31-containment-zones/articleshow/77188071.cms
- Ghosh, S. (2013). Regional disparities of Slums, 2013 – An overview with special emphasis to Kolkata. International Journal of Humanities and Social Science Invention, 2, 48–54. [Google Scholar]
- Goli, S. , Arokiasamy, P. , & Chattopadhayay, A. (2011). Living and health conditions of selected cities in India: Setting priorities for the National Urban Health Mission. Cities, 28, 461–469. [Google Scholar]
- Hamidi, S. , Sabouri, S. , & Ewing, R. (2020). Does density aggravate the COVID‐19 pandemic? Journal of the American Planning Association, 86, 495–509. 10.1080/01944363.2020.1777891 [DOI] [Google Scholar]
- Hu, M. , Roberts, J. D. , Azevedo, G. P. , & Milner, D. (2020). The role of built and social environmental factors in COVID‐19 transmission: A look at America's capital city. Sustainable Cities and Society, 65, 102580. 10.1016/j.scs.2020.102580 [DOI] [Google Scholar]
- Javed, Z. , Ghosh, D. , Chakraborti, S. , & Banerjee, T. (2020). Kolkata, suburbs add 66 containment zones. Retrieved from https://timesofindia.indiatimes.com/city/kolkata/city-has-264-high-risk-spots-new-pockets-in-central-south-east-localities-worry-cops/articleshow/75479992.cms
- Jayaweera, M. , Perera, H. , Gunawardana, B. , & Manatunge, J. (2020). Transmission of COVID‐19 virus by droplets and aerosols: A critical review on the unresolved dichotomy. Environmental Research, 188, 109819. 10.1016/j.envres.2020.109819 [DOI] [PMC free article] [PubMed] [Google Scholar]
- Johns Hopkins University & Medicine . (2020). Coronavirus resource center. Retrieved from https://coronavirus.jhu.edu/
- Kaur, S. , Bherwani, H. , Gulia, S. , Vijay, R. , & Kumar, R. (2020). Understanding COVID‐19 transmission, health impacts and mitigation: Timely social distancing is the key. Environment, Development and Sustainability. 10.1007/s10668-020-00884-x [DOI] [PMC free article] [PubMed] [Google Scholar]
- Kolb, E. (2020). 75,000 people per square mile? These are the most densely populated cities in the world. Retrieved from https://www.usatoday.com/story/news/world/2019/07/11/the-50-most-densely-populated-cities-in-the-world/39664259/
- Kormann, C. (2020). How long will it take to develop a coronavirus vaccine? Retrieved from https://www.newyorker.com/news/news-desk/how-long-will-it-take-to-develop-a-coronavirus-vaccine
- Kuang, J. , Ashraf, S. , Das, U. , & Bicchieri, C. (2020). Awareness, risk perception, and stress during the COVID‐19 pandemic in communities of Tamil Nadu, India. International Journal of Environmental Research and Public Health, 17, 7177. 10.31234/osf.io/qhgrd [DOI] [PMC free article] [PubMed] [Google Scholar]
- Lai, C.‐C. , Shih, T‐P. , Ko, W‐C. , Tang, H‐J. , & Hsueh, P‐R. (2020). Severe acute respiratory syndrome coronavirus 2 (SARS‐CoV‐2) and coronavirus disease‐2019 (COVID‐19): The epidemic and the challenges. International Journal of Antimicrobial Agents, 55, 105924. 10.1016/j.ijantimicag.2020.105924 [DOI] [PMC free article] [PubMed] [Google Scholar]
- Mahajan, P. , & Kaushal, J. (2020). Epidemic trend of COVID‐19 transmission in India during lockdown‐1 phase. Journal of Community Health, 45, 1291–1300. 10.1007/s10900-020-00863-3 [DOI] [PMC free article] [PubMed] [Google Scholar]
- Mayne, A. (2017). The history of a global injustice. Chicago, IL: University of Chicago Press. [Google Scholar]
- Mehta, P. (2020). Following are 227 containment zones in Kolkata. Retrieved from https://twitter.com/pooja_news/status/1254778629289959425
- Ministry of Health and Family Welfare (MOHFW), Government of India . (2020). Guidance note on bi‐directional TB‐COVID screening and screening of TB among ILI/SARI cases. Retrieved from https://www.mohfw.gov.in/pdf/1TBCOVIDscreeningguidancenote.pdf
- Nath, K. J. (2003). Home hygiene and environmental sanitation: A country situation analysis for India. International Journal of Environmental Health Research, 13, S19–S23. [DOI] [PubMed] [Google Scholar]
- Nguyen, L. H. , Drew, D. A. , Graham, M. S. , Joshi, A. D. , Guo, C‐G. , Ma, W. , et al. (2020). Risk of COVID‐19 among front‐line health‐care workers and the general community: A prospective cohort study. The Lancet Public Health, 9, E475–E483. [DOI] [PMC free article] [PubMed] [Google Scholar]
- Norwegian Institute of Public Health (NIPH) . (2020). Hand hygiene, cough etiquette, face masks, cleaning and laundry – Advice and information to the general public. Retrieved from https://www.fhi.no/en/op/novel-coronavirus-facts-advice/facts-and-general-advice/hand-hygiene-cough-etiquette-face-masks-cleaning-and-laundry/
- Okoi, O. , & Bwawa, T. (2020). How health inequality affect responses to the COVID‐19 pandemic in Sub‐Saharan Africa. World Development, 135, 105067. 10.1016/j.worlddev.2020.105067 [DOI] [PMC free article] [PubMed] [Google Scholar]
- Pasricha, A. (2020). India's cramped slums are potential coronavirus hotspots. Retrieved from https://www.voanews.com/science-health/coronavirus-outbreak/indias-cramped-slums-are-potential-coronavirus-hotspots
- Quilliam, R. S. , Weidmann, M. , Moresco, V. , Purshouse, H. , O'Hara, Z. , & Oliver, D. M. (2020). COVID‐19: The environmental implications of shedding SARS‐CoV‐2 in human faeces. Environment International, 140, 105790. 10.1016/j.envint.2020.105790 [DOI] [PMC free article] [PubMed] [Google Scholar]
- Quinn, S. C. , & Kumar, S. (2014). Health inequalities and infectious disease epidemics: A challenge for global health security. Biosecurity and Bioterrorism, 12, 263–273. [DOI] [PMC free article] [PubMed] [Google Scholar]
- Sabuj Sangha . (2014). The homeless people of Kolkata. Retrieved from https://www.academia.edu/8326579/The_Homeless_People_of_Kolkata [Google Scholar]
- Sasikumar, K. , Nath, D. , Nath, R. , & Chen, W. (2020). Impact of extreme hot climate on COVID‐19 outbreak in India. GeoHealth, 4, e2020GH000305. [DOI] [PMC free article] [PubMed] [Google Scholar]
- Shaurya, S. (2020). Containment zones in West Bengal climb to 2, Kolkata worst‐affected. Retrieved from https://www.india.com/news/containment-zones-in-west-bengal-climb-to-2604-kolkata-worst-affected-full-list-here-4069550/
- Smilkov, D. , Hidalgo, C. , & Kocarev, L. (2014). Beyond network structure: How heterogeneous susceptibility modulates the spread of epidemics. Scientific Reports, 4, 4795. 10.1038/srep04795 [DOI] [PMC free article] [PubMed] [Google Scholar]
- Sur, P. , & Mitra, E. (2020). Social distancing is a privilege of the middle class. For India's slum dwellers, it will be impossible. Retrieved from https://www.cnn.com/2020/03/30/india/india-coronavirus-social-distancing-intl-hnk/index.html
- Tammes, P. (2020). Social distancing, population density, and spread of COVID‐19 in England: A longitudinal study. BJGP Open, 4, bjgpopen20X101116. 10.3399/bjgpopen20X101116 [DOI] [PMC free article] [PubMed] [Google Scholar]
- Thachil, T. (2020). Despite COVID‐19, why did migrant workers go back? Retrieved from https://www.hindustantimes.com/analysis/despite-covid-19-why-did-migrant-workers-go-back/story-NPhLzTd4joLSovjMDxCtaM.html
- The Bengal Story . (2020). Here's the full list of 1,009 containment zones in Kolkata. Retrieved from https://thebengalstory.com/english/heres-the-full-list-of-1009-containment-zones-in-kolkata/
- The New Indian Express . (2020). West Bengal Government comes up with containment strategies for COVID‐19 ‘high‐risk’ spots. Retrieved from https://www.newindianexpress.com/nation/2020/apr/14/west-bengal-government-comes-up-with-containment-strategies-for-covid-19-high-risk-spots-2130185.html
- Tsai, J. , & Wilson, M. (2020). COVID‐19: A potential public health problem for homeless populations. Lancet Public Health, 5, e186–e187. [DOI] [PMC free article] [PubMed] [Google Scholar]
- U.S. Government response to coronavirus, COVID‐19 . (2020). Retrieved from https://www.usa.gov/coronavirus
- UN Sustainable Development Goals . (2020). Goal 6: ensure access to water and sanitation for all. Retrieved from https://www.un.org/sustainabledevelopment/water-and-sanitation/
- UNDP. (2010). Human Development Report 2010: The Real Wealth of Nations – Pathways to human Development. Retrieved from http://hdr.undp.org/en/content/human-development-report-2010
- West Bengal State Government . (2020). Awareness & prevention of COVID‐19. A dedicated website on COVID‐19 by the West Bengal State Government. Retrieved from https://wb.gov.in/COVID-19.aspx
- Wu, L. (2020). A timeline of COVID‐19 symptoms. Retrieved from https://blog.bcbsnc.com/2020/07/a-timeline-of-covid-19-symptoms/
- You, Y. , & Pan, S. (2020). Urban vegetation slows down the spread of coronavirus disease (COVID‐19) in the United States. Geophysical Research Letters, 47, e2020GL089286. 10.1029/2020GL089286 [DOI] [Google Scholar]
Associated Data
This section collects any data citations, data availability statements, or supplementary materials included in this article.
Supplementary Materials
Supporting Information S1
Data Availability Statement
In addition to that the data is available through a supplementary file added to this manuscript and can be downloaded from HydroShare, http://www.hydroshare.org/resource/fbde8047969f43b9b24dbfdb012983d8. The data is also available through the following directions (detailed citations are provided in the reference list):
1. The data were collected from the Primary Census Abstract, 2011 of the Government of India (Census, 2011).
2. Homeless people sleeping on streets were taken from Sabuj Sangha (2014).
3. Arsenic concentrations in untreated groundwater used for drinking and cancer risk index were taken from Chakraborti et al. (2017).
4. Tuberculosis (TB) burden was adapted from Dey et al. (2019).
5. We have computed ward wise percentages of population below poverty level and slums from Basu (2015) and Das Gupta (2009).
6. Publicly accessible containment zones and/or isolation units were collected from: Deccan Herald, (2020); Javed, (2020); Mehta, (2020); Shaurya, (2020); The Bengal Story, (2020); and West Bengal State Government, (2020).