

Abstract
Background
New evidence suggests that PM2.5 is associated with dementia (LOD). However, epidemiological studies for the entire population have not been implemented yet.
Methods
We utilized approximately 94 million follow-up records from fee-for-service Medicare records for 13 million Medicare beneficiaries residing in the southeastern U.S. from 2000 to 2013. For exposure to PM2.5, we used spatially and temporally continuous data that improved those from monitors. To account for time-varying PM2.5 levels, the Cox model with the Andersen-Gill counting process was applied. Stratified analyses by subtype of dementia and levels of urbanization of residence were performed.
Results
During a median follow-up of 6 years, 1,409,599 hospitalizations for dementia occurred. The adjusted hazard ratio (HR) of hospitalization with dementia was 1.049 (95% confidence interval [CI], 1.048 to 1.051) per 1 μg/m3 increase in annual PM2.5. In particular, the hazard ratio for vascular dementia (HR, 1.086; 95% CI, 1.082 to 1.090) was high. The magnitude of the effect grew as the level of urbanization increased (HR, 1.036; 95% CI, 1.031 to 1.041 in rural areas versus HR, 1.052; 95% CI, 1.050 to 1.054 in metropolitan areas).
Conclusions
Long-term exposure to higher PM2.5 was associated with increased hospitalizations with dementia.
Keywords: PM2.5 and dementia, chronic effect of PM2.5, temperature, Medicare, southeastern U.S.
Introduction
Among the most potent characteristics of particulate matter with aerodynamic diameter ≤ 2.5 μm (PM2.5) are its respirable size as well as toxic components from anthropogenic sources. Many studies have shown its harmful effects such as respiratory and cardiovascular diseases (CVD)1–5.
New evidence suggests that PM2.5 is also associated with dementia6–12. The main hypothesis is that PM2.5 directly or indirectly affects neurodegeneration by inducing inflammation and oxidative stress in the cerebrovascular system. An animal study found that air pollution may alter the blood brain barrier (BBB) permeability13 and interact with a genetic trait for Alzheimer’s disease14. Maher et al.11 identified magnetite nanoparticles in the human brain that precisely match ambient air pollutants. They speculated that particles may enter the brain directly and generate damaging reactive oxygen species (ROS). Cacciottolo et al.14 reported an interaction between PM2.5 and Apolipoprotein E (APOE) ε4/4 carriers among aged women. The APOE ε4 allele is known as a major genetic risk factor for Alzheimer’s disease15, the most common type of dementia16.
A recent large epidemiological study that includes metropolitan areas in the northeastern U.S has reported that the long-term effects of PM2.5 increase hospitalization risks of Alzheimer’s disease, Parkinson’s disease, and dementia7. However, there have not been studies on the potential harmful effects of long-term exposure to PM2.5 leading dementia hospitalization in much larger study populations that include medicare participants with a place of residence in un-monitored areas.
Because most older adults live in suburban areas17, another large-scale epidemiological study that also covers those areas is called for. With data acquistion at the population level for the eldery and spatio-temporal modeling based on satellite images, it has become possible to assess the relationship between PM2.5 and late-onset dementia (LOD; onset of dementia at the age of 65 and older, hereinafter referred to as dementia).
The southeastern region has one of the highest percentages of aged population in the United States18. Also, it is one of the regions with the highest dementia prevalence standardized by population distribution, and many states in this region show the highest mortality due to dementia19.
Thus, we evaluated extensive hospital admission data from Medicare to determine the relationship between long-term exposure to PM2.5 and the risk of dementia.
Method
Data
Medicare data
We obtained the Medicare Provider and Analysis Review (MedPAR) files for Medicare enrollment and fee-for-service claims for hospitalization from the Research Data Assistance Center (ResDAC). The study population consists of beneficiaries of the Medicare fee-for-service (FFS) plan who were aged 65 or older and resided in the southeastern part of the United States between 2000 and 2013. Specifically, the study area consisted of the seven states of Florida, North Carolina, Georgia, Tennessee, Alabama, South Carolina, and Mississippi.
The variables from data on Medicare beneficiaries that were used for the current study include hospitalization date, age, sex, race, state of residence, ZIP Code of residence, dual eligibility for both Medicare and Medicaid, and the date of death. We did not acquire any human identifiers such as name or Social Security number.
Beneficiaries were identified as having dementia if they claimed their first hospitalization with the diagnosis codes for dementia. All types of diagnosis codes in ICD-9 (the primary, secondary, and other concurrent diagnosis codes up to the 10th order) were considered. For the list of ICD-9 codes for dementia, we referenced the Chronic Condition Data Warehouse (CCW)20, Centers for Medicare & Medicaid Services (CMS). The included ICD-9 CM codes were as follows: 290.0, 290.20, 290.21, 290.3, 290.40, 290.41, 290.42, 290.43, 291.2, 294.0, 294.1, 294.10, 294.11, 331.0, 331.1, 331.11, 331.19, 331.2, 331.7, and 331.82. It is worth noting that early-onset dementia (EOD; dementia onset before 65 years old) was not of interest in our study21. The codes for EOD (290.1 and 290.1x) were also not found in the original dataset
The variables from the above Medicare claims for hospitalization with dementia included patient’s date of admission and diagnosis codes up to the tenth diagnosis. All codes were determined at discharge and in International Classification of Diseases, 9th Revision, Clinical Modification (ICD-9-CM).
Members who did not have information on sex, race, or locatable Zip Code or had erroneous entries such as hospitalization records after death or who were hospitalized with dementia at study entry were excluded from statistical analysis.
PM2.5 data
The vast majority of studies that have investigated the effect of PM2.5 on health have used PM2.5 measurements from ground monitoring stations as a surrogate for individual exposure in their location. However, PM2.5 data from monitoring stations have many limitations in terms of both spatial and temporal coverage. Also the absolute number of monitoring stations is few and thus ecological assignment of exposure is hindered by the remote distance between the study subjects and the monitors. Furthermore, the monitors are mainly located in urban areas. Often this has led to rural areas being isolated from the environmental epidemiological studies on air pollution. Another disadvantage is that many ground monitors operate only on every a few days. Therefore, daily readings are not available for many regions. As a result, the use of discrete PM2.5 data from the exiting monitoring stations has suffered from less statistical power and bias towards the null22.
To overcome these limitations, Lee et al.23 have produced spatially and temporally continuous PM2.5 concentrations at 1-km resolution on a daily basis. They calibrated observations from a satellite with a 1-km resolution to PM2.5 data from ground monitors. Aerosol Optical Depth (AOD) values measured by the Moderate Resolution Imaging Spectroradiometer (MODIS) device aboard the Aqua satellite operated by NASA are considered to be indirect measurements of the ground levels of PM2.5. Those values were fitted against the ground PM2.5 levels, incorporating other factors such as meteorological observations and land use that affect the relationship between the AOD values and ground surface level of PM2.5 from monitoring sites. The modeling has shown high performance (mean from 10-fold cross-validated R2 = 0.76 and root- mean-squared prediction errors = 2.74; slopes for the observations and predictions were almost 1, indicating no bias). Further details are described elsewhere23. We obtained additional data for extended years and reproduced the updated PM2.5 estimates.
To assign PM2.5 exposure to the Medicare members, we used the Zip Codes of their mailing addresses. The closest PM2.5 estimate was linked to the centroid of the Zip Code in the Euclidian geodesic distance. Then the annual averages were calculated for each Zip Code.
We also acquired PM2.5 data from the monitoring stations operated by the Environmental Protection Agency (EPA). Each Zip Code area was given PM2.5 observations measured by the closest ground monitor from the zip centroid in the Euclidian distance. The calculation of the annual average PM2.5 by Zip Code followed.
Geographical Boundaries and Community-level Variables
To locate the beneficiaries’ Zip Codes, the shapefile of Zip Codes from the Esri Data and Maps dataset were used. To determine the level of urbanization of the Zip Code, we acquired the Current Metropolitan Statistical Area/Micropolitan Statistical Area (CBSA) shapefile for the year 200724. This is one of the TIGER/Line Shapefiles from the Master Address File/Topologically Integrated Geographic Encoding and Referencing (MAF/TIGER) Database (MTDB) provided by the U.S. Census Bureau. It delineates the boundaries of metropolitan statistical areas and micropolitan statistical areas defined by the Office of Management and Budget (OMB). Metropolitan statistical areas are defined as urbanized areas of 50,000 or more population. Micropolitan statistical area are termed urban clusters with populations between 10,000 and 50,00025.
The level of urbanization of the Zip Code was determined according to whether or not the centroid of the Zip Code fell inside the boundary of the metropolitan/micropolitan statistical area.
The Medicare dataset does not provide a variable on individual-level educational attainment. To complement it, we used educational attainment data at the Zip Code level in 2007 through 2011 from the American Community Survey (ACS). The ACS is administered by the U.S. Census Bureau’s Population Estimates Program to provide up-to-date information about ongoing changes in the U.S. population in between the decennial census. It is conducted on a yearly basis to selected households asking different questions from the census. It is the largest household survey in the nation and provides information for policy making by the federal and state governments.
Statistical analyses
We fit extended Cox models to regress the first hospitalization related with dementia against the annual PM2.5 concentration level while controlling for other covariates.
Our study cohort was defined as Medicare membership between 2000 and 2013 in the southeastern U.S. Therefore, the follow-up started January 1st, 2000 and a subject entered the cohort during the study period when he or she lived in the area and reached the age of 65 or if they moved into the area after the age of 65. We assumed the start day was the first day of each year (January 1st). Follow-up was terminated when the first hospitalization with dementia or death occurred, the study period reached the end point (December 31st, 2013), or beneficiary was lost to follow-up, whichever came first.
Since the nature of exposure of interest varies with time, the dataset was prepared according to the Andersen-Gill counting process26. That is, if the follow-up period was several years, multiple yearly records were created for those subjects until the outcome of interest occurred. Each follow-up record (year) was defined in the interval format that has elapsed days since entry. Annual PM2.5 levels were matched according to mailing Zip Code and calendar year of follow-up.
In the model, we controlled for age, sex, race, dual eligibility for Medicaid, educational attainment data at the Zip Code level, and U.S. state of address. We stratified analyses by age since it is a most potent risk factor for dementia and is also correlated with the length of the exposure period. Other factors were controlled by adding those variables in the model statement as covariate terms. Medicaid eligibility was used as a surrogate measurement for income, as the eligibility is related mostly to low income. The zip code level education was included as a surrogate measurement for individual-level educational attainment. Meanwhile, it is established that PM2.5 causes CVD27–29, which is also associated with an increase in the incidence of dementia30–32. Thus we did not control for cardiovascular diseases in our model since it is an intermediate variable lying on the causal pathway from PM2.5 and dementia to avoid overadjustment bias33.
We assessed the relation between PM2.5 and dementia by level of urbanization of residence and quantified the effects in rural areas. Using the CBSA map data mentioned in the earlier section, we classified Zip Code numbers into three categories: metropolitan area, micropolitan area, and rural area; and performed separate analyses for each area. In doing so, we also compared the use of monitoring stations and the use of satellite data as an exposure metric to examine how different exposure assessment affect the effect estimates by urbanization.
Various sensitivity analyses were performed in terms of exposure assessment and outcome ascertainment. In the first sensitivity analysis, we limited study subjects only to those who had entered the cohort at the age of 65 not at a later age. Our intention was to prevent left censoring, because we were interested in dementia in the elderly population. This also kept the exposure history constant by preventing entry into the study such as people moving into the study area. In the second sensitivity analysis, we evaluated how results changed when the exposure metric was conventional, namely the use of ground monitoring stations. Lastly, a longer exposure-period of 5 years was examined. We confined the data only for those who appears to the Medicare records at the age of 65 in the study area since 2005. For instance, the hospitalization records in 2005 were given the 5-years average of PM2.5 since 2000 in the corresponding zip code area.
Data construction and statistical analyses were conducted using ArcGIS 10.5 (Esri, Inc., Redlands, CA, USA), R (R Foundation for Statistical Computing, Vienna, Austria) and SAS 9.4 (SAS Institute, Inc., Cary, NC, USA).
Results
There were 13,374,404 Medicare beneficiaries who resided in the seven states in the Southeastern U.S. (AL, FL, GA, MS, NC, SC, and, TN) from 2000 through 2013. After data refinement, 64,503 people (0.5 % of the original dataset) were excluded from the analysis, and thus follow-up records from 13,309,901 members were used. The median follow-up period was 6 years and the characteristics of the study population are shown in Table 1. The average PM2.5 concentration was 11.02 μg/m3 with a standard deviation of 2.5 μg/m3 (25th to 75th percentile range=8.40 to 14.01 μg/m3). The spatial distribution of PM2.5 is described in Figure 1.
Table 1.
Characteristics of the Medicare Fee-For-Service Beneficiaries in the Southeastern U.S. 2000–2013.
| Characteristic | Statistic |
|---|---|
| Mean Age, yr (SD) | 70.4 (7.3) |
| Female, No. (%) | 7,438,243 (55.9) |
| Race, No. (%) | |
| White | 11,022,085 (82.8) |
| Black | 1,833,340 (13.8) |
| Other | 454,476 (3.4) |
| Medicaid, No. (%) | 1,814,448 (13.6) |
| Level of Urbanization, No. (%) | |
| Metropolitan | 10,243,823 (77.0) |
| Micropolitan | 1,974,696 (14.8) |
| Rural | 1,091,382 (8.2) |
| State, No. (%) | |
| Florida | 5,307,795 (39.9) |
| North Carolina | 2,033,958 (15.3) |
| Georgia | 1,693,701 (12.7) |
| Tennessee | 1,445,879 (10.9) |
| Alabama | 1,118,188 (8.4) |
| South Carolina | 1,044,485 (7.8) |
| Mississippi | 665,895 (5.0) |
Abbreviations: yr, year; SD, standard deviation; N, number; m, meter; wk, week
Figure 1.
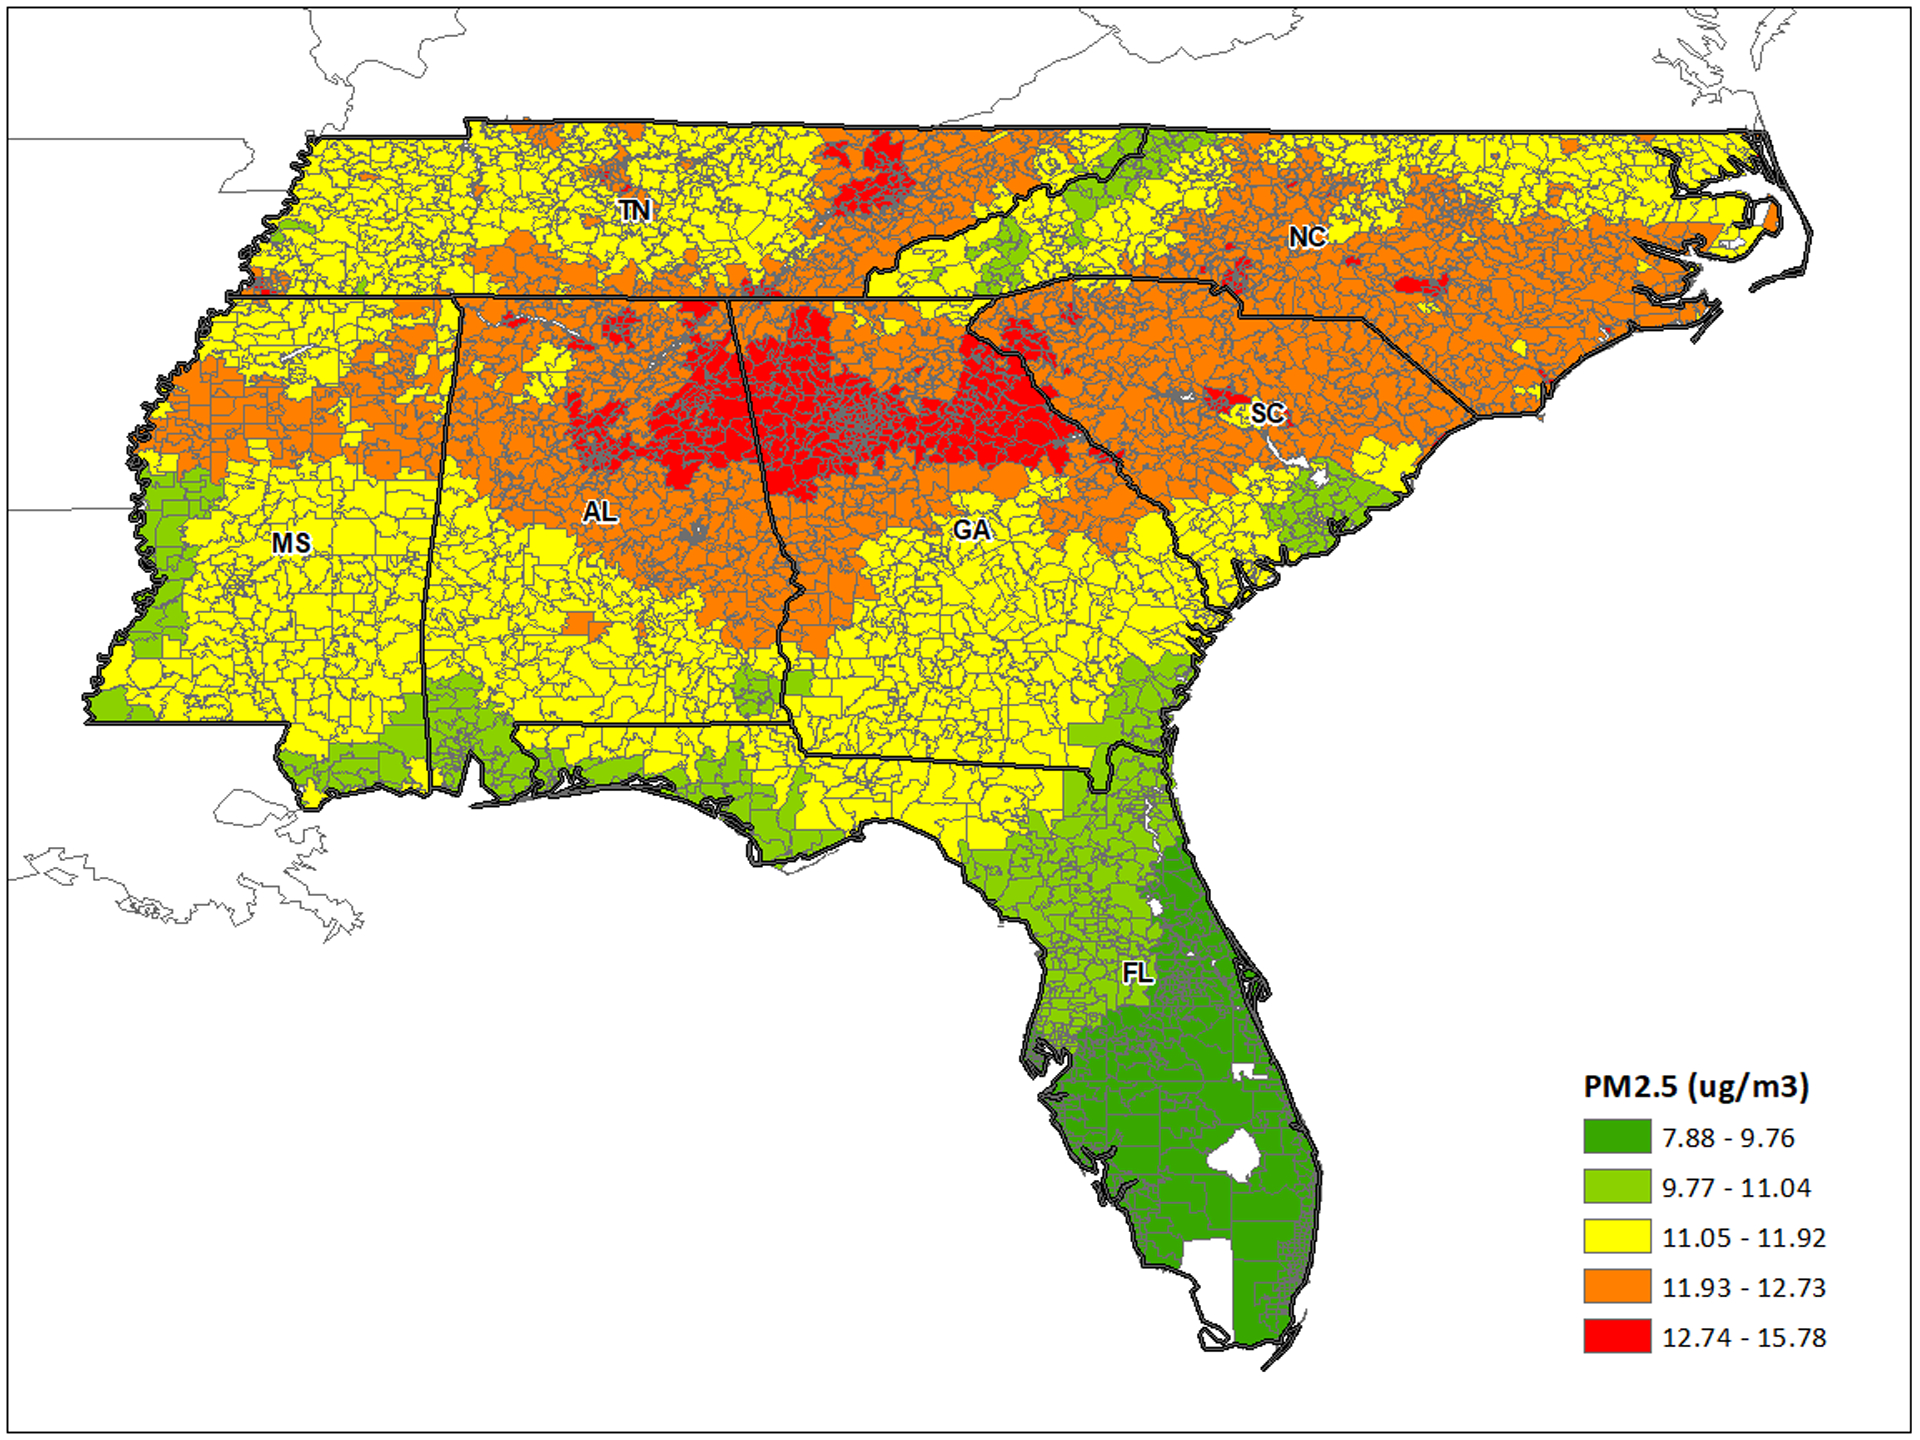
Spatial distribution of PM2.5 by Zip Code
In the total follow-period of 94,045,403 person-years, 1,409,599 hospitalizations related to dementia occurred, at an average age of 82.2 years. A total of 3,564,780 deaths occurred from 2000 through 2013 including 374,201 deaths after or upon hospitalization with dementia. Table 2 shows the associated increase in hospitalization with dementia with increased annual PM2.5 level. The risk of dementia was increased by about 5% per 1 μg/m3 increase in annual PM2.5 level, (hazard ratio [HR], 1.049; 95% confidence interval [CI], 1.048 to 1.051). The response differed by the sub-category of dementia. The HR of Alzheimer’s disease was 1.060 (95% CI, 1.057 to 1.062) and that of vascular dementia was 1.086 (95% CI, 1.082 to 1.090).
Table 2.
Association between the PM2.5 and hospitalization with dementia.
| N (%) | Hazard Ratioa (95% CI) | |
|---|---|---|
| All Dementia | 1,409,599 (100) | 1.049 (1.048, 1.051) |
| Alzheimer’s | 571,652 (40.6) | 1.060 (1.057, 1.062) |
| Vascular | 157,926 (11.2) | 1.086 (1.082, 1.090) |
| Others | 680,021 (48.2) | 1.045 (1.043, 1.046) |
Abbreviations: CI, confidence interval
per 1 μg/m3 increase in annual PM2.5 concentration
Adjusted for age, sex, race, Medicaid eligibility, educational attainment at the Zip Code level, and U.S. state of address
There were differences in relation between PM2.5 and dementia by level of urbanization (Fig. 2). The hazard ratio of dementia related to annual PM2.5 increased as the Zip Code area fell in a more urbanized area. The risk was lower in rural Zip Code areas (HR, 1.036; 95% CI, 1.031 to 1.041) than those in metropolitan areas (HR, 1.052; 95% CI, 1.050 to 1.054). Compared to results in a dashed line that used discrete PM2.5 data from the monitoring stations, hazard ratios showed stronger effects in all regions.
Figure 2.

Difference in PM2.5 effects by level of urbanization.
Table 3 shows our analyses were robust to the change in exposure metric and more strict definition of study population, and exposure time window. When the records from the ground monitoring stations were used as exposure, the size of the effect decreased but was still statistically significant, without any change in the direction of estimates. When the study population was limited only to those who entered the study at the age of 65 (no late entry), the hazard ratios increased, but the order of magnitude remained the same. When data were confined only to those who entered the study at the age of 65 since 2005 to examine the much longer exposure time window of 5 years, the results rather strengthened. All of the results were statistically significant at the α=0.05 level.
Table 3.
Hazard Ratioa for hospitalization with dementia by outcome ascertainment, exposure metric, and time window.
| Entry at Age 65 | Monitor-based | 5 Yearsb | |
|---|---|---|---|
| All dementia | 1.074 (1.071, 1.077) | 1.028 (1.027, 1.029) | 1.091 (1.083, 1.099) |
| Alzheimer’s | 1.114 (1.108, 1.120) | 1.037 (1.036, 1.039) | 1.108 (1.093, 1.124) |
| Vascular | 1.106 (1.098, 1.114) | 1.044 (1.041, 1.047) | 1.154 (1.134, 1.175) |
| Others | 1.066 (1.063, 1.070) | 1.025 (1.024, 1.026) | 1.082 (1.074, 1.091) |
Abbreviations: CI, confidence interval
per 1 μg/m3 increase in annual PM2.5 concentration
Five-years of moving average
Adjusted for age, sex, race, Medicaid eligibility, educational attainment at the Zip Code level, and U.S. state of address
Discussion
In this study, we assessed an association between long term exposure to PM2.5 and dementia hospitalizations in the Southeastern United States from 2000 through 2013. The extensive and population-level study was enabled by the improved exposure metric, spatiotemporally and temporally continuous data on the PM2.5 concentration.
As a result, we found that long-term exposure to PM2.5 is associated with an increase in hospitalization with dementia. Our finding is consistent with previous studies7,8,14,34–36, especially with large-scale studies. In a similar study from the same population in the New England region, Kioumourtzoglou et al.7 reported a hazard ratio of dementia as 1.08 (95% CI, 1.05 to 1.11) per 1 μg/m3 increase in annual average PM2.5. It would be reasonable to compare that result with one for the metropolitan areas that used monitoring stations as an exposure metric to make the results more comparable, which is 1.053 (95% CI, 1.052 to 1.053). Chen et al.34 also analyzed 6.6 million adults and reported the hazard ratio of dementia was 1.07 (95% CI, 1.06 to 1.08) for living within 50 m of a major road compared to more than 300 m distant.
PM2.5 is thought affect neurodegeneration through various pathways, directly or indirectly. PM2.5 may penetrate and be deposited in the brain through the olfactory nerves37 and cause defects in the brain directly causing inflmamation38. Also, it is well established that PM2.5 has detrimental effects on cardiovascular systems1,39. Thus, it can elevate the risk of dementia by increasing cardiovascular disease39–41. Vascular dementia showed the higher hazard ratio, implying an effect modified by cardiovascular conditions.
The adverse health association with PM2.5 increased with level of urbanization. We were also able to quantify this effect in rural areas that have been given less attention. As a Zip Code area is more urban, a stronger PM2.5 effect was observed. The use of discrete PM2.5 data from the monitors underestimated the effect of PM2.5. When they were applied, all of the effect estimates decreased and the difference was most striking in the rural areas. Indeed, the use of continuous PM2.5 data for exposure outperformed the use of discrete PM2.5 data and produced stronger effect estimates in all cases. We speculate that this is because the uncertainties between the monitoring stations and the actual residences were considerably resolved by using the satellite data. Thus, subjects were given a more heterogeneous distribution of PM2.5 than would come from monitoring stations. It is well known that the use of discrete data from ground monitoring stations for exposure in epidemiological studies leads to underestimation of the effect estimates in many cases22. The results from the sensitivity analysis in our study reinforce this theory.
This study has limitations. Medicare records are based on the insurance claims of beneficiaries’ hospitalization, rather than on dementia incidences. That is, patients who were hospitalized for any reason were identified as having dementia once they had any type of ICD-9 codes of dementia. Therefore, the outcome records may not represent all incidences but only capture progressed dementia cases.
Our study population is an open cohort by definition since its membership status may vary by time. Therefore, two possibilities arise. The first is the case where a patient developed dementia before the age of 65. We were limited in our ability to handle issues related with EOD during analyses due to the absence of such data. However, EOD was not our outcome of interest aforementioned since it is perceived separately from LOD42.
The second possibility is where a beneficiary older than 65 developed dementia in other areas than the southeast and then joined Medicare. This is expected to more common than the first possibility, since our study cohort allows staggered entry. In that case, our study would be more of a study about prevalence rather than incidence, which would make our inference weaker. This is also an issue in the perspective of exposure assessment, since late enterers’ exposure history and experience may be different from those who were followed in the study area from the start. During the sensitivity analysis restricted to the subset of population that was followed since the age of 65, we tried to minimize these issues.
Medicare membership status was recorded on a yearly basis, which involves tracking to a new Zip Code if a beneficiary had moved within the study area. Therefore, we could update any change in exposure to PM2.5 accordingly as long as they stayed in the southeastern area.
Another limitation is that exposure was based on Zip Code, not on street address. However, we do not see this as a major concern in our study for two reasons. First, the spatial variation of PM2.5 is moderate at the local level43–45. Moreover, urban areas in the southeastern U.S. have spatial uniformity in PM2.5 concentrations43. Thus the magnitude of error is expected to be low. We are more concerned that exposure to ambient PM2.5 may be affected as the indoor air pollution level can be modified by ventilation systems or the use of air purifiers. However, non-differential exposure measurement error in this study typically leads to bias towards the null, which attenuates the association46–48.
Individual-level data on risk factors for dementia such as smoking or alcohol consumption were not available. Although smoking and alcohol consumption themselves are less likely to be directly related to the ambient PM2.5 levels, they can be associated through other socio-economic status (SES) variables such as income or education. Studies have reported an association between SES and smoking/drinking49–51 and income may affect residence and neighborhood. We tried to controlled for income using a surrogate measurement, Medicaid eligibility. Higher educational attainment is related with a lower risk of dementia as well52. However, we were only able to adjust for it at the community-level due to the absence of such variable at the individual-level.
To the best of our knowledge, this is the first study on the relationship between PM2.5 and dementia that covers the entire population in the extensive region. In doing so, we confirmed an adverse association and achieved estimation for rural areas with less bias. Further research is needed to identify which components of PM2.5 are most associated with dementia.
Acknowledgement
This work was made possible by the support from the NIH grant R01 ES024332-01A1, ES-000002, ES024012, HEI grant 4953-RFA14-3/16-4, and USEPA grants 83587201-0, RD-83479801.
Footnotes
Conflict of Interest: The authors declare that they have no actual or potential conflict of interest.
References
- 1.Dominici F, Peng RD, Bell ML, et al. Fine Particulate Air Pollution and Hospital Admission for Cardiovascular and Respiratory Diseases. JAMA. 2006;295(10):1127. doi: 10.1001/jama.295.10.1127 [DOI] [PMC free article] [PubMed] [Google Scholar]
- 2.Wang Y, Shi L, Lee M, et al. Long-term Exposure to PM2.5 and Mortality Among Older Adults in the Southeastern US. Epidemiology. 2017;28(2):207–214. doi: 10.1097/EDE.0000000000000614 [DOI] [PMC free article] [PubMed] [Google Scholar]
- 3.Lee M, Koutrakis P, Coull B, Kloog I, Schwartz J. Acute effect of fine particulate matter on mortality in three Southeastern states from 2007–2011. J Expo Sci Environ Epidemiol. 2016;26(2):173–179. doi: 10.1038/jes.2015.47 [DOI] [PMC free article] [PubMed] [Google Scholar]
- 4.Hart JE, Puett RC, Rexrode KM, Albert CM, Laden F. Effect Modification of Long‐Term Air Pollution Exposures and the Risk of Incident Cardiovascular Disease in US Women. J Am Heart Assoc. 2015;4(12):e002301. doi: 10.1161/JAHA.115.002301 [DOI] [PMC free article] [PubMed] [Google Scholar]
- 5.Sørensen M, Daneshvar B, Hansen M, et al. Personal PM2.5 exposure and markers of oxidative stress in blood. Environ Health Perspect. 2003;111(2):161–166. [DOI] [PMC free article] [PubMed] [Google Scholar]
- 6.Culqui DR, Linares C, Ortiz C, Carmona R, Díaz J. Association between environmental factors and emergency hospital admissions due to Alzheimer’s disease in Madrid. Sci Total Environ. 2017;592:451–457. doi: 10.1016/j.scitotenv.2017.03.089 [DOI] [PubMed] [Google Scholar]
- 7.Kioumourtzoglou M-A, Schwartz JD, Weisskopf MG, et al. Long-term PM2.5 Exposure and Neurological Hospital Admissions in the Northeastern United States. Environ Health Perspect. 2016;124(1):23–29. doi: 10.1289/ehp.1408973 [DOI] [PMC free article] [PubMed] [Google Scholar]
- 8.Linares C, Culqui D, Carmona R, Ortiz C, Díaz J. Short-term association between environmental factors and hospital admissions due to dementia in Madrid. Environ Res. 2017;152:214–220. doi: 10.1016/j.envres.2016.10.020 [DOI] [PubMed] [Google Scholar]
- 9.Oudin A, Forsberg B, Adolfsson AN, et al. Traffic-Related Air Pollution and Dementia Incidence in Northern Sweden: A Longitudinal Study. Environ Health Perspect. 2016;124(3):306–312. doi: 10.1289/ehp.1408322 [DOI] [PMC free article] [PubMed] [Google Scholar]
- 10.Jung C-R, Lin Y-T, Hwang B-F. Ozone, Particulate Matter, and Newly Diagnosed Alzheimer’s Disease: A Population-Based Cohort Study in Taiwan. J Alzheimers Dis. 2015;44(2):573–584. doi: 10.3233/JAD-140855 [DOI] [PubMed] [Google Scholar]
- 11.Maher BA, Ahmed IAM, Karloukovski V, et al. Magnetite pollution nanoparticles in the human brain. Proc Natl Acad Sci U S A. 2016;113(39):10797–10801. doi: 10.1073/pnas.1605941113 [DOI] [PMC free article] [PubMed] [Google Scholar]
- 12.Block ML, Calderón-Garcidueñas L. Air pollution: mechanisms of neuroinflammation and CNS disease. Trends Neurosci. 2009;2. doi: 10.1016/j.tins.2009.05.009 [DOI] [PMC free article] [PubMed] [Google Scholar]
- 13.Oppenheim HA, Lucero J, Guyot A-C, et al. Exposure to vehicle emissions results in altered blood brain barrier permeability and expression of matrix metalloproteinases and tight junction proteins in mice. Part Fibre Toxicol. 2013;10(1):62. doi: 10.1186/1743-8977-10-62 [DOI] [PMC free article] [PubMed] [Google Scholar]
- 14.Cacciottolo M, Wang X, Driscoll I, et al. Particulate air pollutants, APOE alleles and their contributions to cognitive impairment in older women and to amyloidogenesis in experimental models. Transl Psychiatry. 2017;7:e1022. [DOI] [PMC free article] [PubMed] [Google Scholar]
- 15.Liu C-C, Liu C-C, Kanekiyo T, Xu H, Bu G. Apolipoprotein E and Alzheimer disease: risk, mechanisms and therapy. Nat Rev Neurol. 2013;9(2):106–118. doi: 10.1038/nrneurol.2012.263 [DOI] [PMC free article] [PubMed] [Google Scholar]
- 16.Alzheimer’s Association. 2009 Alzheimer’s disease facts and figures. Alzheimers Dement. 2009;5(3):234–270. doi: 10.1016/j.jalz.2009.03.001 [DOI] [PubMed] [Google Scholar]
- 17.Joint Center for Housing Studies of Harvard University. Housing America’s Older Adults— Meeting the Needs of an Aging Population. Cambridge, MA; 2014. [Google Scholar]
- 18.U.S. Census Bureau. 65+ in the United States: 2010. Washington, DC; 2014. [Google Scholar]
- 19.Koller D, Bynum JPW. Dementia in the USA: state variation in prevalence. J Public Health. 2015;37(4):597–604. [DOI] [PMC free article] [PubMed] [Google Scholar]
- 20.Gorina Y, Kramarow EA. Identifying chronic conditions in Medicare claims data: evaluating the Chronic Condition Data Warehouse algorithm. Health Serv Res. 2011;46(5):1610–1627. doi: 10.1111/j.1475-6773.2011.01277.x [DOI] [PMC free article] [PubMed] [Google Scholar]
- 21.Rossor MN, Fox NC, Mummery CJ, Schott JM, Warren JD. The diagnosis of young-onset dementia. Lancet Neurol. 2010;9(8):793–806. doi: 10.1016/S1474-4422(10)70159-9 [DOI] [PMC free article] [PubMed] [Google Scholar]
- 22.Armstrong BG. Effect of measurement error on epidemiological studies of environmental and occupational exposures. Occup Environ Med. 1998;55(10):651–656. [DOI] [PMC free article] [PubMed] [Google Scholar]
- 23.Lee M, Kloog I, Chudnovsky A, et al. Spatiotemporal prediction of fine particulate matter using high-resolution satellite images in the Southeastern US 2003–2011. J Expo Sci Environ Epidemiol. 2016;26(4):377–384. doi: 10.1038/jes.2015.41 [DOI] [PMC free article] [PubMed] [Google Scholar]
- 24.U.S. Census Bureau. TIGER Products. U.S. Census Bureau. https://www.census.gov/geo/maps-data/data/tiger.html. Published 2017. Accessed May 8, 2017. [Google Scholar]
- 25.U.S. Census Bureau. About Metropolitan and Micropolitan. U.S. Census Bureau. https://www.census.gov/programs-surveys/metro-micro/about.html. Published 2017. Accessed May 8, 2017. [Google Scholar]
- 26.Andersen PK, Gill RD. Cox’s Regression Model for Counting Processes: A Large Sample Study. Ann Stat. 1982;10(4):1100–1120. [Google Scholar]
- 27.Lacombe O, Videau O, Chevillon D, et al. In vitro primary human and animal cell-based blood--brain barrier models as a screening tool in drug discovery. Mol Pharm. 2011;8. doi: 10.1021/mp1004614 [DOI] [PubMed] [Google Scholar]
- 28.McGuinn LA, Ward-Caviness C, Neas LM, et al. Fine particulate matter and cardiovascular disease: Comparison of assessment methods for long-term exposure. Environ Res. 2017;159:16–23. doi: 10.1016/J.ENVRES.2017.07.041 [DOI] [PMC free article] [PubMed] [Google Scholar]
- 29.Wang C, Tu Y, Yu Z, Lu R. PM(2.5) and Cardiovascular Diseases in the Elderly: An Overview. Tchounwou PB, ed. Int J Environ Res Public Health. 2015;12(7):8187–8197. doi: 10.3390/ijerph120708187 [DOI] [PMC free article] [PubMed] [Google Scholar]
- 30.Haring B, Leng X, Robinson J, et al. Cardiovascular Disease and Cognitive Decline in Postmenopausal Women: Results From the Women's Health Initiative Memory Study. J Am Heart Assoc. 2013;2(6). [DOI] [PMC free article] [PubMed] [Google Scholar]
- 31.Justin BN, Turek M, Hakim AM. Heart disease as a risk factor for dementia. Clin Epidemiol. 2013;5:135–145. doi: 10.2147/CLEP.S30621 [DOI] [PMC free article] [PubMed] [Google Scholar]
- 32.RF G, AC S, Zhou Y, al et. Association between midlife vascular risk factors and estimated brain amyloid deposition. JAMA. 2017;317(14):1443–1450. [DOI] [PMC free article] [PubMed] [Google Scholar]
- 33.Schisterman EF, Cole SR, Platt RW. Overadjustment bias and unnecessary adjustment in epidemiologic studies. Epidemiol Camb Mass. 2009;20(4):488–495. doi: 10.1097/EDE.0b013e3181a819a1 [DOI] [PMC free article] [PubMed] [Google Scholar]
- 34.Chen H, Kwong JC, Copes R, et al. Living near major roads and the incidence of dementia, Parkinson’s disease, and multiple sclerosis: a population-based cohort study. The Lancet. 2017;389(10070):718–726. doi: 10.1016/S0140-6736(16)32399-6 [DOI] [PubMed] [Google Scholar]
- 35.Zanobetti A, Dominici F, Wang Y, Schwartz JD. A national case-crossover analysis of the short-term effect of PM2.5 on hospitalizations and mortality in subjects with diabetes and neurological disorders. Environ Health. 2014;13(1):38. doi: 10.1186/1476-069X-13-38 [DOI] [PMC free article] [PubMed] [Google Scholar]
- 36.Power MC, Adar SD, Yanosky JD, Weuve J. Exposure to air pollution as a potential contributor to cognitive function, cognitive decline, brain imaging, and dementia: A systematic review of epidemiologic research. NeuroToxicology. 2016;56:235–253. doi: 10.1016/j.neuro.2016.06.004 [DOI] [PMC free article] [PubMed] [Google Scholar]
- 37.Ostiguy C, Soucy B, Lapointe G, Woods C, Ménard L, Trottier M. Health Effects of Nanoparticles - Second Edition.; 2008.
- 38.Group NW, Akiyama H, Barger S, et al. Inflammation and Alzheimer’s disease. Neurobiol Aging. 2000;21(3):383–421. [DOI] [PMC free article] [PubMed] [Google Scholar]
- 39.U.S. EPA. Final Report: Integrated Science Assessment for Particulate Matter. Washington, DC; 2009. [Google Scholar]
- 40.Brook RD, Rajagopalan S, Pope CA, et al. Particulate Matter Air Pollution and Cardiovascular Disease. Circulation. 2010;121(21):2331 LP - 2378. [DOI] [PubMed] [Google Scholar]
- 41.McCullagh CD, Craig D, McIlroy SP, Passmore AP. Risk factors for dementia. Adv Psychiatr Treat. 2001;7(1):24 LP - 31. [Google Scholar]
- 42.Vieira RT, Caixeta L, Machado S, et al. Epidemiology of early-onset dementia: a review of the literature. Clin Pract Epidemiol Ment Health CP EMH. 2013;9:88–95. doi: 10.2174/1745017901309010088 [DOI] [PMC free article] [PubMed] [Google Scholar]
- 43.Pinto JP, Lefohn AS, Shadwick DS. Spatial variability of PM2. 5 in urban areas in the United States. J Air Waste Manag Assoc. 2004;54(4):440–449. [DOI] [PubMed] [Google Scholar]
- 44.Pohjola MA, Kousa A, Kukkonen J, et al. The Spatial and Temporal Variation of Measured Urban PM10 and PM2.5 in the Helsinki Metropolitan Area. Water Air Soil Pollut Focus. 2002;2(5):189–201. doi: 10.1023/A:1021379116579 [DOI] [Google Scholar]
- 45.Wu H, Reis S, Lin C, Beverland IJ, Heal MR. Identifying drivers for the intra-urban spatial variability of airborne particulate matter components and their interrelationships. Atmos Environ. 2015;112:306–316. doi: 10.1016/J.ATMOSENV.2015.04.059 [DOI] [Google Scholar]
- 46.Bateson TF, Wright JM. Regression Calibration for Classical Exposure Measurement Error in Environmental Epidemiology Studies Using Multiple Local Surrogate Exposures. Am J Epidemiol. 2010;172(3):344–352. doi: 10.1093/aje/kwq123 [DOI] [PubMed] [Google Scholar]
- 47.Rhomberg LR, Chandalia JK, Long CM, Goodman JE. Measurement error in environmental epidemiology and the shape of exposure-response curves. Crit Rev Toxicol. 2011;41(8):651–671. doi: 10.3109/10408444.2011.563420 [DOI] [PubMed] [Google Scholar]
- 48.Armstrong BG. Effect of measurement error on epidemiological studies of environmental and occupational exposures. Occup Environ Med. 1998;55(10):651–656. [DOI] [PMC free article] [PubMed] [Google Scholar]
- 49.Auld MC. Smoking, Drinking, and Income. J Hum Resour. 2005;40(2):505–518. [Google Scholar]
- 50.Collins SE. Associations Between Socioeconomic Factors and Alcohol Outcomes. Alcohol Res Curr Rev. 2016;38(1):83–94. [DOI] [PMC free article] [PubMed] [Google Scholar]
- 51.The Health Consequences of Smoking-50 Years of Progress: A Report of the Surgeon General. Atlanta (GA): Centers for Disease Control and Prevention (US); 2014. [PubMed] [Google Scholar]
- 52.Baumgart M, Snyder HM, Carrillo MC, Fazio S, Kim H, Johns H. Summary of the evidence on modifiable risk factors for cognitive decline and dementia: A population-based perspective. Alzheimers Dement. 2015;11(6):718–726. doi: 10.1016/J.JALZ.2015.05.016 [DOI] [PubMed] [Google Scholar]