Abstract
The Prairie Pothole Region of North America is characterized by millions of depressional wetlands, which provide critical habitats for globally significant populations of migratory waterfowl and other wildlife species. Due to their relatively small size and shallow depth, these wetlands are highly sensitive to climate variability and anthropogenic changes, exhibiting inter- and intra-annual inundation dynamics. Moderate-resolution satellite imagery (e.g., Landsat, Sentinel) alone cannot be used to effectively delineate these small depressional wetlands. By integrating fine spatial resolution Light Detection and Ranging (LiDAR) data and multi-temporal (2009–2017) aerial images, we developed a fully automated approach to delineate wetland inundation extent at watershed scales using Google Earth Engine. Machine learning algorithms were used to classify aerial imagery with additional spectral indices to extract potential wetland inundation areas, which were further refined using LiDAR-derived landform depressions. The wetland delineation results were then compared to the U.S. Fish and Wildlife Service National Wetlands Inventory (NWI) geospatial dataset and existing global-scale surface water products to evaluate the performance of the proposed method. We tested the workflow on 26 watersheds with a total area of 16,576 km2 in the Prairie Pothole Region. The results showed that the proposed method can not only delineate current wetland inundation status but also demonstrate wetland hydrological dynamics, such as wetland coalescence through fill-spill hydrological processes. Our automated algorithm provides a practical, reproducible, and scalable framework, which can be easily adapted to delineate wetland inundation dynamics at broad geographic scales.
Keywords: Wetland hydrology, Inundation, Topographic depressions, Surface water, LiDAR, Google Earth Engine
1. Introduction
The Prairie Pothole Region (PPR) of North America is considered to be one of the most important and productive wetland regions in the world, providing a range of ecological, hydrological, and economic benefits (Gascoigne et al., 2011; Gleason et al., 2011; Tiner, 2015). It covers an area of approximately 750,000 km2, including parts of five states in the north-central U.S. and three provinces in south-central Canada (Fig. 1). This post-glacial landscape is characterized by millions of depressional wetlands, also known as potholes, which are commonly filled with snowmelt and rainwater in the spring. These temporary to semi-permanently inundated wetlands provide critical habitats for globally significant populations of migratory waterfowl and other wildlife species, supporting >50% of migratory waterfowl in North America (Gleason et al., 2011). However, it has been reported that waterfowl populations have declined in the PPR due to wetland drainage resulting from agricultural development and climate-induced drying of wetlands (Dahl, 2014; Johnson and Poiani, 2016; Niemuth et al., 2014). It is estimated that U.S. states that comprise the PPR, including North Dakota, South Dakota, Minnesota, Iowa, and Montana, lost between 32 and 90% of their wetland area between approximately 1850 and 1980 (Dahl, 2014). Most PPR wetlands are small, shallow, and hydrologically closed landscape depressions (Wu, 2018; Wu and Lane, 2016). Therefore, they are highly sensitive to climate variability and anthropogenic impacts, and exhibit related changes in water level, as well as inundated area and distribution. To effectively manage the remaining wetlands, contemporary information about their location, extent, inundation dynamics, and drivers of change is needed. The U.S. Fish and Wildlife Service National Wetlands Inventory (NWI) provides such detail for wetlands across the conterminous United States. However, the geospatial data available through the NWI for this region are outdated, having been largely developed through manual interpretation and digitization of black-and-white aerial photographs acquired in the 1980s (USFWS, 2018). These data were typically produced using one or few image dates and do not reflect inter- or intra-annual wetland dynamics during the past decades (e.g., Dahl, 2014; Johnston, 2013; Wright and Wimberly, 2013).
Fig. 1.
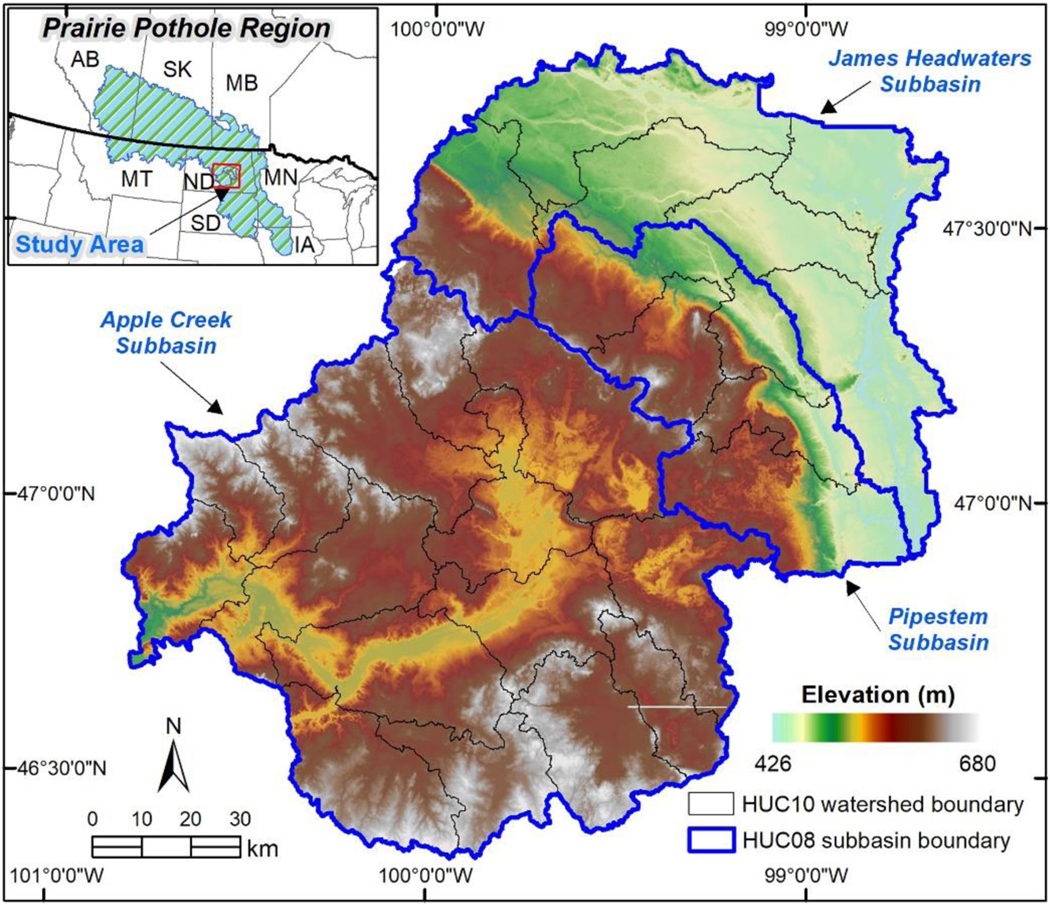
Map of the study area in the Prairie Pothole Region of central North Dakota, including 26 Hydrologic Unit Code 10-digit (HUC-10) watersheds, which constitute three HUC-8 subbasins. The shaded relief was created from a 1-m mosaicked LiDAR DEM of the study area.
In recent years, various attempts have been made to map wetland inundation dynamics in the PPR using remotely sensed images from Earth observation satellites, such as Landsat (DeVries et al., 2017; Vanderhoof et al., 2017, Vanderhoof et al., 2016), Sentinel-1 (Hird et al., 2017; Huang et al., 2018), Sentinel-2 (Hird et al., 2017), Radarsat-1 (Gala and Melesse, 2012), and Radarsat-2 (Bolanos et al., 2016). These moderate spatial resolution satellite images can be used to effectively map PPR wetlands with relatively large areas of inundation. However, accurate mapping of the inundation extent of small wetlands remains a challenge, even using sub-pixel approaches (DeVries et al., 2017; Huang et al., 2018). The median size of PPR wetlands is only 0.16 ha (Huang et al., 2011; Wu and Lane, 2017), which is smaller than the size of two Landsat pixels. Therefore, finer spatial resolution images are essential to map and monitor the broader array of PPR wetlands and characterize their hydrological dynamics, thereby informing their landscape functions (e.g., carbon mineralization, nutrient sequestration, amphibian and waterfowl habitat) (Cheng and Basu, 2017; Downing, 2010; Vanderhoof and Lane, 2019).
The U.S. Department of Agriculture (USDA) established the National Agriculture Imagery Program (NAIP) in 2003 to collect fine spatial resolution aerial imagery over the continental U.S. during the agricultural growing seasons (USDA, 2018). NAIP images are acquired at 1-m resolution with full coverage for the U.S. on a 2–3 year cycle. NAIP imagery is the best freely available data source that offers the finest spatial resolution with multi-temporal complete coverage at the national scale. However, due to the massive computational power needed to process such large-volume datasets, NAIP images have rarely been used for wetland mapping at large geographic scales.
The advent of Google Earth Engine (GEE) makes it possible to access, manipulate, and analyze large volumes of geospatial data on-the-fly (Gorelick et al., 2017). The GEE data catalog contains a large repository of publicly available datasets acquired from various satellite platforms and aerial imaging systems (e.g., Landsat, Sentinel, MODIS, NAIP), which are updated and expanded on a daily basis. To date, GEE-based applications have primarily focused on mapping land-use/land-cover change (e.g., Azzari and Lobell, 2017; Clinton et al., 2018; Hansen et al., 2013; Kennedy et al., 2018; Liu et al., 2018) and surface water dynamics for large water bodies (e.g., Donchyts et al., 2016; Pekel et al., 2016; Tang et al., 2016; Yamazaki and Trigg, 2016), predominantly using Landsat and Sentinel data. Due to the significant challenges involved in mapping wetlands, which often exhibit dramatic intra- and inter-annual changes in water levels and vegetation patterns, large-scale wetland delineation is still an underrepresented component of most environmental mapping and monitoring programs (Hird et al., 2017).
In this paper, we present a fully automated and scalable algorithm for mapping wetland inundation dynamics at the watershed scale using GEE. Our workflow integrated multiple data sources, including readily available NAIP images and global surface water products contained within GEE, publicly available light detection and ranging (LiDAR) data, and the NWI geospatial dataset. We first used unsupervised machine learning algorithms to classify multi-temporal 4-band NAIP images coupled with additional spectral indices (i.e., Normalized Difference Vegetation Index [NDVI] and Normalized Difference Water Index [NDWI]). Then we utilized prior permanent water masks extracted from existing moderate-resolution global surface water products to identify and extract water clusters from the unsupervised classification results of fine spatial resolution NAIP images. We further refined the initial water-cluster images using LiDAR-derived landform depressions. We evaluated the performance of the automated algorithm using NWI geospatial dataset and global surface water products. After generating multi-temporal wetland inundation maps, we quantified and characterized inundation dynamics (2009–2017) within 26 watersheds in the PPR.
2. Materials and methods
2.1. Study area
The study focused on 26 Hydrologic Unit Code 10-digit (HUC-10) watersheds in the Prairie Pothole Region of central North Dakota (Fig. 1). Watershed areas range from 31,800 ha to 99,800 ha, with a total watershed area of 1,657,600 ha. These 26 HUC-10 watersheds constitute three HUC-8 subbasins: the James Headwaters subbasin (#10160001), Pipestem subbasin (#10160002), and Apple Creek subbasin (#10130103). According to the 2011 National Land Cover Database (Homer et al., 2015), the area is dominated by grassland (38%), cultivated crops (36%), and pasture or hay (11%), along with a significant amount of open water (6%) and emergent herbaceous wetlands (5%). As part of the PPR, the study area is characterized by numerous depressional wetlands (see Fig. 2), which not only provide critical habitats for many wildlife species but also have significant impacts on the physical, chemical, and biological integrity of downstream waters (Evenson et al., 2018; US EPA, 2015). Several watersheds within the Pipestem subbasin have recently been used as test sites for various wetland mapping studies (e.g., DeVries et al., 2017; Huang et al., 2018; Vanderhoof et al., 2017; Vanderhoof and Alexander, 2016; Wu and Lane, 2017, Wu and Lane, 2016) and hydrological modeling (e.g., Brooks et al., 2018; Evenson et al., 2016; Hay et al., 2018; Rajib et al., 2018).
Fig. 2.
Examples of depressional wetlands in the Prairie Pothole Region. (a) The study area of 26 HUC-10 watersheds. (b) The Lower Pipestem Creek watershed (#1016000205). (c) The 1-m aerial imagery (acquisition date: August 2017) from the National Agriculture Imagery Program (NAIP) shows numerous depressional wetlands on the landscape. The blue rectangle indicates the areal extent shown in Fig. 3.
2.2. Geospatial datasets
The geospatial datasets used in this study include multi-temporal NAIP imagery, European Commission’s Joint Research Centre (JRC) Global Surface Water products, LiDAR DEMs, and the National Wetlands Inventory geospatial dataset (Table 1). Additional details about each dataset are described below.
Table 1.
A summary of geospatial datasets used in this study.
| Dataset | Acquisition dates | Resolution | Provider | Application |
|---|---|---|---|---|
| NAIP aerial images | Aug 18–Sep 1, 2009 | 1 m | Earth Engine data catalog | Unsupervised classification |
| Jun 29–Jul 10, 2010 | ||||
| Jul 14–Jul 31, 2012 | ||||
| Jul 20–Aug 1, 2014 | ||||
| Sep 26–Sep 27, 2015 | ||||
| Aug 7–Aug 28, 2017 | ||||
| JRC Global Surface Water products | 1984–2015 | 30 m | Earth Engine data catalog | Water masks; results comparison |
| LiDAR DEMs | 2011–2015 | 1 m | Public domain data | Surface depressions |
| National Wetlands Inventory (NWI) | 1980s | 1:24,000 | Public domain data | Results comparison |
Multi-temporal NAIP aerial images, which have been pre-processed to facilitate efficient access, are available for the U.S. in the GEE public data catalog (Gorelick et al., 2017). The NAIP images were acquired at a 1-m ground sample distance (GSD) with a horizontal accuracy that lies within 5-m of ground control points (USDA, 2018). Each NAIP imagery consists of four bands: red (600–700 nm), green (500–600 nm), blue (400–500 nm), and near infrared (800–900 nm). In this study, we selected all available 4-band NAIP images for the study area. These images span six periods (i.e., 2009, 2010, 2012, 2014, 2015, and 2017), which were acquired during the agricultural growing season from June to September (see Table 1). NAIP imagery is available across the entire study area for these six years. The multi-temporal NAIP images for the blue zoom-in area in Fig. 2c are presented in Fig. 3, which clearly illustrate the dynamic changes in wetland inundation extent resulting from fill-merge-spill hydrological processes. Multi-temporal NAIP aerial images were the primary dataset used for delineating wetland inundation dynamics through unsupervised classification.
Fig. 3.
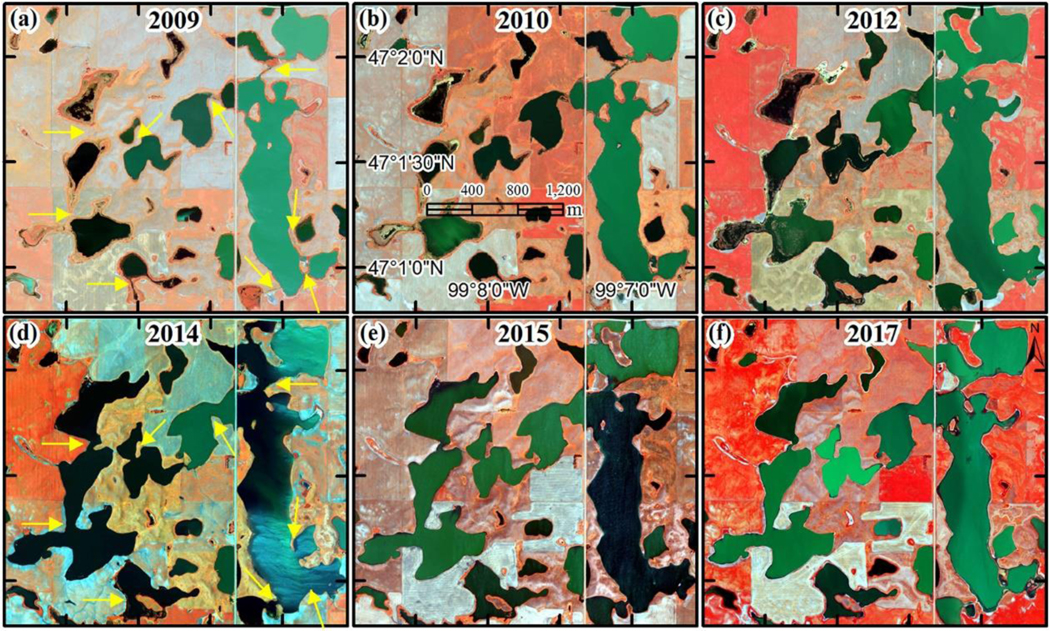
Multi-temporal NAIP aerial images (2009–2017), illustrating dynamic changes in wetland inundation extent resulting from fill-merge-spill hydrological processes in the Prairie Pothole Region. Each image is a false-color composite using the band combination of near-infrared (N), red (R), and green (G). The yellow arrows in (a) and (d) are pointing at locations where wetland merging occurred.
There are two global scale Landsat-derived surface water products currently available in the GEE public data catalog. These include the Global Inland Water dataset from the 2000 epoch (Feng et al., 2016) and the JRC Global Surface Water products (Pekel et al., 2016). The JRC products were generated using over 3 million scenes from Landsat Thematic Mapper (TM), Enhanced Thematic Mapper Plus (ETM+), and Operational Land Imager (OLI) acquired between March 1984 and October 2015. In this study, we used two JRC Global Surface Water products, including the Surface Water Occurrence and Monthly Water History. The Surface Water Occurrence product measures the frequency of water occurrence on the Earth’s surface in monthly time-steps over the entire 32-year period. To compute surface water occurrence, the total number of water detections was divided by the total number of valid observations for the same month (e.g., March 1984, March 1985, and so on) to represent the frequency of water occurrence in that month (e.g., March). Averaging the results of all monthly frequencies of water occurrence gives the long-term overall surface water occurrence (Pekel et al., 2016). The resulting surface water occurrence product is a global-scale raster dataset at a 30-m resolution with pixel values ranging from 0% to 100%. Some locations are always classified as water throughout the entire 32-year period (i.e., frequency = 100%), others are classified as water for a few months of every year (i.e., 0% < frequency < 100%), and some have never been classified as water (i.e., frequency = 0%). In this study, we used the JRC Surface Water Occurrence product to select locations with a high frequency (≥ 90%) of water occurrence as prior water masks, which were further used to extract water clusters from the NAIP unsupervised classification results.
The JRC Monthly Water History product includes the entire history of water detection on a monthly basis. The product contains 380 images, one for each month between March 1984 and October 2015 (Pekel et al., 2016). We used the JRC Monthly Water History images near-coincident with NAIP acquisitions over the study area (see Table 1) to evaluate the wetland inundation maps.
Since fine spatial resolution LiDAR data for the United States do not yet exist in the GEE public data catalog, we obtained the 1-m resolution LiDAR data for our study area from the North Dakota LiDAR Dissemination Service (https://lidar.swc.nd.gov/, accessed 17 September 2018) and uploaded the data to GEE. The LiDAR data were acquired through multiple LiDAR data acquisition campaigns in North Dakota between 2011 and 2015, with a nominal point spacing of 0.7 m and an estimated vertical accuracy of 15 cm. In this study, the LiDAR data were primarily used to delineate surface depressions, which were further used to refine water clusters extracted from the NAIP unsupervised classification results.
The NWI geospatial data for the Prairie Pothole Region were developed through manual interpretation and digitization of black-and-white aerial photographs from the 1980s (Cowardin et al., 1979; USFWS, 2018). Although the NWI data contain information about historical inundation periodicity (i.e., NWI water regimes), this information may not be current and were developed using expert interpretation of single-date imagery. Nevertheless, the NWI dataset is still the most spatially and categorically detailed wetland inventory for the entire U.S. In this study, we used the NWI as reference data to evaluate the changes in wetland inundation extent since the 1980s.
2.3. Automated algorithm for wetland inundation mapping
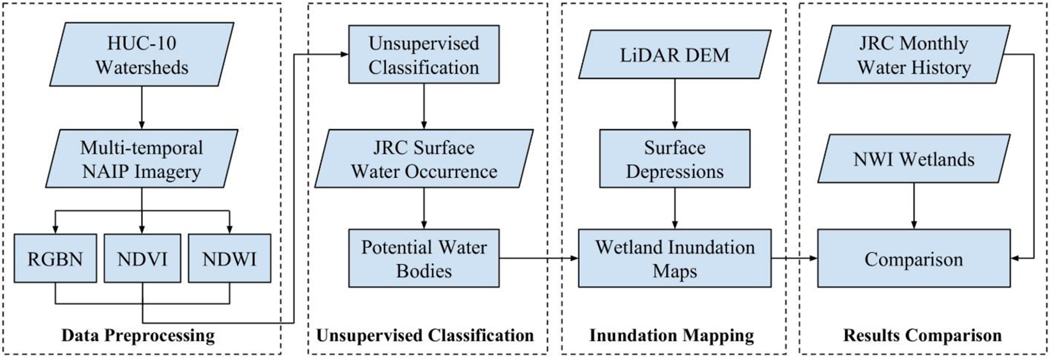
The fully automated algorithm we developed for wetland inundation mapping consists of four steps (Fig. 4): (1) preprocessing of multi-temporal NAIP imagery; (2) unsupervised classification of NAIP imagery and extraction of potential water bodies; (3) refinement of wetland inundation extent using LiDAR-derived surface depressions; and (4) comparison of wetland inundation maps using coincident JRC Monthly Water History product and NWI geospatial dataset.
Fig. 4.
Automated algorithm for wetland inundation mapping using multi-temporal aerial imagery and LiDAR data within Google Earth Engine.
2.3.1. Data preprocessing
Given the very high level of computational and memory resources needed to process multi-temporal fine spatial resolution NAIP images and LiDAR data, we developed the algorithm to run at the HUC-10 watershed scale on the GEE platform. In total, there are 18,487 HUC-10 watersheds in the entire U.S. with watershed areas ranging from 10,100 ha to 100,000 ha. In the GEE Code Editor web interface, the user can click on the map to select any HUC-10 watershed within the study area. Our algorithm will then execute automatically to retrieve and clip all geospatial datasets to the selected watershed for delineating wetland inundation extent. These datasets include multi-temporal NAIP images, LiDAR DEMs, JRC Global Surface Water Occurrence, JRC Monthly Water History, and NWI (see Table 1). Note that NAIP images in GEE are stored as image tiles - Digital Orthophoto Quarter Quadrangle (DOQQ), covering an area of 7.5-minute longitude by 7.5-minute latitude. The 4-band NAIP image tiles covering the selected watershed are obtained to create yearly mosaicked NAIP imagery. On average, 23 NAIP image titles are needed to cover one HUC-10 watershed, with a total of 590 tiles needed to cover the entire study area. For our 26 studied watersheds in the PPR, there were six years with 4-band NAIP images available, including 2009, 2010, 2012, 2014, 2015, and 2017. For each mosaicked NAIP image, two additional indices calculated from spectral bands are added to the image, including the Normalized Difference Water Index [NDWI] (McFeeters, 1996) and Normalized Difference Vegetation Index [NDVI] (Tucker, 1979). This results in multi-temporal 6-band NAIP images to be used for unsupervised classification.
2.3.2. Unsupervised classification
Previous studies commonly used unsupervised classification as an initial step prior to supervised classification, which is called hybrid classification (e.g., Lane et al., 2014). An unsupervised approach was used to classify NAIP images, which is transferable and applicable to other study areas without the need for collecting coincident training data. We used the k-means unsupervised learning algorithm (Arthur and Vassilvitskii, 2007) available on GEE. The only required parameter for the k-means unsupervised learning algorithm is the number of clusters, which is set to five. The algorithm is applied to classify each mosaicked watershed-scale NAIP image with six bands, including red, green, blue, near-infrared, NDWI, and NDVI. This procedure is repeated until all multi-temporal NAIP images for the selected watershed are successfully classified.
After generating an output image in which each pixel is assigned to one of the five clusters using unsupervised classification, we separated water clusters from non-water clusters. Due to the spectral heterogeneity of water in fine spatial resolution aerial imagery, the number of clusters belonging to water varies from image to image, which poses a challenge for the automated workflow. This problem can be caused by various driving factors, such as turbidity, water algae content, the angle between the sun and the sensor, and sun glint resulting from specular reflection of solar radiation on non-flat water surfaces (Hedley et al., 2005). These driving factors can strongly influence the visual appearance and image classification of water. To overcome this challenge and automatically extract variable water clusters from the unsupervised classification results, we used the 30-m JRC Global Water Occurrence product to generate permanent water masks.
The JRC Global Water Occurrence product is a single-band global-scale raster dataset at 30-m resolution with pixel values ranging from 0% to 100% (see Fig. 5a). Each pixel value represents the percent frequency of that pixel being detected as water during the entire 32-year period (1984–2015). Following Huang et al. (2018), we applied a threshold of 90% to the JRC Global Water Occurrence product to derive a ‘permanent water’ mask (see Fig. 5b). If a location was frequently (≥ 90%) detected as water between 1984 and 2015, we can reasonably assume that there is a high probability that it would still be water during our study period (2009–2017). We performed an overlay analysis to extract unsupervised classification pixels located within this ‘permanent water’ mask. Based on the extracted subset of the classified image, we identified which clusters were dominant classes representing water. Since the extracted subset image might contain some misclassified pixels, a threshold of 10% was used to eliminate minority clusters. In other words, if a cluster took up <10% of the total area of the image extracted by the JRC ‘permanent water’ mask, it was eliminated. The values of dominant clusters were used to extract pixels from the NAIP unsupervised classification results, which represent potential water areas derived from NAIP imagery.
Fig. 5.
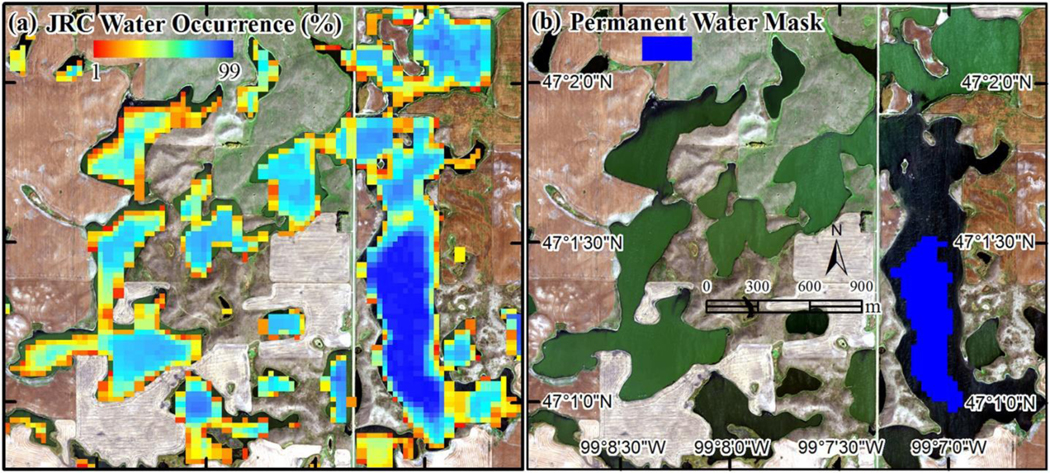
An example of the European Commission’s Joint Research Centre (JRC) Global Surface Water Occurrence product. (a) The frequency of Landsat-derived water occurrence over the entire 32-year period (1984–2015) with values ranging from 1% to 100%. Non-water pixels are masked out. (b) Permanent water mask extracted using a 90% threshold (i.e., occurrence ≥ 90%). The background NAIP imagery was acquired in September 2015.
2.3.3. Refining wetland inundation extent
After the automated extraction of water clusters from the unsupervised classification results, we removed pixels misclassified as water, such as those that are shadows from trees, buildings, and other topographic features, using topographic data. Fine spatial resolution LiDAR data, including LiDAR intensity imagery and LiDAR-derived DEMs, have proven useful for delineating depressional wetlands, such as vernal pools (Wu et al., 2014), prairie potholes (Wu, 2018; Wu and Lane, 2016), and forested wetlands (Lang et al., 2013; Vanderhoof et al., 2018). In this study, LiDAR data were used to delineate surface depressions using an efficient depression-filling algorithm (Wu et al., 2018), which can delineate and quantify nested depressions in DEMs using a level-set method based on graph theory. By emulating water level decreasing from the spill point at the depression boundary to the lowest point within a depression, the level-set method traces dynamic topological changes (i.e., depression splitting) and constructs a topological hierarchy for representing nested depressions. Using the delineated surface depressions as a mask, pixels of water clusters located within the depression mask were extracted. In this way, misclassified pixels resulting from various sources of shadows (i.e., trees, buildings, terrain) that are not part of a depression (i.e., without surface water holding capacity) can be effectively eliminated (Fig. 6).
Fig. 6.
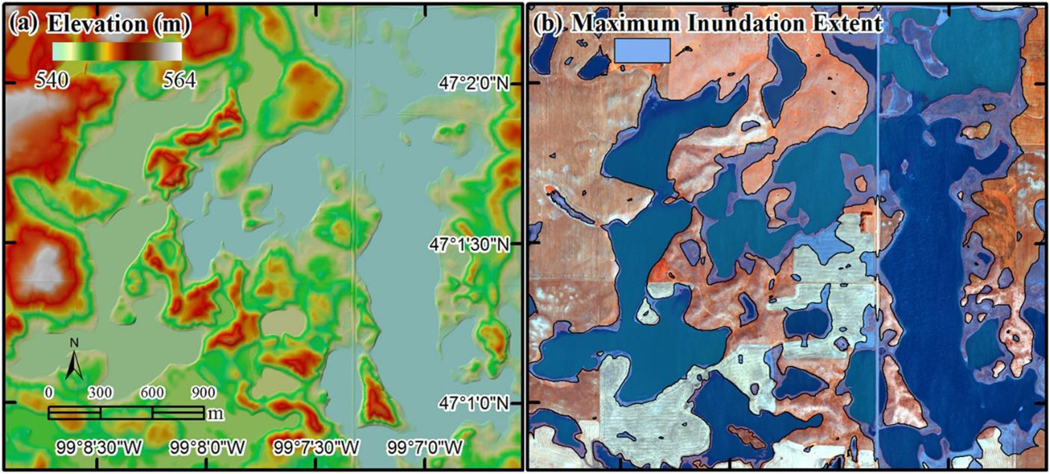
Examples of LiDAR-derived surface depressions in the study area. (a) A shaded relief map created from a 1-m LiDAR DEM. (b) LiDAR-derived surface depressions overlaid on NAIP imagery (acquisition date: September 2015).
2.3.4. Comparison of wetland inundation maps
Previous studies on mapping wetland inundation extent based on moderate-resolution satellites (e.g., Landsat, Sentinel-1, Sentinel-2) commonly used fine spatial resolution NAIP aerial imagery to validate mapping results when coincident ground truth reference data were unavailable (e.g., Huang et al., 2018; Vanderhoof and Alexander, 2016). This study represents one of the first times multi-temporal NAIP imagery and LiDAR data have been used to map wetland inundation extent at large geographic scales on the GEE cloud-computing platform. It is challenging to verify the accuracy of wetland inundation maps created as part of this study due to the unavailability of coincident field data and finer resolution (sub-meter) satellite or airborne imagery in the public domain. In the absence of fine resolution reference inundation maps and ground truth data, we utilized 30-m resolution JRC Monthly Water History product to calculate omission error. However, it was much more challenging to calculate commission error due to the inability of JRC product to capture small sub-hectare water bodies. Specifically, each NAIP-derived inundation map was compared to the coincident JRC Monthly Water History product. For each time period, if the acquisition dates of NAIP imagery within a watershed spanned multiple months (see Table 1), the corresponding months of the JRC Monthly Water History product were combined to generate a single reference image. In addition, we compared the NAIP-derived inundation maps to the NWI geospatial dataset to analyze inundation changes since the 1980s.
2.3.5. Algorithm source code and data access
We implemented the automated workflow for mapping wetland inundation dynamics using GEE. The source code and documentation for the GEE implementation can be found at https://gishub.org/2018-RSE-GEE (accessed 17 September 2018). In addition, we have made all datasets used in this study available to the public. The nationwide multi-temporal NAIP aerial imagery and JRC Global Surface Water products are available in the GEE public data catalog. The National Wetlands Inventory by HUC-8 watershed for the entire U.S. and LiDAR data for the 26 studied watersheds in the PPR have been uploaded and ingested into GEE for rapid access. More information on how to access these datasets can be found at the URL provided above. Users are encouraged to upload their own LiDAR data and utilize the existing national-scale datasets to test our automated workflow in other study areas.
3. Results
3.1. Permanent water masks and LiDAR-derived surface depressions
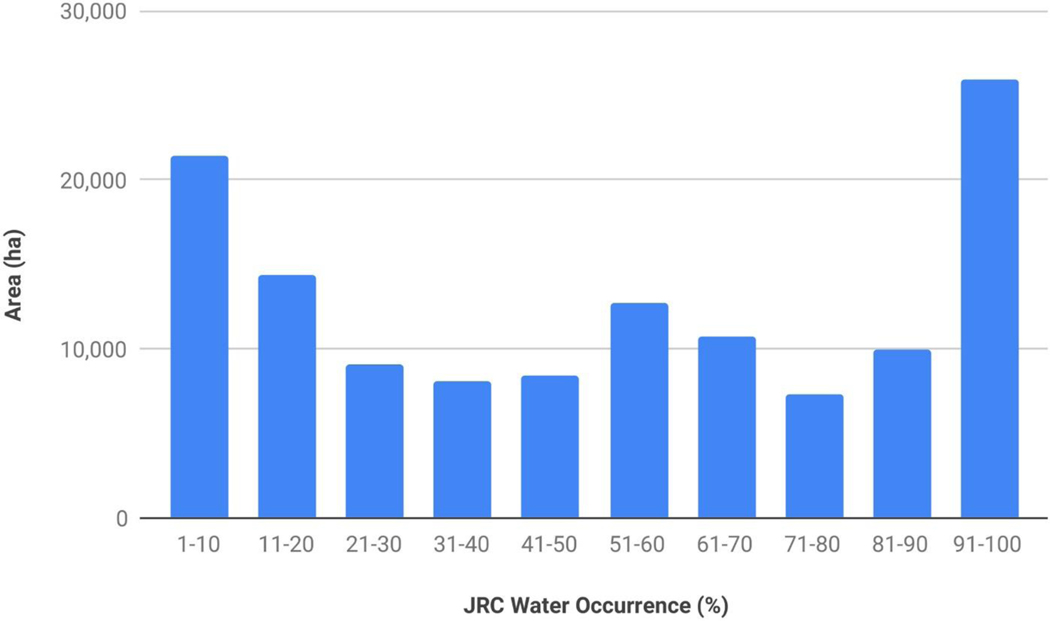
A small subset of the JRC Water Occurrence product for the study area is shown in Fig. 5a. Each pixel value represents the percent time inundation was detected for that pixel during the entire 32-year period with valid Landsat observations. The total area of JRC Water Occurrence in our study area was 128,081 ha, covering 7.7% of the total watershed area. The area composition of the JRC Water Occurrence within our study area is shown in Fig. 7. This figure illustrates ephemeral/seasonal inundation dynamics within wetlands in the PPR. Approximately 35,816 ha (27.9%) of the JRC water pixels had occurrence values less than or equal to 20% (see the aggregated area of the first two bars shown in Fig. 7). In contrast, 25,890 ha (20.2%) of the JRC water pixels had occurrence values > 90%, which were extracted as a permanent water mask to facilitate the extraction of water clusters from the NAIP unsupervised classification results. The frequency of the remaining water occurrence pixels (i.e., 20% < occurrence ≤ 90%) was relatively uniform, with a slight jump in water occurrence within the 51–70% range.
Fig. 7.
Histogram of JRC Surface Water Occurrence in the study area.
Using the depression-filling algorithm (Wu et al., 2018), 377,600 ha of the study area was identified as surface depressions, indicating that 22.8% of the study area is likely to be inundated under a fully flooded condition. In total, there were 20,287 depressions larger than 1 ha. The LiDAR-derived surface depressions were used to refine the initial water clusters extracted from the NAIP unsupervised classification results. By applying the LiDAR depression mask, the percentage area (i.e., non-depression pixels) removed from the initial water clusters during the six time periods ranged from 7.68% to 15.42%, with an average of 11.37%.
3.2. Comparison with JRC Monthly Water History product
There are six dates of 4-band NAIP images available for our study area between 2009 and 2017 (see Table 1). Each NAIP-derived inundation map (2009–2015) at the watershed scale was compared to the coincident Landsat-derived surface water extent extracted from the JRC Monthly Water History product. The NAIP-derived inundation map of 2017 was not included in the comparison due to the unavailability of coincident JRC Monthly Water History product. A comparison of the inundation maps for a small subset area of the Lower Pipestem Creek (see the blue rectangle in Fig. 3c) is presented in Fig. 8. Compared with the inundation map (Fig. 8a) derived from NAIP imagery (September 2015), the coincident Landsat-derived surface water extent (Fig. 8c) extracted from the JRC Monthly Water History slightly underestimated the inundation extent due to the limited scale (30-m). The majority of the omitted inundation pixels were found around the edges of wetland features. In addition, the JRC product largely failed to capture small sub-hectare wetland features (see the red arrows in Fig. 8c). The NWI polygons (Fig. 8d) developed for this region through manual interpretation and digitization of black-and-white aerial photographs do not reflect contemporary inundation status. NWI polygons were likely created during a drier period and thus substantially underestimated current inundation extent. Many previously disjoint NWI wetlands appeared to have merged to form larger wetland complexes (see Fig. 8a and d). The map of water occurrence (i.e., the number of times of water detection at each pixel during the six time periods of NAIP imagery) shown in Fig. 8b further illustrates the dynamic nature of wetland inundation in the Prairie Pothole Region (see Fig. 3).
Fig. 8.
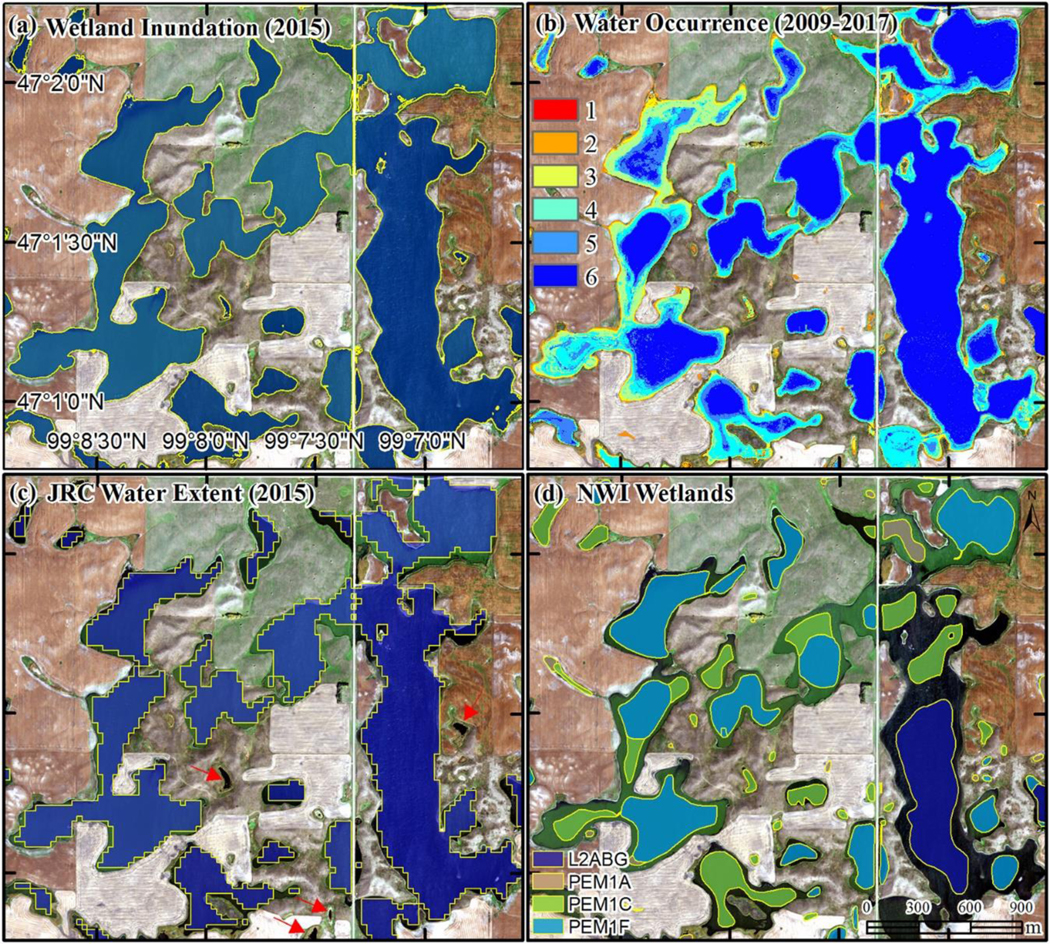
Comparison of wetland inundation maps. The background NAIP imagery was acquired in September 2015. (a) Wetland inundation extent derived from NAIP imagery (September 2015) and LiDAR data using our automated algorithm is depicted by the yellow lines. (b) Wetland inundation frequency derived from multi-temporal NAIP imagery (2009–2017) and LiDAR data using our automated algorithm. (c) JRC Monthly Water History (September 2015) derived from Landsat data is depicted by the yellow lines. The red arrows are pointing at small wetland features, which the JRC product failed to capture. (d) National Wetlands Inventory (NWI) geospatial dataset derived from aerial photographs acquired in the 1980s. NWI wetland classification code: palustrine (P), emergent (EM), persistent (1), temporary flooded (A), seasonally flooded (C), semi-permanently flooded (F), lacustrine (L), littoral (2), aquatic bed (AB), and intermittently exposed (G).
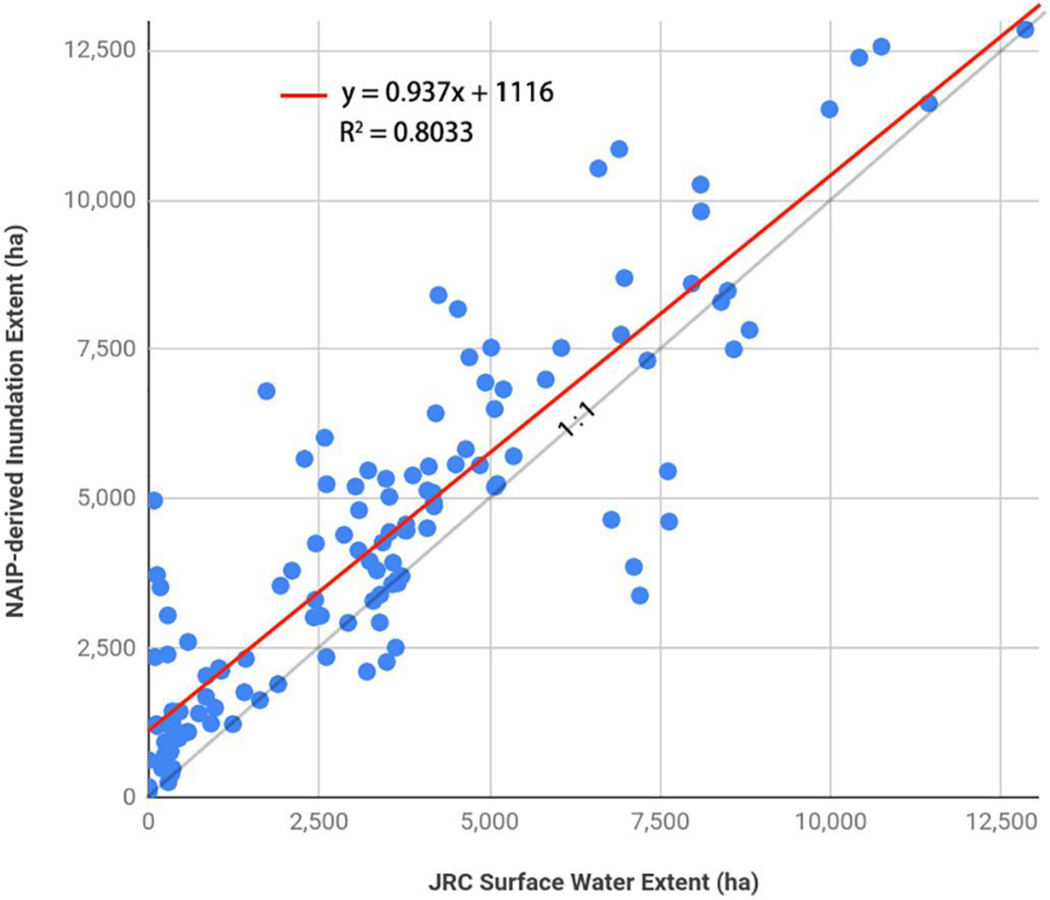
A quantitative comparison of the NAIP-derived inundation maps from our automated algorithm to the Landsat-derived JRC surface water extent at the watershed scale is presented in Fig. 9. It can be seen that most points fall above the diagonal line, indicating that JRC surface water extent largely underestimated the inundation extent of each watershed. The aggregated inundation extent in the study area derived from our algorithm and the coincident JRC surface water extent for each time period is presented in Table 2. For all the time periods (2009–2015), the total inundation extent derived from NAIP imagery is consistently higher than that from the JRC surface water product based on Landsat data, which can be attributed to the superior capability of NAIP imagery in capturing small wetland features.
Fig. 9.
Comparison between NAIP-derived and Landsat-derived JRC surface water extent at the HUC-10 watershed scale in the study area. Each point represents the inundation area of an individual watershed derived from one-time NAIP imagery (e.g., September 2015) and coincident JRC Monthly Water History. In the study area, there are five time periods (2009–2015) of NAIP images with coincident JRC Monthly Water History (see Table 1), resulting in a total of 130 points being plotted in this figure.
Table 2.
Comparison of total inundation area and omission error between NAIP-derived and Landsat-derived surface water extent within the 26 watersheds of the study area.
| 2009 | 2010 | 2012 | 2014 | 2015 | Average | |
|---|---|---|---|---|---|---|
| Landsat-derived JRC surface water extent (ha) | 75,052 | 83,299 | 79,682 | 91,120 | 89,792 | 83,789 |
| NAIP-derived inundation extent (ha) | 79,873 | 96,416 | 106,629 | 111,509 | 92,546 | 97,394 |
| Initially omitted inundation extent (ha) | 8070 | 10,771 | 6936 | 8338 | 7245 | 8272 |
| Refined omitted inundation extent (ha) | 2680 | 5381 | 1546 | 2947 | 1855 | 2882 |
| Omission error (%) | 3.57% | 6.46% | 1.94% | 3.23% | 2.07% | 3.45% |
To further assess of the performance of our method, we conducted a pixel-by-pixel comparison of the inundation maps to identify wetland features, which were omitted by our method but were captured in the JRC surface water products. Initially, the total omitted inundation extent of the study area ranged from 6936 ha to 10,771 ha, with an average of 8272 ha (see Table 2). By visually assessing these omitted wetland features, we found that the initial high omission errors were largely due to the omission of three large lakes (see Fig. 10), which constituted a total area of 5390 ha. Our method failed to capture these three large lakes because they spanned across watershed boundaries. As a result, they were not detected as surface depressions using the depression identification algorithm on the LiDAR DEM of a single watershed. Despite the fact that they were successfully labeled as water clusters during the process of unsupervised classification, these three lakes were later eliminated during the refining process using LiDAR-derived surface depressions. To avoid large water bodies being cut off at the watershed boundary and thus not being detected as surface depressions, we re-ran the depression identification algorithm at the HUC-8 subbasin scale. As a result, the three large lakes initially omitted were successfully delineated, which substantially reduced the averaged omitted inundation extent to 2882 ha, with an average omission error of 3.45%.
Fig. 10.
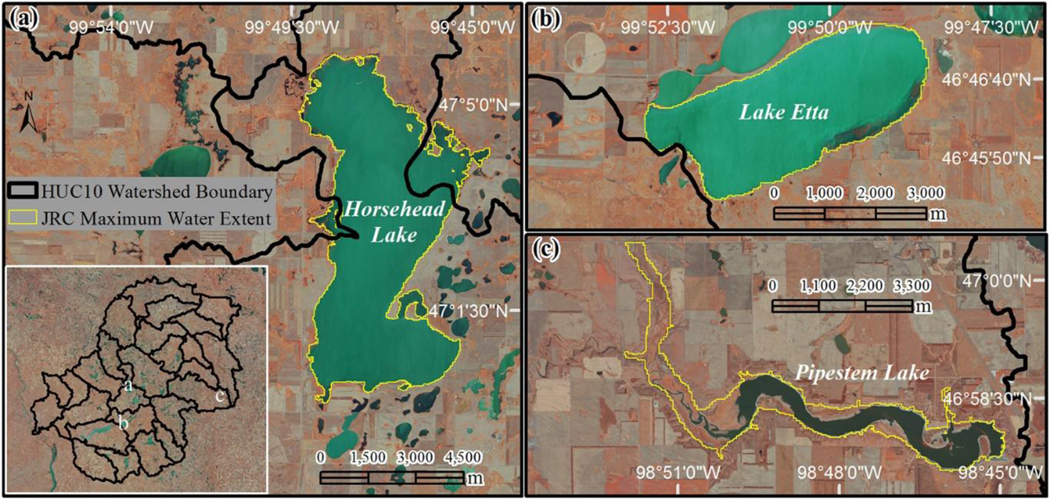
The three largest omission errors resulting from the intersection of depression and watershed boundaries. The area of these three omitted features was 3506 ha, 837 ha, and 1047 ha respectively.
3.3. Comparison with JRC Surface Water Occurrence product
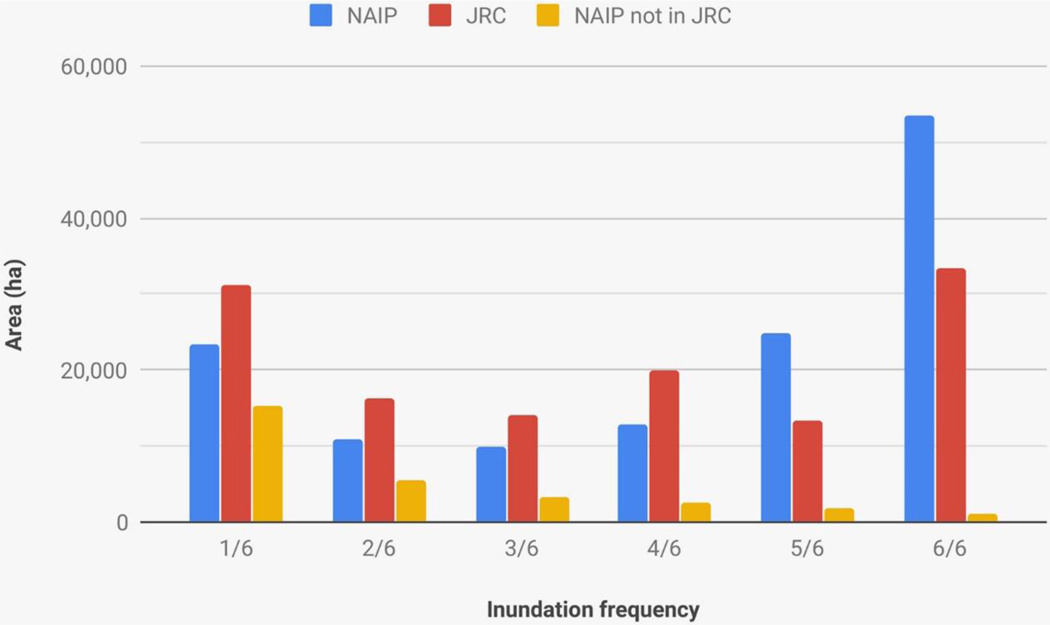
The JRC Surface Water Occurrence product measures the percent frequency of water occurrence over the 32-year period (1984–2015) with pixel values ranging from 1% to 100%. Similarly, our NAIP-derived water occurrence product measures the frequency of water occurrence over the six time periods (2009–2017) with pixel values ranging from 1 to 6. The total area of JRC Water Occurrence in our study area was 128,081 ha, covering 7.7% of the total watershed area. In contrast, the total area of NAIP-derived water occurrence in our study area was 135,271 ha, covering 8.2% of the total watershed area. To compare these two water occurrence products with a different value range, we first reclassified the JRC water occurrence map into six inundation classes by evenly subdividing the value range (i.e., 1–16%, 17–33%, 34–50%, 51–66%, 67–83%, 84–100%). Then, we calculated the inundation area of each class and compared it to the inundation area of the corresponding NAIP-derived water occurrence class (see Fig. 11). Due to the limited temporal frequency, NAIP imagery acquired during the summer season could not capture temporary water bodies existing only in the spring season after snowmelt and rainwater, resulting in lower inundation areas in the first four classes compared to the longer time-series JRC water occurrence product (Fig. 11). Nevertheless, NAIP imagery successfully captured many small sub-hectare water bodies that the JRC product failed to map due to the limited spatial resolution of Landsat data. In total, 29,825 ha (22%) of the NAIP-derived inundation areas in the study area were not captured in the JRC product (see the yellow bar in Fig. 11). These unmapped areas by the JRC product were largely composed of small sub-hectare water bodies and pixels surrounding edges of large water bodies.
Fig. 11.
Comparison of inundation frequency derived from 1-m resolution NAIP imagery (2009–2017) and 30-m resolution JRC Surface Water Occurrence product (1984–2015) for the study area. The yellow bar presents inundation area captured by NAIP imagery but not by Landsat-derived JRC product.
3.4. Comparison with NWI geospatial dataset
The NWI geospatial dataset was used for results comparison. The wetland types in the NWI dataset include palustrine emergent, forested, scrub-shrub, and pond wetlands, as well as lacustrine and riverine wetlands, and lacustrine and riverine deepwater habitats. In this study, we focused on depressional landscape features. Therefore, riverine features were excluded from subsequent analysis. In total, there were 214,193 NWI wetland polygons within our study area (Table 3). The total wetland area was 176,286 ha, covering 10.6% of the total area. Emergent wetland was the predominant wetland type with 206,034 polygons, accounting for 77.0% of total wetland area (see Table 3). In contrast, there were 674 lake polygons with a median size of 16.18 ha, which is approximately 135 times the median size of emergent wetlands. The median size of all NWI polygons in the study area was only 0.12 ha, which is slightly larger than the size of a single Landsat pixel.
Table 3.
Summary statistics of the original NWI dataset in our study area.
| Wetland type | Count | Min (ha) | Max (ha) | Mean (ha) | Median (ha) | Sum (ha) | Area percentage |
|---|---|---|---|---|---|---|---|
| Emergent wetland | 206,034 | 0.01 | 488.58 | 0.66 | 0.12 | 135,820 | 77.00% |
| Scrub-shrub or forested wetland | 888 | 0.01 | 22.52 | 0.43 | 0.2 | 381 | 0.20% |
| Pond wetland | 6597 | 0.01 | 141.66 | 0.68 | 0.14 | 4495 | 2.50% |
| Lake | 674 | 0.07 | 4579.32 | 52.8 | 16.18 | 35,590 | 20.20% |
| Total (all polygons) | 214,193 | 0.01 | 4579.32 | 0.82 | 0.12 | 176,286 | 100.00% |
To evaluate the suitability of using 30-m JRC global surface water products to extract wetland inundation extent in the study area, we compared the JRC Surface Water Occurrence product to the NWI geospatial dataset. Strikingly, we found that 172,156 out of the 214,193 (80.4%) NWI polygons in the study area were not captured in the JRC product. The median size and total area of these uncaptured wetland polygons were 0.09 ha (i.e., the size of a single Landsat pixel) and 40,188 ha (i.e., 22.8% of the total area of NWI polygons), respectively. Examples of small wetland features not captured in the JRC product are shown in Fig. 12a. It can be seen that the JRC products largely failed to capture sub-hectare wetland features in the PPR due to the moderate spatial resolution (30-m) of Landsat data. Therefore, fine spatial resolution data (e.g., 1-m NAIP imagery) are crucial for mapping sub-hectare wetland features.
Fig. 12.
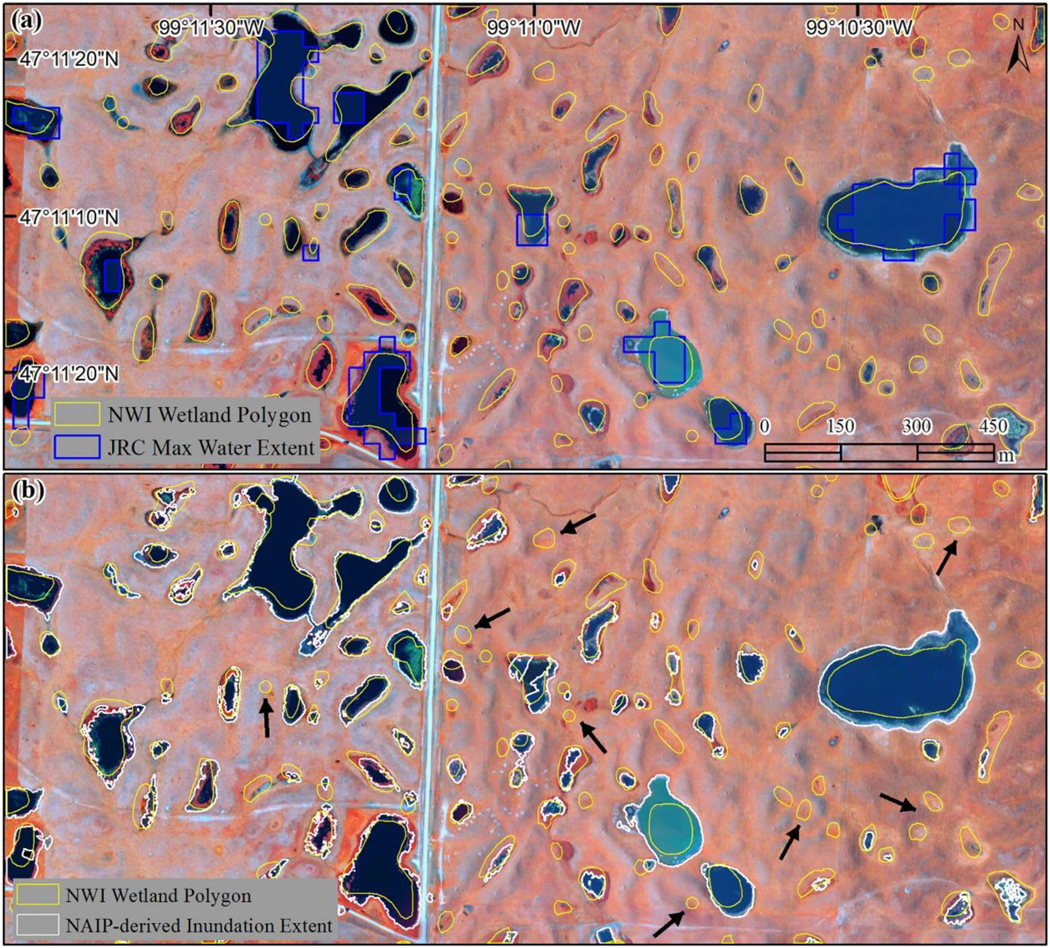
Comparison with NWI geospatial dataset. (a) Comparing NWI with JRC Landsat-derived maximum water extent (1984–2015). (b) Comparing NWI with NAIP-derived maximum inundation extent (2009–2017) using our automated algorithm. The black arrows are pointing at small NWI polygons not detected by our algorithm, which did not contain visible water bodies during any of the six dates of NAIP images (2009–2017). The background NAIP imagery was acquired in July 2014.
To examine potential inundation dynamics in the study area since the 1980s when the NWI dataset was originally developed, we performed an overlay analysis to identify NWI polygons, which were not located within the inundation extent derived using our method. We found that 65,517 NWI emergent wetland polygons (i.e., 31.8% of the original emergent wetland count) (see Table 4) in the study area did not contain visible water bodies during any of the six time periods of NAIP imagery (2009–2017). The median size of these wetland polygons was only 0.06 ha, which is smaller than the size of a single Landsat pixel. Examples of these small sub-hectare wetland polygons without visible water bodies are shown in Fig. 12b. In total, 9491 ha (i.e., 5.4% of the total area of NWI polygons) of NWI wetlands in the study area did not contain visible water bodies during any of the six time periods of NAIP imagery. A summary of water regimes of the undetected NWI emergent wetlands by our method is shown in Table 5. Temporarily and seasonally flooded wetlands constituted approximately 97% of the undetected wetland features.
Table 4.
Summary statistics of NWI wetland polygons without visible water bodies during any of the six time periods of NAIP imagery (2009–2017).
| Wetland type | Count | Min (ha) | Max (ha) | Mean (ha) | Median (ha) | Sum (ha) | Area percentage |
|---|---|---|---|---|---|---|---|
| Emergent wetland | 65,517 | 0.01 | 41.14 | 0.14 | 0.06 | 9257 | 97.50% |
| Scrub-shrub or forested wetland | 96 | 0.01 | 0.86 | 0.19 | 0.13 | 19 | 0.20% |
| Pond wetland | 381 | 0.01 | 8.32 | 0.32 | 0.1 | 122 | 1.30% |
| Lake | 6 | 2.64 | 31.85 | 15.56 | 12.15 | 93 | 1.00% |
| Total (all polygons) | 66,000 | 0.01 | 41.14 | 0.14 | 0.06 | 9491 | 100.00% |
Table 5.
Summary statistics of water regimes of NWI emergent wetlands without visible water bodies during any of the six time periods of NAIP imagery (2009–2017).
| Water regime | Count | Min (ha) | Max (ha) | Mean (ha) | Median (ha) | Sum (ha) | Area percentage |
|---|---|---|---|---|---|---|---|
| Temporarily flooded (PEM1A) | 28,562 | 0.01 | 41.14 | 0.16 | 0.06 | 4651 | 50.20% |
| Seasonally flooded (PEM1C) | 36,350 | 0.01 | 26.39 | 0.12 | 0.06 | 4295 | 46.40% |
| Semi-permanently flooded (PEM1F) | 600 | 0.01 | 22.5 | 0.52 | 0.16 | 310 | 3.30% |
| Seasonally saturated (PEM1B) | 5 | 0.07 | 0.3 | 0.18 | 0.17 | 1 | 0.01% |
| Total (all polygons) | 65,517 | 0.01 | 41.14 | 0.14 | 0.06 | 9257 | 100.00% |
4. Discussion
4.1. Significance of this study
We developed a fully automated and scalable algorithm for mapping wetland inundation dynamics using multi-temporal 1-m NAIP imagery and LiDAR data on GEE. The inundation extent of relatively large wetlands and deepwater habitats can be identified in most existing regional- to global-scale surface water products derived from moderate-resolution satellite images (e.g., Landsat, Sentinel-1, Sentinel-2) (e.g., Donchyts et al., 2016; Hird et al., 2017; Pekel et al., 2016; Tang et al., 2016; Yamazaki and Trigg, 2016). However, no current broad-scale surface water product maps wetlands smaller than a Landsat pixel, and most Landsat products have difficulty mapping anything much <1 ha. In addition, previous methods commonly required extensive training datasets for supervised classification of satellite imagery. This limits their applicability in regions lacking training data, especially when those data must be collected in the field. In this study, we applied the k-means unsupervised learning algorithm to classify multi-temporal NAIP images and extract inundation extent using prior water masks derived from the JRC Global Surface Water products, thereby avoiding the time-consuming process of collecting training datasets. The initial inundation maps were further refined using surface depressions derived from LiDAR data.
The fully automated and scalable GEE workflow we developed can be easily adapted to develop or refine existing fine spatial resolution surface water products at broad geographic scales where LiDAR data are available. For example, this approach could be used to help update NWI maps in areas where land cover change has occurred since initial dataset production. Our method detects inundation and not soil saturation and therefore could not be used to infer changes in drier-end (e.g., saturated) wetlands. However, inundation as detected by our product that is not associated with floods and is not within an NWI polygon is very likely to indicate gains in wetland or deepwater habitat. This type of change is evident in Fg. 8d and has been documented by the NWI Wetlands Status and Trends study (Dahl, 2014). In addition, the lack of inundation within NWI polygons with water regimes that would be expected to support inundation during the summer (e.g., semi-permanently flooded or intermittently exposed) is likely to indicate wetland loss or change in water regime (e.g., semi-permanently flooded to temporarily flooded). The aforementioned changes are likely to indicate necessary NWI dataset updates and our data could be used within a semi-automated framework to enable more rapid, cost effective updates to the NWI dataset. Although the NWI dataset is the most categorically and spatially detailed national wetland dataset in the U.S. and is therefore critical for parcel level decision support and the parameterization of wetland functional models, it is not contemporary in some portions of the U.S. and could therefore benefit from these types of updates. Such fine-resolution surface water updates and products are especially crucial for managing watersheds with relatively high wetland densities (Cohen et al., 2016; Creed et al., 2017; Golden et al., 2017).
4.2. Limitation and potential improvements
The temporal frequency of 1-m wetland inundation products in this study is limited by the availability of NAIP images in the U.S. The USDA only started acquiring 4-band (RGB and near-infrared) nationwide NAIP images annually to biennially since 2009. Recently the NAIP repeat cycle was changed to every 3 years. Therefore, the temporal resolution of NAIP-derived wetland inundation products is not comparable to other regional- to global-scale monthly surface water products derived from moderate-resolution satellites (e.g., Landsat, Sentinel-2). However, our study provides inter-annual wetland inundation products at an unprecedented spatial resolution (1-m) compared to existing 30-m surface water products. Future research to incorporate other fine spatial resolution commercial satellite imagery with high temporal frequency could potentially improve the temporal resolution of fine-scale wetland inundation products. For example, the constellation of CubeSat miniature satellites developed by Planet (https://www.planet.com, accessed 17 September 2018) can capture RGB and near-infrared images at 3–5 m resolution with near-daily global coverage (McCabe et al., 2017). Coupled with the near-annual 1-m wetland inundation products, near-daily 3–5 m surface water products could provide crucial insights regarding the response of surface water extent in wetlands to climate change and anthropogenic activities, especially for small wetlands (i.e., area < 0.1 ha) that could not be captured by moderate-resolution satellites.
Shadows resulting from various sources (e.g., trees, buildings, terrain) can cause false water detections because the underlying spectral characteristics of the surface may overlap with that of water (DeVries et al., 2017; Pekel et al., 2016). We used LiDAR-derived surface depressions to effectively remove false water detections resulting from shadows, which can substantially decrease commission errors. However, the use of LiDAR data can potentially increase omission errors for the following reasons. First, topographic LiDAR sensors typically operate in the near-infrared wavelength, which lack water-penetrating capabilities. Therefore, a LiDAR-derived surface depression based on the depression-filling algorithm represents the potential water storage capacity between the water surface during data acquisition (i.e., existing water storage) and the spill point (i.e., maximum water storage). In extremely wet conditions, some wetlands might become fully inundated, spilling water downstream. In such cases, fully inundated wetlands no longer have the capacity to hold more water. Therefore, these fully inundated wetlands might not be detected as depressional features in a LiDAR DEM acquired during such extremely wet conditions. Bathymetric LiDAR data with water penetration capabilities or topographic LiDAR data acquired during dry conditions are recommended for calculating wetland water storage and simulating inundation dynamics (Wu et al., 2018). Second, some large depressional or riverine wetlands might span across watershed boundaries. This can cause them not being detected as closed depressions in a LiDAR DEM. Therefore, valid candidates of wetland inundation areas extracted from the NAIP unsupervised classification results could be falsely removed in the refinement step using surface depressions as a criterion. One potential solution to this problem is to increase the watershed scale when running the depression-filling algorithm to detect surface depressions, thereby avoiding large depressional or riverine wetlands being cut off at the watershed boundaries. In addition, LiDAR intensity imagery can aid in detection of depressional wetlands (Lang et al., 2013; Wu and Lane, 2016).
5. Conclusions
In this study, we developed a fully automated algorithm for delineating wetland inundation dynamics using multi-temporal aerial imagery (1-m) and LiDAR data on the GEE platform. The automated algorithm does not require any external training datasets, which are often time-consuming to collect and subject to human errors. Instead, the algorithm uses an unsupervised classification approach and water clusters are extracted by utilizing prior water masks derived from existing global-scale surface water products based on the long-term Landsat archive. The initial water clusters are further refined using LiDAR-derived surface depressions. All computational steps of our proposed method can be accomplished on the GEE cloud-computing platform, thereby avoiding the need of excessive desktop computing power to process tremendous volumes of geospatial datasets (e.g., multi-temporal 1-m NAIP imagery, LiDAR data). Results show that the proposed method can not only delineate current wetland inundation areas but also characterize “snapshots” of some of their key hydrological dynamics accurately, such as wetland merging and splitting resulting from filling-spilling-merging and draining-splitting hydrological processes. With the increasing availability of LiDAR data acquired through the USGS’s 3D Elevation Program (3DEP) initiative (Sugarbaker et al., 2014), our GEE-based workflow holds great potential to efficiently and effectively map wetlands and characterize their inundation dynamics, improving decision-support for resource and hydrological, nutrient, and habitat management applications at regional and national scales. Furthermore, inundation maps derived using our approach could be used to help update fine spatial scale national polygonal datasets, such as the National Wetlands Inventory, which have traditionally relied on more costly manual interpretation to generate data. Incorporating approaches like the one described in this article could help provide the public with more contemporary information at a lower cost.
Acknowledgments
This article has been reviewed in accordance with the U.S. Environmental Protection Agency’s peer and administrative review policies and approved for publication. Any use of trade, firm, or product names is for descriptive purposes only and does not imply endorsement by the U.S. Government. Findings, conclusions and other statements in this publication reflect the authors’ professional views and opinions and should not be construed to represent any determination, policy, or view of the U.S. Environmental Protection Agency or the U.S. Fish and Wildlife Service.
Footnotes
Declarations of interest
The authors declare no conflict of interest.
References
- Arthur D, Vassilvitskii S, 2007. K-means++: The advantages of careful seeding. In: Proceedings of the Eighteenth Annual ACM-SIAM Symposium on Discrete Algorithms. Society for Industrial and Applied Mathematics, pp. 1027–1035. [Google Scholar]
- Azzari G, Lobell DB, 2017. Landsat-based classification in the cloud: an opportunity for a paradigm shift in land cover monitoring. Remote Sens. Environ 202, 64–74. 10.1016/j.rse.2017.05.025. [DOI] [Google Scholar]
- Bolanos S, Stiff D, Brisco B, Pietroniro A, 2016. Operational surface water detection and monitoring using Radarsat 2. Remote Sens. 8, 285. 10.3390/rs8040285. [DOI] [Google Scholar]
- Brooks JR, Mushet DM, Vanderhoof MK, Leibowitz SG, Christensen JR, Neff BP, Rosenberry DO, Rugh WD, Alexander LC, 2018. Estimating wetland connectivity to streams in the prairie pothole region: an isotopic and remote sensing approach. Water Resour. Res 10.1002/2017WR021016. [DOI] [PMC free article] [PubMed] [Google Scholar]
- Cheng FY, Basu NB, 2017. Biogeochemical hotspots: role of small water bodies in landscape nutrient processing. Water Resour. Res 53, 5038–5056. 10.1002/2016WR020102. [DOI] [Google Scholar]
- Clinton N, Stuhlmacher M, Miles A, Uludere Aragon N, Wagner M, Georgescu M, Herwig C, Gong P, 2018. A global geospatial ecosystem services estimate of urban agriculture. Earth’s Future 6, 40–60. 10.1002/2017EF000536. [DOI] [Google Scholar]
- Cohen MJ, Creed IF, Alexander L, Basu NB, Calhoun AJK, Craft C, D’Amico E, DeKeyser E, Fowler L, Golden HE, Jawitz JW, Kalla P, Kirkman LK, Lane CR, Lang M, Leibowitz SG, Lewis DB, Marton J, McLaughlin DL, Mushet DM, Raanan-Kiperwas H, Rains MC, Smith L, Walls SC, 2016. Do geographically isolated wetlands influence landscape functions? Proc. Natl. Acad. Sci. U.S.A 113, 1978–1986. 10.1073/pnas.1512650113. [DOI] [PMC free article] [PubMed] [Google Scholar]
- Cowardin LM, Carter V, Golet FC, LaRoe ET, 1979. Classification of Wetlands and Deepwater Habitats of the United States. US Department of the Interior, US Fish and Wildlife Service. [Google Scholar]
- Creed IF, Lane CR, Serran JN, Alexander LC, Basu NB, Calhoun AJK, Christensen JR, Cohen MJ, Craft C, D’Amico E, DeKeyser E, Fowler L, Golden HE, Jawitz JW, Kalla P, Kirkman LK, Lang M, Leibowitz SG, Lewis DB, Marton J, McLaughlin DL, Raanan-Kiperwas H, Rains MC, Rains KC, Smith L, 2017. Enhancing protection for vulnerable waters. Nat. Geosci 10, 809–815. 10.1038/ngeo3041. [DOI] [PMC free article] [PubMed] [Google Scholar]
- Dahl TE, 2014. Status and Trends of Prairie Wetlands in the United States 1997 to 2009. U.S. Department of the Interior; Fish and Wildlife Service, Ecological Services, Washington, D.C. [Google Scholar]
- DeVries B, Huang C, Lang M, Jones J, Huang W, Creed I, Carroll M, 2017. Automated quantification of surface water inundation in wetlands using optical satellite imagery. Remote Sens. 9, 807. 10.3390/rs9080807. [DOI] [Google Scholar]
- Donchyts G, Baart F, Winsemius H, Gorelick N, Kwadijk J, van de Giesen N, 2016. Earth’s surface water change over the past 30 years. Nat. Clim. Chang 6, 810. 10.1038/nclimate3111. [DOI] [Google Scholar]
- Downing JA, 2010. Emerging global role of small lakes and ponds: little things mean a lot. Limnetica 29, 0009–0024. 10.23818/limn.29.02. [DOI] [Google Scholar]
- Evenson GR, Golden HE, Lane CR, 2016. An improved representation of geographically isolated wetlands in a watershed-scale hydrologic model. Hydrol. Process 30, 4168–4184. 10.1002/hyp.10930. [DOI] [Google Scholar]
- Evenson GR, Golden HE, Lane CR, McLaughlin DL, D’Amico E, 2018. Depressional wetlands affect watershed hydrological, biogeochemical, and ecological functions. Ecol. Appl 10.1002/eap.1701. [DOI] [PMC free article] [PubMed] [Google Scholar]
- Feng M, Sexton JO, Channan S, Townshend JR, 2016. A global, high-resolution (30-m) inland water body dataset for 2000: first results of a topographic—spectral classification algorithm. International Journal of Digital Earth 9, 113–133. 10.1080/17538947.2015.1026420. [DOI] [Google Scholar]
- Gala TS, Melesse AM, 2012. Monitoring prairie wet area with an integrated LANDSAT ETM+, RADARSAT-1 SAR and ancillary data from LIDAR. Catena 95, 12–23. 10.1016/j.catena.2012.02.022. [DOI] [Google Scholar]
- Gascoigne WR, Hoag D, Koontz L, Tangen BA, Shaffer TL, Gleason RA, 2011. Valuing ecosystem and economic services across land-use scenarios in the Prairie Pothole Region of the Dakotas, USA. Ecol. Econ 70, 1715–1725. 10.1016/j.ecolecon.2011.04.010. [DOI] [Google Scholar]
- Gleason RA, Euliss NH Jr., Tangen BA, Laubhan MK, Browne BA, 2011. USDA conservation program and practice effects on wetland ecosystem services in the Prairie Pothole Region. Ecol. Appl 21, S65–S81. 10.1890/09-0216.1. [DOI] [Google Scholar]
- Golden HE, Creed I, Ali G, Basu N, Neff B, Rains M, McLaughlin D, Alexander L, Ameli A, Christensen J, Evenson G, Jones C, Lane C, Lang M, 2017. Scientific tools for integrating geographically isolated wetlands into land management decisions. Front. Ecol. Environ 15, 319–327. 10.1002/fee.1504. [DOI] [PMC free article] [PubMed] [Google Scholar]
- Gorelick N, Hancher M, Dixon M, Ilyushchenko S, Thau D, Moore R, 2017. Google Earth Engine: planetary-scale geospatial analysis for everyone. Remote Sens. Environ. 202, 18–27. 10.1016/j.rse.2017.06.031. [DOI] [Google Scholar]
- Hansen MC, Potapov PV, Moore R, Hancher M, Turubanova SA, Tyukavina A, Thau D, Stehman SV, Goetz SJ, Loveland TR, Kommareddy A, Egorov A, Chini L, Justice CO, Townshend JRG, 2013. High-resolution global maps of 21st-century forest cover change. Science 342, 850–853. 10.1126/science.1244693. [DOI] [PubMed] [Google Scholar]
- Hay L, Norton P, Viger R, Markstrom S, Steven Regan R, Vanderhoof M, 2018. Modelling surface-water depression storage in a Prairie Pothole Region. Hydrol. Process 32, 462–479. 10.1002/hyp.11416. [DOI] [Google Scholar]
- Hedley JD, Harborne AR, Mumby PJ, 2005. Simple and robust removal of sun glint for mapping shallow-water benthos. Int. J. Remote Sens 26, 2107–2112. 10.1080/01431160500034086. [DOI] [Google Scholar]
- Hird JN, DeLancey ER, McDermid GJ, Kariyeva J, 2017. Google Earth Engine, open-access satellite data, and machine learning in support of large-area probabilistic wetland mapping. Remote Sens. 9, 1315. 10.3390/rs9121315. [DOI] [Google Scholar]
- Homer C, Dewitz J, Yang L, Jin S, 2015. Completion of the 2011 National L and Cover Database for the conterminous United States–representing a decade of land cover change information. Photogramm. Eng. Remote Sens 81, 345–354. [Google Scholar]
- Huang S, Dahal D, Young C, Chander G, Liu S, 2011. Integration of Palmer Drought Severity Index and remote sensing data to simulate wetland water surface from 1910 to 2009 in Cottonwood Lake area, North Dakota. Remote Sens. Environ 115, 3377–3389. 10.1016/j.rse.2011.08.002. [DOI] [Google Scholar]
- Huang W, DeVries B, Huang C, Lang M, Jones J, Creed I, Carroll M, 2018. Automated extraction of surface water extent from Sentinel-1 data. Remote Sens. 10, 797. 10.3390/rs10050797. [DOI] [Google Scholar]
- Johnson WC, Poiani KA, 2016. Climate change effects on prairie pothole wetlands: findings from a twenty-five year numerical modeling project. Wetlands 36, 273–285. 10.1007/s13157-016-0790-3. [DOI] [Google Scholar]
- Johnston CA, 2013. Wetland losses due to row crop expansion in the Dakota prairie pothole region. Wetlands 33, 175–182. 10.1007/s13157-012-0365-x. [DOI] [Google Scholar]
- Kennedy RE, Yang Z, Gorelick N, Braaten J, Cavalcante L, Cohen WB, Healey S, 2018. Implementation of the LandTrendr algorithm on Google Earth Engine. Remote Sens. 10, 691. 10.3390/rs10050691. [DOI] [Google Scholar]
- Lane CR, Liu H, Autrey BC, Anenkhonov OA, Chepinoga VV, Wu Q, 2014. Improved wetland classification using eight-band high resolution satellite imagery and a hybrid approach. Remote Sens. 6, 12187–12216. 10.3390/rs61212187. [DOI] [Google Scholar]
- Lang M, McCarty G, Oesterling R, Yeo I-Y, 2013. Topographic metrics for improved mapping of forested wetlands. Wetlands 33, 141–155. 10.1007/s13157-012-0359-8. [DOI] [Google Scholar]
- Liu X, Hu G, Chen Y, Li X, Xu X, Li S, Pei F, Wang S, 2018. High-resolution multi-temporal mapping of global urban land using Landsat images based on the Google Earth Engine Platform. Remote Sens. Environ 209, 227–239. 10.1016/j.rse.2018.02.055. [DOI] [Google Scholar]
- McCabe MF, Rodell M, Alsdorf DE, Gonzalez Miralles D, Uijlenhoet R, Wagner W, Lucieer A, Houborg R, Verhoest N, Franz TE, Shi J, Gao H, Wood EF, 2017. The future of Earth observation in hydrology. Hydrol. Earth Syst. Sci 21, 3879–3914. 10.5194/hess-21-3879-2017. [DOI] [PMC free article] [PubMed] [Google Scholar]
- McFeeters SK, 1996. The use of the Normalized Difference Water Index (NDWI) in the delineation of open water features. Int. J. Remote Sens 17, 1425–1432. [Google Scholar]
- Niemuth ND, Fleming KK, Reynolds RE, 2014. Waterfowl conservation in the US Prairie Pothole Region: confronting the complexities of climate change. PLoS One 9, e100034. 10.1371/journal.pone.0100034. [DOI] [PMC free article] [PubMed] [Google Scholar]
- Pekel J-F, Cottam A, Gorelick N, Belward AS, 2016. High-resolution mapping of global surface water and its long-term changes. Nature 540, 418–422. 10.1038/nature20584. [DOI] [PubMed] [Google Scholar]
- Rajib A, Evenson GR, Golden HE, Lane CR, 2018. Hydrologic model predictability improves with spatially explicit calibration using remotely sensed evapotranspiration and biophysical parameters. J. Hydrol 567, 668–683. 10.1016/j.jhydrol.2018.10.024. [DOI] [PMC free article] [PubMed] [Google Scholar]
- Sugarbaker LJ, Constance EW, Heidemann HK, Jason AL, Lukas V, Saghy DL, Stoker JM, 2014. The 3D Elevation Program Initiative: A Call for Action. US Geological Survey; 10.3133/cir1399. [DOI] [Google Scholar]
- Tang Z, Li Y, Gu Y, Jiang W, Xue Y, Hu Q, LaGrange T, Bishop A, Drahota J, Li R, 2016. Assessing Nebraska playa wetland inundation status during 1985–2015 using Landsat data and Google Earth Engine. Environ. Monit. Assess 188, 419. 10.1007/s10661-016-5664-x. [DOI] [PubMed] [Google Scholar]
- Tiner RW, 2015. Wetlands: An overview. In: Tiner RW, Lang MW, Klemas VV (Eds.), Remote Sensing of Wetlands: Applications and Advances. CRC Press, pp. 3–18. [Google Scholar]; Tucker CJ, 1979. Red and photographic infrared linear combinations for monitoring vegetation. Remote Sens. Environ 8, 127–150. 10.1016/0034-4257(79)90013-0. [DOI] [Google Scholar]
- US EPA, 2015. Connectivity of Streams and Wetlands to Downstream Waters: A Review and Synthesis of the Scientific Evidence (Final Report). U.S. Environmental Protection Agency, Washington, DC: (EPA/600/R-14/475F). [Google Scholar]
- USDA, 2018. NAIP imagery. https://www.fsa.usda.gov/programs-and-services/aerialphotography/imagery-programs/naip-imagery/, Accessed date: 20 September 2018.
- USFWS, 2018. National Wetlands Inventory website. U.S. Department of the Interior, Fish and Wildlife Service, Washington, D.C.http://www.fws.gov/wetlands/. [Google Scholar]
- Vanderhoof MK, Alexander LC, 2016. The role of lake expansion in altering the wetland landscape of the prairie pothole region, United States. Wetlands 36, 309–321. 10.1007/s13157-015-0728-1. [DOI] [PMC free article] [PubMed] [Google Scholar]
- Vanderhoof MK, Lane CR, 2019. The potential role of very high-resolution imagery to characterise lake, wetland and stream dynamics across the Prairie Pothole Region, United States. Int. J. Remote Sens 10.1080/01431161.2019.1582112. [DOI] [PMC free article] [PubMed] [Google Scholar]
- Vanderhoof MK, Alexander LC, Jason Todd M, 2016. Temporal and spatial patterns of wetland extent influence variability of surface water connectivity in the Prairie Pothole Region, United States. Landsc. Ecol 31, 805–824. 10.1007/s10980-015-0290-5. [DOI] [Google Scholar]
- Vanderhoof MK, Christensen JR, Alexander LC, 2017. Patterns and drivers for wetland connections in the Prairie Pothole Region, United States. Wetl. Ecol. Manag 25, 275–297. 10.1007/s11273-016-9516-9. [DOI] [PMC free article] [PubMed] [Google Scholar]
- Vanderhoof MK, Distler HE, Lang MW, Alexander LC, 2018. The influence of data characteristics on detecting wetland/stream surface-water connections in the Delmarva Peninsula, Maryland and Delaware. Wetl. Ecol. Manag 26, 63–86. 10.1007/s11273-017-9554-y. [DOI] [PMC free article] [PubMed] [Google Scholar]
- Wright CK, Wimberly MC, 2013. Recent land use change in the Western Corn Belt threatens grasslands and wetlands. Proc. Natl. Acad. Sci. U. S. A 110, 4134–4139. 10.1073/pnas.1215404110. [DOI] [PMC free article] [PubMed] [Google Scholar]
- Wu Q, 2018. GIS and remote sensing applications in wetland mapping and monitoring. In: Huang B. (Ed.), Comprehensive Geographic Information Systems. Elsevier, Oxford, pp. 140–157. 10.1016/B978-0-12-409548-9.10460-9. [DOI] [Google Scholar]
- Wu Q, Lane CR, 2016. Delineation and quantification of wetland depressions in the prairie pothole region of North Dakota. Wetlands 36, 215–227. 10.1007/s13157-015-0731-6. [DOI] [Google Scholar]
- Wu Q, Lane CR, 2017. Delineating wetland catchments and modeling hydrologic connectivity using lidar data and aerial imagery. Hydrol. Earth Syst. Sci 21, 3579–3595. 10.5194/hess-21-3579-2017. [DOI] [PMC free article] [PubMed] [Google Scholar]
- Wu Q, Lane C, Liu H, 2014. An effective method for detecting potential woodland vernal pools using high-resolution LiDAR data and aerial imagery. Remote Sens. 6, 11444–11467. 10.3390/rs61111444. [DOI] [Google Scholar]
- Wu Q, Lane CR, Wang L, Vanderhoof MK, Christensen JR, Liu H, 2018. Efficient delineation of nested depression hierarchy in digital elevation models for hydrological analysis using the level-set method. J. Am. Water Resour. Assoc 1–15. 10.1111/1752-1688.12689. [DOI] [PMC free article] [PubMed] [Google Scholar]
- Yamazaki D, Trigg MA, 2016. Hydrology: the dynamics of Earth’s surface water. Nature 540, 348–349. 10.1038/nature21100. [DOI] [PubMed] [Google Scholar]


