Abstract
Osteoarthritis (OA) is a chronic condition marked by joint pain, inflammation and loss of articular cartilage, that can be treated with total joint arthroplasty (TJA) at end stages. TJA is marked by post-operative inflammation, which directly effects levels of cartilage degradation biomarkers, proteoglycan-4 (PRG4) and matrix metalloproteinase-9 (MMP-9). PRG4 is a protective glycoprotein that is decreased in individuals with OA. MMP-9 is a matrix metalloproteinase that contributes to articular cartilage loss and is elevated in OA patients. It is upregulated by pro-inflammatory markers, such as IL-1, IL-6 and CRP. This study aims to elucidate the immediate post-operative changes in levels of PRG4, MMP-9, IL-6, CRP, and WBC in patients undergoing TJA to clarify the role of inflammation in recovery after surgery and in the overall pathogenesis of OA. Blood was collected at 3 time points (day 0, day 1 post-operatively, and days 5-7 post-operatively), from 63 patients undergoing TJA due to OA, and levels of these biomarkers were quantified. IL-6, CRP, WBC and MMP-9 were lowest at day 0, highest at day 1, and stabilized at an intermediate level at days 5-7. Meanwhile, PRG4 followed the opposite trend. These studies suggest that IL-6, CRP and WBC showed predictable fluctuations, with pro-inflammatory biomarkers upregulating MMP-9 and downregulating PRG4. Measuring these biomarkers may help expose the role of inflammation in the post-surgical recovery of TJA patients and in long-term pathogenesis of OA. These levels may help risk stratify patients pre-operatively and help develop individualized post-surgical plans.
Keywords: osteoarthritis, cartilage degradation, inflammation, matrix metalloproteinase-9, proteoglycan-4
Background
Affecting nearly 70% of individuals from 55-70 years old, osteoarthritis (OA) is a degenerative condition of the joint marked by pain, inflammation and loss of articular cartilage.1,2 While most therapies are aimed at relieving symptoms, end stage OA can be electively treated with total joint arthroplasty (TJA).2 Due to either trauma or age-related changes, matrix degrading enzymes contribute to the loss of articular cartilage.1 In this syndrome, these enzymes can be activated by factors such as proteases and heparinase.1 Inflammation is also a known contributory factor to the pathogenesis of OA, with downstream effects that have damaging consequences to the joint.1,3
Our group recently published an article regarding these patients that reported dysregulation of cartilage degradation biomarkers, matrix metalloproteinase-9 (MMP-9) and ADAMTS4 (a disintegrin and metalloproteinase with thrombospondin motifs 4), and their relationship to osteopontin (OPN).4 The levels of these factors can be of use in monitoring progression of OA by reporting levels of inflammation and breakdown of cartilage, aiding providers to select appropriate therapies and interventions for their OA patients.
TJA is marked by post-operative inflammation, which directly effects levels of certain cartilage degradation biomarkers, such as proteoglycan-4 (PRG4) and MMP-9.4,5 In turn, these factors are either down- or up-regulated to contribute to the destruction of cartilage within the joint.
MMPs are a group of enzymes that are known to digest components of the extracellular matrix (ECM), contributing to the pathogenesis of OA.6 They work via their zinc-containing catalytic site, which is active at physiologic temperature and pH.6 MMP-9 is a specific matrix metalloproteinase that is elevated in OA patients and is known to degrade collagen and aggrecan, 2 major components of articular cartilage, leading to increased severity of OA.4,6,7 Other MMPs that contribute to OA are MMP-1, -2, -3, -8, -13, -14, and -16.6 MMP-9 is elevated in specifically moderate and late OA, yielding itself as a marker for disease severity.6 This family of enzymes is upregulated by inflammatory cytokines such as interleukin (IL)-1, IL-6 and C-reactive protein (CRP).7,8
PRG4, also known as lubricin, is a superficial zone protein on cartilage that is secreted by chondocytes and is known to have a cytoprotective role.5 Also, it assists with joint lubrication and matrix binding, and has been proven to have anti-inflammatory function.5,8,9 PRG4 is known to be decreased in OA patients, and the degradation of this protein renders the cartilage more susceptible to damage.8,9 Splice variants of PRG4 have been found in degraded cartilage, indicating that the shortened form of PRG4 is less functional and therefore, less protective.10 Interestingly, PRG4 has been proven to be susceptible to cleavage by MMPs and serine proteases, such as plasmin and elastin within cartilage.8,10 This indicates that the breakdown of PRG4 in articular cartilage by MMPs and other enzymes may contribute to the pathogenesis of OA.8,10
OA is a disorder characterized by local inflammation, as evidenced by stiffness, joint pain and swelling.3 Importantly, many pro-inflammatory biomarkers have been implicated in this disease such as IL-1, IL-2, IL-6, IL-15, IL-18, CRP, leptin, tumor necrosis factor (TNF)-α, and many others.3,11 The inflammation cascade is initiated by IL-1 and TNF-α, which activates other inflammatory cytokines such as IL-6.3,12 IL-6 is known to increase acutely post-operatively after TJA.13,14 This sequence is continued by the activation of MMPs and other cartilage degradation enzymes to further the progression of OA.3,11 IL-6 is known to inhibit collagen synthesis and its level in the blood is correlated with severity of pain in OA patients.15,16 CRP is an acute phase reactant and its release from hepatocytes is stimulated by cytokines.3 This biomarker is also positively correlated with OA joint pain and has been shown to predict operative and post-operative outcomes.17,18
The pathogenesis of OA is a complex, multifactorial process leading to cartilage remodeling, resulting in structural and functional changes, and subsequent pathogenesis requiring joint replacement and other management modalities. The previous studies reported have identified PRG4 as a proteoglycan, which is expressed in joints to facilitate lubrication and mobility. The inflammatory process and matrix degrading enzyme results in a decrease in the synthesis of this proteoglycan. Therefore, it was the primary rationale of this study to demonstrate the role of PRG4 in regulating circulatory levels of biomarkers of inflammation and matrix degrading enzyme. Moreover, these studies were designed to determine the relationship between inflammatory biomarkers and PRG4 levels.
Based on the rationale stated above, it was hypothesized that, in OA patients undergoing TJA, post-operative fluctuations of these biomarkers will occur due to inflammatory changes caused by the OA and associated surgery. We recruited patients who underwent TJA due to severe OA and blood was drawn at 3 draw dates, day 0, day 1 post-operatively, and days 5-7 post-operatively. It was presumed that at baseline pre-operatively, levels of pro-inflammatory biomarkers IL-6, CRP, and white blood cells (WBC) will be lowest at day 0, and therefore MMP-9 will also be lower. Since these markers inhibit PRG4, we projected that this proteoglycan will be highest at day 0. On day 1 post-operatively, inflammation will likely be at its peak and therefore IL-6, CRP, WBC and MMP-9 will be elevated, while PRG4 will likely be decreased. These biomarkers will help elucidate the immediate post-surgical changes that occur in OA patients, which may be helpful in the recovery and management of these patients, and in pre-operative risk stratification.
Materials and Methods
The protocol was approved by the Loyola University Chicago Health Sciences Division IRB and patients were properly consented before undergoing the procedure. In patients undergoing TJA due to OA (n = 63), deidentified plasma or serum was collected at 3 different time points (day 0, day 1 post-operatively, and days 5-7 post-operatively). The samples were collected in vacutainer tubes containing sodium citrate (0.109 M) and sent to the Hemostasis & Thrombosis Laboratory of Loyola University Medical Center for processing. Plasma was separated from blood via centrifugation at 1500xg for 20 minutes. Samples were frozen at −80°C and were thawed in batches for analysis. The patients ages ranged from 47-87 years old with mean age 68 ± 10.8 years. The samples were analyzed using enzyme-linked immunosorbent assay (ELISA) kits for MMP-9 (R&D Systems, Minneapolis, MN), PRG4 (MyBioSource, San Diego, CA), CRP (R&D Systems, Minneapolis, MN), and IL-6 (R&D Systems, Minneapolis, MN). Reagents, standards, and sample solutions were thawed, diluted, and prepared according to ELISA manufacturer’s specifications. WBC were measured in a complete blood count using whole blood, which included total WBC, lymphocytes, neutrophils, and platelets. This was analyzed with a KX-21 N hematology analyser (Sysmex, Japan). A set of 50 plasma samples from healthy individuals were purchased from George King BioMedical (Overland Park, KS) to use as control samples.
Statistical Analysis
Data was analyzed using GraphPad Prism Version 8.0 (GraphPad Software, San Diego, CA), and Microsoft Excel. PRG4 and MMP-9 compared TJA samples with George King Biomedical samples. IL-6 and CRP TJA patients were compared to pooled normal human plasma samples. The results were reported as mean ± standard error of the mean and percentage change ± standard error of the mean. Statistical significance was determined using the Kruskal-Wallis one-way ANOVA. P values <0.05 were considered statistically significant.
Results
In OA patients who underwent TJA (n = 63), levels of MMP-9 were significantly different at all draw dates when compared to controls (Figure 1). At day 0: (957 ± 107 ng/mL vs. 77.4 ± 7.75 ng/mL; P < 0.0001), day 1: (1507 ± 84.8 ng/mL vs. 77.4 ± 7.75 ng/mL; P < 0.0001), and days 5-7: (1264 ± 78.8 ng/mL vs. 77.4 ± 7.75 ng/mL; P < 0.0001). Percent change between draw dates was also measured and depicted in Table 1. From day 0 to day 1, there was a change of +5587%, P = 0.0011. From day 1 to days 5-7, percent change was -1790%, P = 0.7163. Overall average MMP-9 level was significantly higher than controls: (1270 ± 56.7 ng/mL vs. 77.4 ± 7.75 ng/mL; P < 0.0001). The minimum overall level of MMP-9 was not detectable, median was 1252 ng/mL, and maximum was 2955 ng/mL. In the control population, the minimum overall level was 34.1 ng/mL, the median was 72.5 ng/mL and the maximum was 174 ng/mL.
Figure 1.
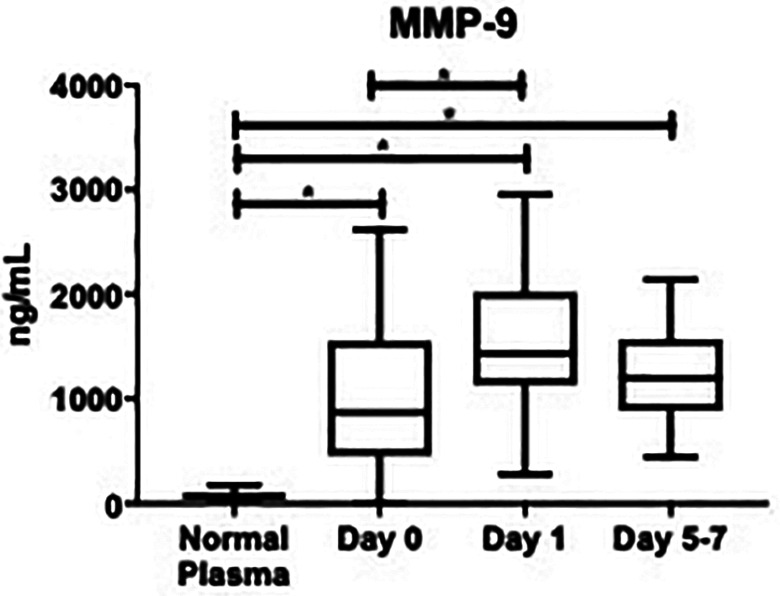
Box plot showing median levels of matrix metalloproteinase-9 (MMP-9) stratified by draw date (day 0, day 1, days 5-7) versus controls. Boxes show interquartile ranges and I bars demonstrate highest and lowest values. Day 0 versus control, P < 0.0001; day 1 versus control, P < 0.0001; days 5-7 versus control, P < 0.0001; day 0 versus day 1, P = 0.0011; day 0 versus days 5-7, P = 0.337; day 1 versus days 5-7, P = 0.716. (*P < 0.05).
Table 1.
Comparison of Post-Surgical Changes in Biomarker Levels Between Day 0, Day 1, and Days 5-7 in Osteoarthritis Patients.a
| Biomarkers | % ▵ Day 0 to Day 1 | P | % ▵ Day 1 to Days 5-7 | P |
|---|---|---|---|---|
| MMP-9 (ng/mL) | 5587% | 0.0011 | −1790% | 0.7163 |
| PRG4 (pg/mL) | -5530% | 0.7041 | 10828% | 0.0040 |
| IL-6 (ng/mL) | 132500% | <0.0001 | −7608% | <0.0001 |
| CRP (ug/mL) | 6977% | 0.546 | −1321% | 0.498 |
| WBC (x10^9/L) | 4602% | <0.0001 | −2589% | <0.0001 |
Abbreviations: MMP-9, matrix metalloproteinase-9; PRG4, proteoglycan-4; IL-6, interleukin-6; CRP, C-reactive protein; WBC, white blood cells.
a Percentage change (%▵) and P values are reported between draw dates for OA patients (n = 63).
PRG4 was not significantly different compared with controls at day 0: (72.2 ± 18.8 pg/mL vs. 137 ± 109 pg/mL; P > 0.9999), at day 1: (32.3 ± 11.3 pg/mL vs. 137 ± 109 pg/mL; P > 0.999), or days 5-7: (67.2 pg/mL ± 15.3 vs. 137 ± 109 pg/mL; P = 0.2037), Figure 2. These changes are also depicted more clearly in Figure 3, as the scatter among the controls was relatively high. As seen in Table 1, the percent change from day 0 to day 1 was not significant: (−5530%, P = 0.7041), but was significant from day 1 to days 5-7: (+10828%, P = 0.0040). The overall average of PRG4 was not significantly different versus controls: (55.9 ± 9.30 pg/mL vs. 137 ± 109 ng/mL; P = 0.3616). The minimum overall PRG4 level was not detectable, the median was not detectable, and the maximum was 617 pg/mL. The healthy controls had a minimum that was not detectable, a median that was not detectable, and a maximum of 1090 pg/mL.
Figure 2.
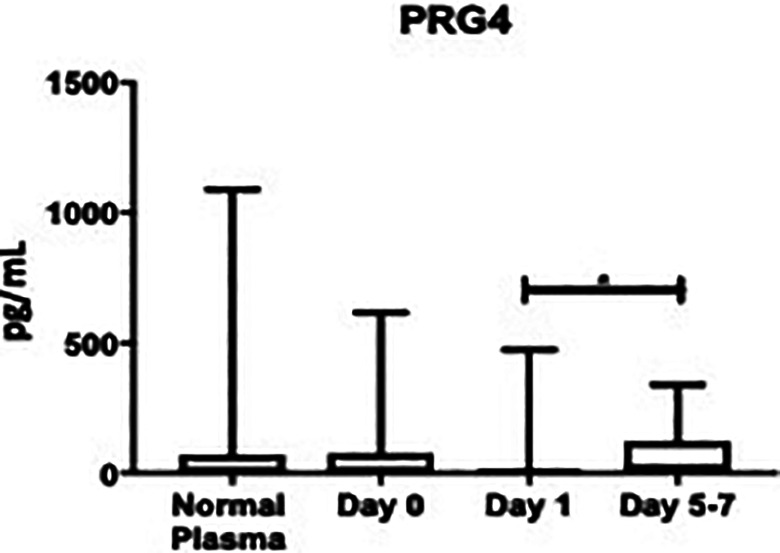
Box plot showing median levels of proteoglycan-4 (PRG4) stratified by draw date (day 0, day 1, days 5-7) versus controls. Boxes show interquartile ranges and I bars demonstrate highest and lowest values. Day 0 versus control, P > 0.9999; day 1 versus control, P > 0.9999; days 5-7 versus control, P = 0.2037; day 0 versus day 1, P = 0.7041; day 0 versus days 5-7, P = 0.2260; day 1 versus days 5-7, P = 0.0040. (*P < 0.05).
Figure 3.
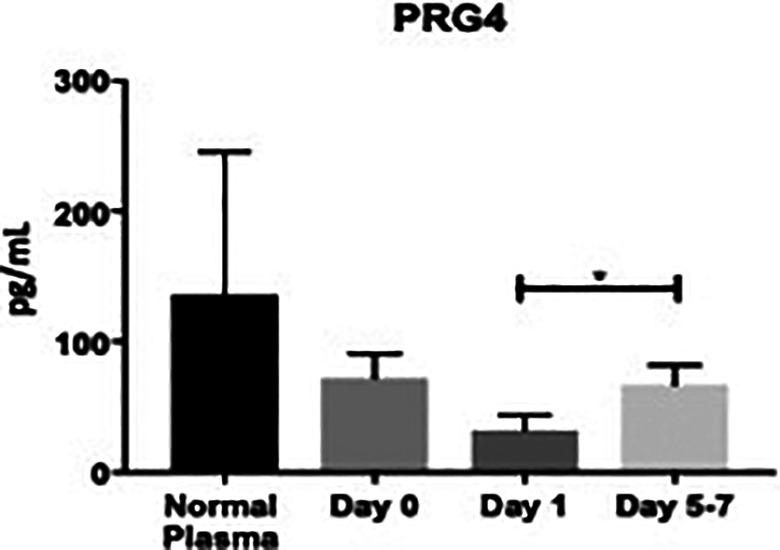
Bar graph showing levels of proteoglycan-4 (PRG4) stratified by draw date (day 0, day 1, days 5-7) versus controls. Day 0 versus control, P > 0.9999; day 1 versus control, P > 0.9999; days 5-7 versus control, P = 0.2037; day 0 versus day 1, P = 0.7041; day 0 versus days 5-7, P = 0.2260; day 1 versus days 5-7, P = 0.0040. (*P < 0.05).
As seen in Figure 4, IL-6 was not significantly elevated compared to healthy controls at day 0: (16.2 ± 7.26 ng/mL vs. 0 ± 0 ng/mL; P = 0.8554), but was significantly higher at day 1: (236 ± 22.1 ng/mL vs. 0 ± 0 ng/mL; P < 0.0001), and days 5-7: (60.0 ± 17.2 ng/mL vs. 0 ± 0 ng/mL; P = 0.0181). Per Table 1, the percent change from day 0 to day 1 was significant: (+132500%, P < 0.0001), as was from day 1 to days 5-7: (-7608%, P < 0.0001). The overall mean value of IL-6 was significantly elevated compared to healthy controls: (108 ± 12.3 ng/mL vs. 0 ± 0 ng/mL; P = 0.0001). In OA patients, the overall minimum level was 2.68 ng/mL, the median was 21.6 ng/mL, and the maximum was 909 ng/mL. In the control group, the minimum, median and maximum were all undetectable values.
Figure 4.
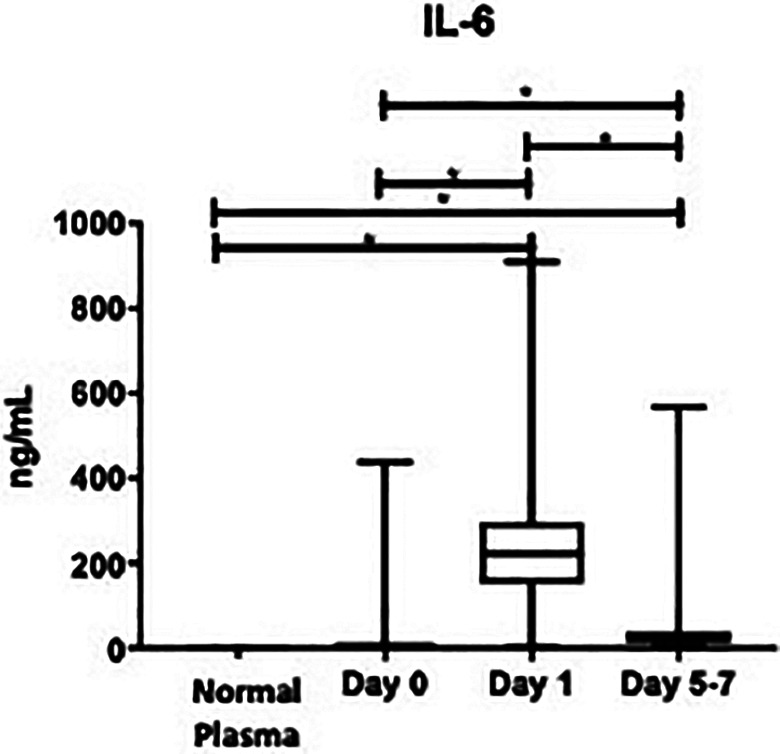
Box plot showing median levels of interleukin-6 (IL-6) stratified by draw date (day 0, day 1, days 5- 7) versus controls. Boxes show interquartile ranges and I bars demonstrate highest and lowest values. Day 0 versus control, P = 0.8554; day 1 versus control, P < 0.0001; days 5-7 versus control, P = 0.0181; day 0 versus day 1, P < 0.0001; day 0 versus days 5-7, P < 0.0001; day 1 versus days 5-7, P < 0.0001. (*P < 0.05).
While CRP was not significantly increased at any time point compared to controls, the same trends remain, as can be visualized in Figure 5. At day 0: (37.9 ± 5.82 ug/mL vs. 0.83 ± 0.12 ug/mL; P > 0.999), day 1: (62.0 ± 6.89 ug/mL vs. 0.83 ± 0.12 ug/mL; P = 0.2298), and days 5-7: (53.3 ± 8.78 ug/mL vs. 0.83 ± 0.12 ug/mL; P = 0.4342). The percent change from day 0 to day 1 was not significant: (+6977%, P = 0.546), nor was from day 1 to days 5-7: (-1321%, P = 0.498), as noted in Table 1. The total value of CRP was not significantly elevated compared to controls: (50.9 ± 4.10 ug/mL vs. 0.83 ± 0.12 ug/mL; P = 0.688). The overall minimum CRP level was not detectable, the median was 34.8 ug/mL, and the maximum was 208 ug/mL. In the healthy controls, the minimum was 0.50 ug/mL, the median was 0.90 ug/mL, and the maximum was 1.00 ug/mL.
Figure 5.
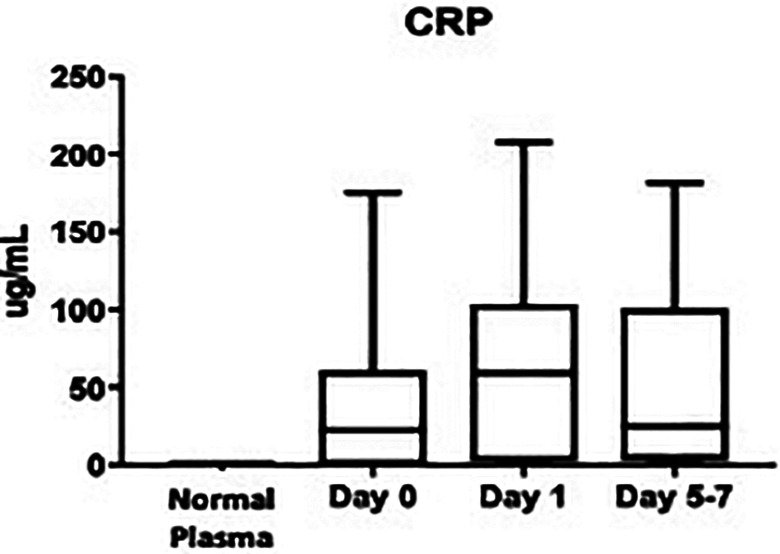
Box plot showing median levels of C-reactive protein (CRP) stratified by draw date (day 0, day 1, days 5-7) versus controls. Boxes show interquartile ranges and I bars demonstrate highest and lowest values. Day 0 versus control, P > 0.9999; day 1 versus control, P = 0.2298; days 5-7 versus control, P = 0.4342; day 0 versus day 1, P = 0.5460; day 0 versus days 5-7, P > 0.9999; day 1 versus days 5-7, P = 0.4981. (*P < 0.05).
The WBC fluctuations are depicted in Figure 6, and the data is as follows, day 0: (62.2 ± 0.21 x10^9/L), day 1 (9.40 ± 0.33 x10^9/L), and days 5-7 (6.88 ± 0.24 x10^9/L). The percent change from day 0 to day 1 was significant (+4602%, P < 0.0001), as well as from day 1 to days 5-7: (−2589%, P < 0.0001), per Table 1. Compared to the normal WBC (4.5-11 x10^9/L), the overall mean WBC in OA patients was not elevated: (7.54 ± 0.19 x10^9/L). The OA group has a minimum WBC of 2.90 x10^9/L, a median of 7.25 x10^9/L, and a maximum of 15.8 x10^9/L. As the normal value of WBC is a well-known range of 4.5-11 x10^9/L, WBC was not measured in our control population, nor included in our figures.
Figure 6.
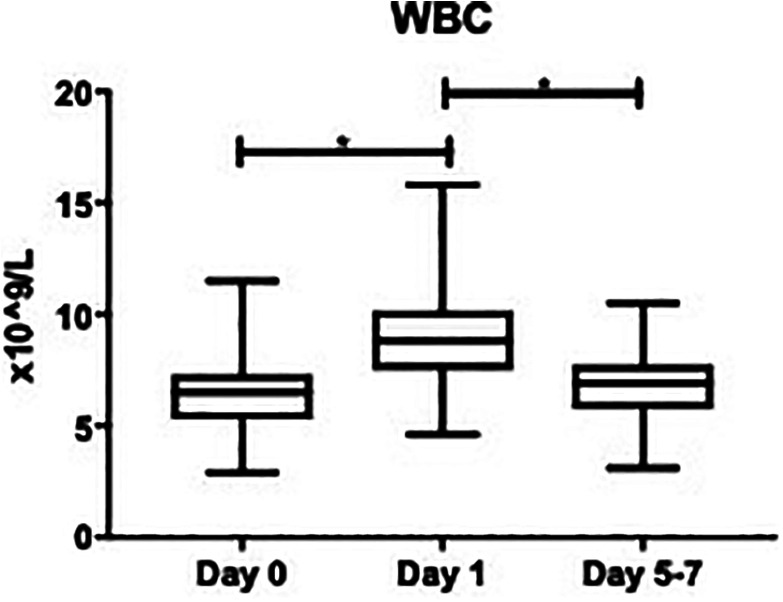
Box plot showing median levels of white blood cells (WBC) stratified by draw date (day 0, day 1, days 5-7). Boxes show interquartile ranges and I bars demonstrate highest and lowest values. Day 0 versus day 1, P < 0.0001; day 0 versus days 5-7, P = 0.4189; day 1 versus days 5-7, P < 0.0001. (*P < 0.05).
Discussion
Osteoarthritis is a disorder characterized by inflammation and cartilage degradation, which can be quantified by measuring levels of various surrogate markers of these processes.1,2 The biomarkers analyzed in this study include MMP-9, PRG4, IL-6, CRP, and WBC. Their post-surgical fluctuations are predictable and may have an effect on recovery and long-term outcomes in late stage OA patients who undergo TJA. While previous studies have investigated these factors, they have not published the relationship between this group of biomarkers. The results of this study show that inflammation drives the post-operative changes seen in this patient population, which then contributes to downstream effects on the joint. The interrelationship between these biomarkers may help to further elucidate the pathogenesis of OA, to stratify patients pre-operatively and help predict their outcomes after TJA.
In this study, the markers of inflammation measured were IL-6, CRP and WBC. Each of these factors were their lowest at day 0 before surgery, highest at day 1, and fell to an intermediate level at days 5-7. Each IL-6 and WBC fluctuation were statistically significant, and while the CRP changes were not, the same trend was present. IL-6 is generally accepted as a surrogate marker for acute inflammation after major surgery and has been proven to be predictive of development of post-surgical systemic inflammatory response syndrome (SIRS).13,14 Ghosh et al reported that baseline CRP levels also have an effect on peri-operative arthroplasty outcomes, as patients with higher CRP measurements had increased operative time as well as increased likelihood of developing complications.18 It is also known that the levels of cytokines tend to peak at approximately 24 hours post-operatively and remain elevated for up to 72 hours.13 Our results are consistent with previous findings, as IL-6, CRP and WBC were highest 24 hours after TJA and decreased by 120 hours.11,19 According to these results, THA leads to increased inflammation during the acute post-operative period, as evidenced by the elevated IL-6, CRP and WBC levels in our cohort. Interestingly, the levels of inflammation immediately after TKA have been correlated with long-term functional outcomes, but this has yet to be proven for patients who undergo THA.13
The enzyme known to digest articular cartilage, MMP-9, was elevated overall in our patient cohort compared to healthy controls. In OA patients, this biomarker increased significantly from day 0 to day 1, before falling to an intermediate level at days 5-7. These results follow the same trend as the inflammatory markers, IL-6, CRP, and WBC. As the inflammatory cascade is known to upregulate MMP-9 in the pathogenesis of OA, these results were to be expected.6,7 Additionally, MMP-9 is also known to be stimulated by thrombin, serine proteases that plays a major role in the coagulation cascade.20 Thrombin is also known to initiate the inflammatory cascade itself, leading to a continuous and destructive cycle in OA patients.21,22 This indicates that there is interplay between the hemostatic pathway and the inflammation observed in OA patients, which may contribute to the fact that patients undergoing TJA are at increased for thrombotic complications.21 More recently, a fragment generated by MMP-cleavage of CRP has been characterized, called ‘MMP-dependent degradation of CRP’ (CRPM).23 It quantifies the fragments of CRP that have been released from tissues with local inflammation and has been proven to predict the progression of OA when detected early, providing a window into the joint of OA patients.23 MMP-9 has a central role in the pathogenesis of OA, as it is activated by predominant processes in the disease, triggers breakdown of cartilage and causes increased levels of CRPM.6,7,22,23
Many individuals with OA have decreased PRG4 compared with controls, which was also the case in this study.8 In a healthy joint, PRG4 has a cytoprotective role, inhibiting inflammation, decreasing strain on the joint, and inhibiting cartilage degradation.5,8,10 However, in late stage OA when this biomarker is decreased, it is unable to elicit these responses. Moreover, PRG4 is known to be attached to the surface of the ECM via cartilage oligomeric matrix protein (COMP), and MMP-9 has been shown to digest this protein, releasing it from the joint space.24 This also disallows PRG4 to exhibit its protective functions. As MMP-9 was elevated in our patients and PRG4 was decreased, this further demonstrates this relationship. Alquraini et al showed that administration of recombinant PRG4 causes reduced induction of pro-inflammatory biomarkers, such as IL-1, IL-6 and IL-8, which leads to decreased gene expression of MMPs, including MMP-9.5 When comparing the time points in this study, PRG4 was shown to be at its highest level at day 0, when inflammatory markers were at their lowest, and fell to its lowest level at day 1, when inflammation was its highest. This shows the direct role that inflammation plays in the downregulation of PRG4, and therefore in the overall pathogenesis of OA.
Our previous manuscript reported a relationship between these biomarkers and OPN, an ECM glycoprotein that is elevated in OA patients.4 It is related to our current study, as OPN is upregulated via cleavage by MMP-9, thrombin and heparanase, and feeds back to initiate inflammation.4,25 The association of MMP-9 and OPN in OA pathogenesis is a novel and promising observation that further contributes to our understanding of this complication disorder.
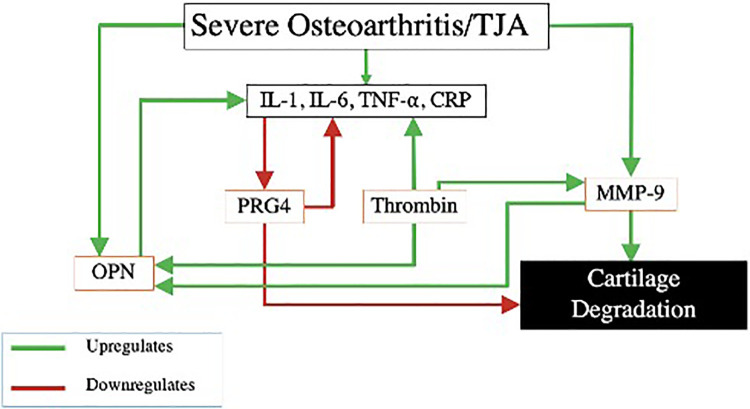
Figure 7 represents interrelationships between the inflammatory cascade, these biomarkers and their contribution to OA. A patient with end stage OA has upregulation of inflammation and MMP-9, and therefore downregulation of PRG4.3,7,8 Because PRG4 has a cytoprotective role, this decrease leaves the joint less lubricated and more vulnerable to deterioration.8 Increased MMP-9 leads to further destruction of articular cartilage via digestion of the ECM.6 Meanwhile, MMP-9 also cleaves OPN, which feeds back to upregulate inflammation and stimulate this continuous cycle.26 Finally, thrombin, which is increased in OA patients, upregulates the inflammatory cascade, MMP-9 and cleaves OPN.20–22,25
Figure 7.
Interrelationship of OA biomarkers. MMP-9, matrix metalloproteinase-9; OPN, osteopontin; PRG4, proteoglycan 4; IL-1, interleukin-1; IL-6, interleukin-6; TNF-α, tumor necrosis factor alpha; CRP, C-reactive protein; THA, total hip arthroplasty.
The central role of PRG4 in the downregulation of inflammatory mediators, such as IL-6, CRP, and WBC, and leukocyte mediators along with the modulation of matrix degrading enzymes, including MMP-9, is important in the overall outcome in OA patients. The balance between PRG4 levels, the inflammatory mediators and matrix degrading enzymes is therefore responsible for the pathogenesis of OA. Increased levels of inflammatory processes may downregulate the PRG4 synthesis in chondrocytes through upregulation of inflammasome and other regulatory processes. On the other hand, the increased PRG4 may impact the generation of inflammatory biomarkers in OA. This balance between the circulating levels of PRG4 and the ongoing inflammatory processes is dependent on the multiple predispositions and varies widely in OA. In the studies reported, the PRG4 levels were measured in plasma samples collected from OA patients. For this reason, the direct correlation between the circulating PRG4 level and the amount of this proteoglycan at the joint site are difficult to establish. Further studies including the measurement of PRG4 levels in synovial fluid may be useful in establishing the relationship between this proteoglycan and inflammatory mediators.
There are several limitations to this study. First, our patient cohort included 63 study participants. These results would gain external validity by expanding this study to include a larger number of patients. Additionally, the ELISA assays used antigen methodology, and therefore did not test the functionality of the enzymes studied. Proteases can be assed via other methods to confirm their activity, such as gel zymography, to more accurately characterize these factors. To provide greater insight into the effect of the levels of the biomarkers, study follow-up should occur over a longer period of time to better characterize the post-surgical changes and fluctuations. Our study primarily focused on the biomarker levels and the relationship between their levels. Further studies should consider the clinical outcomes of these patients and how these biomarkers correlate with surgical complications such as thrombosis, pain, infection, swelling, and long-term functional outcomes of patients.
Conclusion
In OA patients who undergo TJA, levels of IL-6, CRP and WBC will show predictable post-operative fluctuations, causing up or downregulation of cartilage degradation biomarkers, PRG4 and MMP-9. Pro-inflammatory biomarkers upregulate MMP-9 and downregulate PRG4, leading to cartilage degradation and decreased protection for the joint. Measurement of these biomarkers both pre- and post-operatively may help expose the role of inflammation in the post-surgical recovery of TJA patients and in long-term pathogenesis of OA, even after they have undergone joint arthroplasty. These levels may help physicians develop individualized post-surgical medication and physical therapy regimens, as well as risk stratify patients who are recommended to undergo joint replacement.
Acknowledgments
The authors gratefully acknowledge the assistance of the staff of the Hemostasis Research Laboratories, the Department of Orthopaedic Surgery and Rehabilitation, and the Department of Pathology for their assistance in the collection and processing of the patients’ plasma samples used in this study. The authors also acknowledge the contributions of Erin Erickson in completing this manuscript. We are also thankful to Dr. Alexander Ghanayem of the Department of Orthopaedic Surgery and Rehabilitation of Loyola for his guidance and support for this work. Special thanks to Dr. Kim Foreman and Dr. Nancy Zeleznik-Le for their efforts in facilitating medical student research programs at the Stritch School of Medicine. The authors also acknowledge the support of the Cardiovascular Institute of the Health Sciences Division of Loyola University Chicago. This study was partly funded through grant number NIAID T35 AI125220.
Footnotes
Ethics and Patient Consent: Ethical approval to collect residual blood samples from the clinical laboratories was granted by the Institutional Review Board of the (IRB# 9192 0510980).
Declaration of Conflicting Interests: The author(s) declared no potential conflicts of interest with respect to the research, authorship, and/or publication of this article.
Funding: The author(s) received no financial support for the research, authorship, and/or publication of this article.
ORCID iD: Hannah Slovacek, BS  https://orcid.org/0000-0003-0678-9615
Rajan Khanna, BS  https://orcid.org/0000-0003-2784-8856
Pavel Poredos, MD, PhD  https://orcid.org/0000-0002-9913-1419
Peter Poredos, MD, PhD  https://orcid.org/0000-0001-5258-443X
Mateja Jezovnik, MD, PhD  https://orcid.org/0000-0002-5317-0148
Debra Hoppensteadt, PhD  https://orcid.org/0000-0001-9342-4213
Jawed Fareed, PhD  https://orcid.org/0000-0003-3465-2499
References
- 1. Martel-Pelletier J. Pathophysiology of osteoarthritis. Osteoarthritis Cartilage. 2004;12 Suppl A:S31–S33. doi:10.1016/j.joca.2003.10.002 [DOI] [PubMed] [Google Scholar]
- 2. Ruan MZ, Erez A, Guse K, et al. Proteoglycan 4 expression protects against the development of osteoarthritis. Sci Transl Med. 2013;5(176):176ra34. doi:10.1126/scitranslmed.3005409 [DOI] [PMC free article] [PubMed] [Google Scholar]
- 3. Nguyen LT, Sharma AR, Chakraborty C, Saibaba B, Ahn ME, Lee SS. Review of prospects of biological fluid biomarkers in osteoarthritis. Int J Mol Sci. 2017;18(3):601. Published 2017 Mar 12. doi:10.3390/ijms18030601 [DOI] [PMC free article] [PubMed] [Google Scholar]
- 4. Slovacek H, Khanna R, Poredos P, et al. Interrelationship of osteopontin, MMP-9 and ADAMTS4 in patients with osteoarthritis undergoing total joint arthroplasty. Clin Appl Thromb Hemost. 2020;26:1076029620964864. doi:10.1177/1076029620964864 [DOI] [PMC free article] [PubMed] [Google Scholar]
- 5. Alquraini A, Jamal M, Zhang L, Schmidt T, Jay GD, Elsaid KA. The autocrine role of proteoglycan-4 (PRG4) in modulating osteoarthritic synoviocyte proliferation and expression of matrix degrading enzymes. Arthritis Res Ther. 2017;19(1):89. Published 2017 May 8. doi:10.1186/s13075-017-1301-5 [DOI] [PMC free article] [PubMed] [Google Scholar]
- 6. Smith GN, Jr. The role of collagenolytic matrix metalloproteinases in the loss of articular cartilage in osteoarthritis. Front Biosci. 2006;11:3081–3095. Published 2006 Sep 1. doi:10.2741/2034 [DOI] [PubMed] [Google Scholar]
- 7. Meszaros E, Malemud CJ. Prospects for treating osteoarthritis: enzyme-protein interactions regulating matrix metalloproteinase activity. Ther Adv Chronic Dis. 2012;3(5):219–229. doi:10.1177/2040622312454157 [DOI] [PMC free article] [PubMed] [Google Scholar]
- 8. Thorson C, Galicia K, Burleson A, et al. Matrix metalloproteinases and their inhibitors and proteoglycan 4 in patients undergoing total joint arthroplasty. Clin Appl Thromb Hemost. 2019;25:1076029619828113. doi:10.1177/1076029619828113 [DOI] [PMC free article] [PubMed] [Google Scholar]
- 9. Bao JP, Chen WP, Wu LD. Lubricin: a novel potential biotherapeutic approaches for the treatment of osteoarthritis. Mol Biol Rep. 2011;38(5):2879–2885. doi:10.1007/s11033-010-9949-9 [DOI] [PubMed] [Google Scholar]
- 10. Jones AR, Hughes CE, Wainwright SD, Flannery CR, Little CB, Caterson B. Degradation of PRG4/SZP by matrix proteases. Trans Orthop Res Soc. 2003;28:133. [Google Scholar]
- 11. Galicia K, Thorson C, Banos A, et al. Inflammatory biomarker profiling in total joint arthroplasty and its relevance to circulating levels of lubricin, a novel proteoglycan. Clin Appl Thromb Hemost. 2018;24(6):950–959. doi:10.1177/1076029618765090 [DOI] [PMC free article] [PubMed] [Google Scholar]
- 12. Goldring MB. Osteoarthritis and cartilage: the role of cytokines. Curr Rheumatol Rep. 2000;2(6):459–465. doi:10.1007/s11926-000-0021-y [DOI] [PubMed] [Google Scholar]
- 13. Chawla A, Paraoan V, Rabiu R, et al. Determining the stress biomarker profile in patients undergoing total knee replacement and the relationship with outcome at 12 months. Knee. 2019;26(6):1379–1385. doi:10.1016/j.knee.2019.08.010 [DOI] [PubMed] [Google Scholar]
- 14. Fink-Neuboeck N, Lindenmann J, Bajric S, et al. Clinical impact of interleukin 6 as a predictive biomarker in the early diagnosis of postoperative systemic inflammatory response syndrome after major thoracic surgery: a prospective clinical trial. Surgery. 2016;160(2):443–453. doi:10.1016/j.surg.2016.04.004 [DOI] [PubMed] [Google Scholar]
- 15. Porée B, Kypriotou M, Chadjichristos C, et al. Interleukin-6 (IL-6) and/or soluble IL-6 receptor down-regulation of human type II collagen gene expression in articular chondrocytes requires a decrease of Sp1.Sp3 ratio and of the binding activity of both factors to the COL2A1 promoter. J Biol Chem. 2008;283(8):4850–4865. doi:10.1074/jbc.M706387200 [DOI] [PubMed] [Google Scholar]
- 16. Shimura Y, Kurosawa H, Sugawara Y, et al. The factors associated with pain severity in patients with knee osteoarthritis vary according to the radiographic disease severity: a cross-sectional study. Osteoarthritis Cartilage. 2013;21(9):1179–1184. doi:10.1016/j.joca.2013.05.014 [DOI] [PubMed] [Google Scholar]
- 17. Stannus OP, Jones G, Blizzard L, Cicuttini FM, Ding C. Associations between serum levels of inflammatory markers and change in knee pain over 5 years in older adults: a prospective cohort study. Ann Rheum Dis. 2013;72(4):535–540. doi:10.1136/annrheumdis-2011-201047 [DOI] [PubMed] [Google Scholar]
- 18. Ghosh S, Paul S, Bhattacharjee DP, Ghosh P, Chatterjee N. Prognostic value of baseline high-sensitivity C-reactive protein in patients undergoing replacement arthroplasty. JNMA J Nepal Med Assoc. 2009;48(174):144–148. [PubMed] [Google Scholar]
- 19. Maniar RN, Navaneedhan G, Ranvir S, Maniar AR, Dhiman A, Agrawal A. What Is the normal trajectory of interleukin-6 and C-reactive protein in the hours and days Immediately after TKA?. Clin Orthop Relat Res. 2019;477(1):41–46. doi:10.1097/CORR.0000000000000332 [DOI] [PMC free article] [PubMed] [Google Scholar]
- 20. Wang L, Luo J, He S. Induction of MMP-9 release from human dermal fibroblasts by thrombin: involvement of JAK/STAT3 signaling pathway in MMP-9 release. BMC Cell Biol. 2007;8:14. Published 2007 May 7. doi:10.1186/1471-2121-8-14 [DOI] [PMC free article] [PubMed] [Google Scholar]
- 21. Wanderling C, Liles J, Finkler E, et al. Dysregulation of tissue factor, thrombin-activatable fibrinolysis inhibitor, and fibrinogen in patients undergoing total joint arthroplasty. Clin Appl Thromb Hemost. 2017;23(8):967–972. doi:10.1177/1076029617700998 [DOI] [PMC free article] [PubMed] [Google Scholar]
- 22. Chou PY, Su CM, Huang CY, Tang CH. The characteristics of thrombin in osteoarthritic pathogenesis and treatment. Biomed Res Int. 2014;2014:407518. doi:10.1155/2014/407518 [DOI] [PMC free article] [PubMed] [Google Scholar]
- 23. Saberi Hosnijeh F, Siebuhr AS, Uitterlinden AG, et al. Association between biomarkers of tissue inflammation and progression of osteoarthritis: evidence from the Rotterdam study cohort. Arthritis Res Ther. 2016;18:81. Published 2016 Apr 1. doi:10.1186/s13075-016-0976-3 [DOI] [PMC free article] [PubMed] [Google Scholar]
- 24. Flowers SA, Zieba A, Örnros J, et al. Lubricin binds cartilage proteins, cartilage oligomeric matrix protein, fibronectin and collagen II at the cartilage surface. Sci Rep. 2017;7(1):13149. Published 2017 Oct 13. doi:10.1038/s41598-017-13558-y [DOI] [PMC free article] [PubMed] [Google Scholar]
- 25. O’Brien ER, Garvin MR, Stewart DK, et al. Osteopontin is synthesized by macrophage, smooth muscle, and endothelial cells in primary and restenotic human coronary atherosclerotic plaques. Arterioscler Thromb. 1994;14(10):1648–1656. doi:10.1161/01.atv.14.10.1648 [DOI] [PubMed] [Google Scholar]
- 26. Lindsey ML, Zouein FA, Tian Y, Padmanabhan Iyer R, de Castro Brás LE. Osteopontin is proteolytically processed by matrix metalloproteinase 9. Can J Physiol Pharmacol. 2015;93(10):879–886. doi:10.1139/cjpp-2015-0019 [DOI] [PMC free article] [PubMed] [Google Scholar]


