

Abstract
Background
Echocardiographic measurements play an important role in detecting cardiac enlargement and assessing cardiac function. In human cardiology, M‐mode measurements have been widely replaced by volumetric measurements of the left ventricle (LV) using Simpson's method of disc (SMOD). In veterinary cardiology, more large‐scale studies are necessary to generate reference intervals (RIs) for SMOD LV volume measurements.
Objective
To generate body size independent RIs for LV volume measurements in dogs.
Animals
Healthy adult dogs (n = 1331) of variable size and somatotype.
Methods
Prospective study. The SMOD was measured from the right parasternal long axis and the left apical 4‐chamber view in clinically healthy dogs. The SMOD measurements were normalized to various allometric scales (kg, kg2/3, or kg1/3). RIs for LV end‐diastolic volume (LVEDV) and LV end‐systolic volume (LVESV) using SMOD were estimated as prediction intervals of both a linear and an additive regression model. Additionally, after normalization to body weight, 95% RIs were determined using nonparametric methods with 2.5 and 97.5 percentiles serving as the lower and upper limits. Separate analyses were performed for 120 sighthound breeds and 1211 other breeds.
Results
Echocardiographic LV volumes correlated best with weight in kilograms. The additive model proved to be more flexible and accurate than the other 2 methods to generate RIs. Separate RIs for sighthound and all other breeds are provided.
Conclusions and Clinical Importance
Body size and breed‐independent RIs for LV volume measurements using SMOD were generated prospectively from a large and diverse population of dogs and are available for clinical use.
Keywords: canine, echocardiography, heart dimensions, reference values, volumetric measurements
Abbreviations
- 3D
3‐dimensional
- A4C view
apical 4‐chamber view
- ASVCP
American Society for Veterinary Clinical Pathology
- BW
body weight in kg
- BSA
body surface area
- DCM
dilated cardiomyopathy
- LV
left ventricle
- LVEDV
left ventricular end‐diastolic volume
- LVEDV‐I
left ventricular end‐diastolic volume indexed to body weight (kg)
- LVESV
left ventricular end‐systolic volume
- LVESV‐I
left ventricular end‐systolic volume indexed to body weight (kg)
- PI
prediction intervals
- PLAX
parasternal long axis
- RI
reference interval
- SMOD
Simpson's method of discs
- UKC
United Kennel Club
1. INTRODUCTION
Echocardiographic measurements of the left ventricle (LV) are important to evaluate the development and progression of heart disease. Mitral valve degeneration and dilated cardiomyopathy (DCM) are the most common acquired heart diseases in dogs, both leading to changes in the diastolic and systolic volumes of the LV as the disease progresses. 1 , 2 , 3 Linear measurements have their limitations, and M‐mode‐derived parameters that calculate cardiac volumes, such as the Teichholz formula, may be inaccurate when converting a 1‐dimensional linear measurement to a 3‐dimensional (3D) volume. 4 , 5 The formula assumes the heart to be elliptical, 6 but heart shape can differ because of the large variety of dog breeds, and also in the presence of disease. 7 The Teichholz or Quinones methods of calculating LV volumes and ejection fraction (EF) from LV linear dimensions may result in inaccuracies because of the geometric assumptions required to convert a linear measurement to a 3D volume. 4 , 8 , 9 , 10 Accordingly, in human medicine, the American Society of Echocardiography no longer recommends linear‐based measurements for calculation of LV volumes and EF, but recommends volumetric measurements using the Simpson's method of discs (SMOD) and 3D echocardiography (if available). 11 Using SMOD, heart volume is measured as the summation of parallel cylinders, the diameters of which are derived from endocardial border tracing performed on 1 or 2 orthogonal LV apical views. The underlying principle of this method is the calculation of LV volume from the summation of a stack of elliptical discs. The endocardial borders of the LV are traced, and the length of the ventricle is defined by the distance between the mitral annulus and the apex. The ultrasound system divides the area into equally sized elliptical discs and the volume is calculated by summating them.
The volumes calculated by SMOD show good correlation with measurements by 3D echocardiography and computed tomography‐derived volume measurements. 12 , 13
The major advantage of the SMOD over M‐mode in the detection of early changes in cardiac chamber sizes in Doberman Pinschers affected by DCM has already been demonstrated. 14 It is therefore considered the best clinical practice to detect the echocardiographic changes related to DCM in Doberman Pinschers. 1 , 14 Reference intervals (RIs) for SMOD already have been published for several predisposed breeds, 14 , 15 , 16 , 17 and in a study using right parasternal images for SMOD measurements in 122 healthy dogs, including many different breeds. 18
Our hypothesis was that, using a large number of different breeds of different sizes and weights, generally applicable RIs from different imaging planes could be generated, if the measurements obtained could be related to body weight (BW), size, or other allometric scaling. Our aim was to establish RIs that can be used individually for every dog, independent of BW, breed, and size.
2. MATERIALS AND METHODS
2.1. Animals
Our study included dogs that were referred for cardiac evaluation or came for screening examinations to the Cardiology Department of the Ludwig‐Maximilian University, Munich, or were recruited for the study between 2004 and 2015 and were classified as echocardiographically healthy. The recruited dogs came from students, faculty and by promoting the study at dog shows and breeding associations, and dogs were prospectively included. The echocardiographic examination had to be complete regarding the measurements, and BW needed to be documented. The examination included at least 1 right parasternal long‐axis view (PLAX view) and one left apical 4‐chamber view (A4C view) and spectral Doppler measurements of the velocity of aortic and pulmonic flow using continuous or pulsed wave Doppler, as well as color Doppler examinations of all valves. Dogs had to be at least 1 year old because previous echocardiographic studies showed differences in wall thickness and LV diameters in growing dogs as compared with adult individuals. 19
A complete medical history was taken, and a thorough clinical examination was performed before the echocardiographic examination was done.
Exclusion criteria were as follows: (a) pathologic heart murmur, gallop sound, or non‐sinus arrhythmia; (b) cardiac abnormalities identified on 2D echocardiography, M‐mode, and Doppler echocardiographic examinations, such as congenital or acquired cardiac diseases; (c) current or recent evidence of any systemic illness based on history and physical examination; (d) medications known to affect the cardiovascular system; and (e) uncooperative temperament for echocardiography. Trivial valvular insufficiencies identified on color Doppler were acceptable.
2.2. Echocardiographic examination
Dogs were examined in right and left lateral recumbency without sedation. Echocardiographic examination was performed using a 2.0/3.5 or 4.0/8.0 MHz transducer and simultaneous ECG recording (Vivid 7 and Vivid 7‐dimension, General Electric Medical System, Waukesha, Wisconsin). The complete echocardiographic examination was digitally stored and evaluated afterwards offline (EchoPac Clinical Workstation Software, General Electric Medical System, Waukesha, Wisconsin). Imaging and measurements were carried out by an ACVIM diplomate (cardiology, Gerhard Wess) or cardiology residents under his supervision. Examination followed the guidelines of the Echocardiography Committee of the Specialty of Cardiology, American College of Veterinary Internal Medicine. 20
First, the heart was subjectively assessed for volume status and systolic function using 2D image loops. Morphology of the valves and any irregularities were noted before measurements. Aortic and pulmonic flow velocity was measured by continuous or pulsed wave Doppler and had to be <2 m/s and without hemodynamically relevant turbulence on color‐flow Doppler. Color Doppler was also used to screen for congenital or acquired cardiac diseases.
M‐mode measurements were obtained from the PLAX or LV short‐axis view, and dogs classified as having normal cardiac measurements according to breed‐specific RIs were included. 14 , 15 , 16 , 17 , 21 , 22 , 23 , 24 , 25 , 26 , 27 , 28 , 29 , 30 , 31 , 32 , 33 , 34 , 35 , 36 , 37 , 38 , 39 , 40 , 41 , 42 , 43 , 44 , 45 If no breed‐specific RIs were available, previously published RIs were used as supportive information about normal cardiac size, but these investigators based the assessment of normality on the interpretation of their results at their own discretion, and by systematically excluding all possible cardiac abnormalities. 46 To avoid that the new reference values would be established based on a 95% prediction interval (PI), the study population was completed by another 5% of dogs that were subjectively healthy and had just slight deviations above or below the previously published PIs. 46
For the SMOD measurements, echo loops with at least 3 consecutive cardiac cycles were chosen, and the LV had to be completely displayed. The LV volume determined by SMOD was measured either directly or offline afterwards in the PLAX view and in the A4C view, with the aorta not being visible in either view, by tracing the endocardial border on each selected image. The frame used to measure the LV end‐diastolic volume (LVEDV) was selected from the frames around the onset of the QRS complex, when the mitral valve was closed and the volume at its largest (which might not have been exactly at onset of the QRS complex) and the frame used to measure the LV end systolic volume (LVESV) was selected as the last frame before mitral valve opening, typically after the end of the T wave, where the volume was at its smallest. 1 In the chosen frame, endocardial borders were traced starting from the anterior valve leaflet to the posterior valve leaflet and a line was drawn across the mitral annulus to mark the area of the LV. The maximum length of the LV was defined by the distance between the mitral annulus and the apex. A mathematical algorithm divided this area into equal discs, and LV volume was calculated by the following formula:
where n corresponds to the number of discs, L stands for the LV length, and a and b correlate with the diameter of the discs. 6
The value used to generate reference values was established using the mean of 3 consecutive measurements.
2.3. Statistical analysis
Statistical analysis was performed using commercially available software (PASW Statistics, Version 25.0.0, IBM Corporation, Armonk, New York; MedCalc Version 15.6, Ostend, Belgium) and the open‐source software R (R Core Team, Vienna, Austria). Following the Guidelines for the Determination of Reference Intervals in Veterinary Species by the American Society of Veterinary Clinical Pathology (ASVCP), 47 all variables were evaluated for possible outliers by Horn's algorithm using Tukey's interquartile ranges 48 and, if necessary, excluded. Respective measurements (ie, statistical outliers) only were considered for removal if an obvious measurement error was thought to have occurred.
Intraobserver measurement variability was quantified by calculating coefficients of variation (CV) based on 2 measurements of 20 patients on 2 different days, chosen by an independent statistician. The observer was blinded to the previous measurements. Comparisons between measurements from the right PLAX view and the left A4C view were conducted using a Wilcoxon test. Limits of agreement were analyzed and graphically displayed using a Bland‐Altman plot. 49 Theoretically, volumetric measurements should relate best with BW, but the relationships with body length (kg1/3) and body surface area (BSA; kg2/3) also were calculated as reported in previous studies. 46
The LV volumetric RIs were estimated using a regression model on the logarithmatized LV volume. The logarithmic transformation was performed because the original distribution of the data was substantially skewed. Values were transformed back for calculation of the RIs. To determine if BW linearly influences the response parameter, the model was estimated both as a linear regression model and as an additive model with a potentially nonlinear effect. The nonlinear effect was estimated using a P‐spline basis. 50 The models were of the form:
where yi refers to the LV volume of dog i, β0 in the formula mentioned earlier corresponds to the intercept (the intersection at the ordinate), f corresponds to the linear or smooth effect of weight that is to be estimated, and εi refers to the unexplained error for dog i, where the errors are assumed independent and identically distributed (iid). The additive model was estimated using the function gam from the R package mgcv 50 . Reference intervals are estimated as 95% PIs, which were calculated as previously described. 50
For the linear model where f(weighti) = β1 * weighti 95% PIs for a specific value weight0 are estimated as follows:
where and are the estimated regression coefficients, tn − 2(0.975) is the 97.5% quantile of the t‐distribution, and is the estimated SD of the predicted value as previously described. 50 Prediction intervals for the nonlinear model were estimated in a corresponding manner.
Comparison between the linear and additive version of the regression model was performed using a likelihood‐ratio test. 50 In all analyses, a P value <.05 was considered significant.
Additionally, LVEDV and LVESV measurements first were indexed to BW in kilograms (LVEDV‐I, LVESV‐I) and then RI values were calculated using the nonparametric percentile method as recommended by the Guidelines for the Determination of Reference Intervals in Veterinary Species by the ASVCP 47 and the Clinical and Laboratory Standards Institute (CLSI) guidelines for establishing RIs. 51 The 2.5th and 97.5th percentiles were defined as the lower and upper reference limits, respectively. As recommended, 90% confidence intervals (CIs) around these limits also were determined. 47 , 51
3. RESULTS
A total of 1331 dogs were enrolled in the study. The population consisted of 128 different breeds and many mixed breeds (Table 1). Six‐hundred sixty‐seven dogs were female (338 spayed) and 654 were male (226 neutered). Age varied between 1 and 16.9 years with a median of 6.16 years. Median weight was 24.7 kg (range, 1.5‐87.5 kg). As stated in Section 2, we wanted to avoid including only dogs in the 95% RI of a pervious study 46 or breed‐specific RIs, which also were a population of 1263 healthy dogs (based on the reference values previously published). Therefore, 68 dogs (34 dogs each from the 2.5% above and below the reference values) were added to the 1263 dogs to build the study population of 1331 dogs (100%).
TABLE 1.
Distribution of breeds
| Breed | Number of animals | Median weight | Minimum weight | Maximum weight |
|---|---|---|---|---|
| Afghan Hound | 5 | 32.5 | 30.4 | 38.6 |
| Airedale Terrier | 2 | 28.6 | 27.2 | 30 |
| Akita | 1 | 43 | 43 | 43 |
| Alaskan Malamute | 3 | 40 | 37 | 53.1 |
| Australian Cattle Dog | 1 | 27.3 | 27.3 | 27.3 |
| Australian Shepherd | 34 | 21 | 12.8 | 33 |
| Basenji | 1 | 9.8 | 9.8 | 9.8 |
| Basset Hound | 2 | 19.6 | 18.1 | 21 |
| Bavarian Mountain Scent Dog | 6 | 20 | 19 | 28.4 |
| Beagle | 13 | 14 | 7 | 25.8 |
| Bearded Collie | 5 | 20 | 18.4 | 25 |
| Belgian Shepherd Dog | 4 | 27.2 | 23 | 31.5 |
| Berger de Beauce | 1 | 35 | 35 | 35 |
| Bernese Mountain Dog | 17 | 43 | 34 | 57.3 |
| Bichon Frise | 3 | 4.6 | 2.2 | 12 |
| Bloodhound | 1 | 36 | 36 | 36 |
| Bolognese | 2 | 4.6 | 4.5 | 4.6 |
| Border Collie | 12 | 20.6 | 16.8 | 26.3 |
| Border Terrier | 2 | 7.7 | 7 | 8.4 |
| Borzoi | 16 | 33.8 | 24.2 | 40.7 |
| Boston Terrier | 2 | 8 | 6 | 10 |
| Boxer | 26 | 28 | 20.7 | 39.5 |
| Briard | 4 | 36.6 | 29 | 43 |
| Brittany Spaniel | 1 | 24 | 24 | 24 |
| Bull Terrier | 3 | 22 | 20.6 | 25 |
| Bulldog | 3 | 46 | 37.7 | 46 |
| Cairn Terrier | 2 | 10.2 | 8.9 | 11.4 |
| Cavalier King Carles Spaniel | 16 | 8.3 | 5.9 | 11.4 |
| Chesapeake Bay Retriever | 1 | 42.8 | 42.8 | 42.8 |
| Chihuahua | 27 | 3.1 | 1.7 | 5 |
| Chow Chow | 1 | 29 | 29 | 29 |
| Collie Rough | 5 | 26.6 | 22 | 44.2 |
| Continental Toy Spaniel | 2 | 4.1 | 2.7 | 5.4 |
| Coton de Tulear | 1 | 5 | 5 | 5 |
| Dachshund | 30 | 8.1 | 5.4 | 13.8 |
| Dalmatian | 6 | 33.5 | 26 | 40 |
| Deerhound | 2 | 35.2 | 33.8 | 36.5 |
| Doberman Pinscher | 26 | 33.8 | 25 | 41.2 |
| Dogue de Bordeaux | 2 | 49.1 | 40 | 58.2 |
| Dutch Schapendoes | 1 | 19.6 | 19.6 | 19.6 |
| Dutch Shepherd Dog | 1 | 25 | 25 | 25 |
| English Cocker Spaniel | 20 | 14.6 | 9.4 | 17.2 |
| English Pointer | 2 | 26.4 | 24.8 | 28 |
| English Springer Spaniel | 1 | 26.8 | 26.8 | 26.8 |
| Entlebucher Sennenhund | 6 | 26.3 | 15.8 | 31 |
| Eurasian | 1 | 20.4 | 20.4 | 20.4 |
| Field Spaniel | 1 | 13 | 13 | 13 |
| Fila Brasileiro | 1 | 43 | 43 | 43 |
| Flat Coated Retriever | 6 | 34.9 | 25.4 | 39 |
| Foxterrier | 1 | 13 | 13 | 13 |
| French Bulldog | 19 | 11.7 | 7.6 | 15.6 |
| German Hound | 3 | 26 | 18.8 | 30.4 |
| German Hunting Terrier | 2 | 8.8 | 7.8 | 9.8 |
| German Longhaired Pointer | 3 | 36 | 25 | 38 |
| German Pinscher | 2 | 10.9 | 6.8 | 15 |
| German Shepherd Dog | 36 | 32.9 | 23 | 42 |
| German Shorthaired Pointer | 10 | 30 | 21.6 | 37 |
| German Spitz | 8 | 10.2 | 8.4 | 12 |
| German Wirehaired Pointer | 7 | 31 | 27 | 35 |
| Golden Retriever | 65 | 32 | 13.6 | 46.2 |
| Great Dane | 37 | 64.4 | 37 | 86 |
| Great Swiss Mountain Dog | 1 | 57 | 57 | 57 |
| Greyhound | 14 | 32 | 24 | 43.8 |
| Griffon Vendeen | 1 | 25 | 25 | 25 |
| Havanese | 2 | 5.7 | 5.4 | 5.9 |
| Hovawart | 10 | 39.9 | 28.2 | 47 |
| Hungarian Greyhound | 7 | 22 | 20 | 33 |
| Hungarian Pointer | 1 | 30.2 | 30.2 | 30.2 |
| Ibizan Podenco | 2 | 18.7 | 16.5 | 20.9 |
| Irish Red Setter | 5 | 29 | 23 | 35 |
| Irish Soft Coated Wheaten Terrier | 1 | 18.7 | 18.7 | 18.7 |
| Irish Wolfhound | 17 | 57.4 | 42 | 87.5 |
| Italian Corso Dog | 1 | 48 | 48 | 48 |
| Italian Sighthound | 4 | 5.6 | 4.9 | 8 |
| Jack Russell Terrier | 28 | 7.6 | 4.8 | 12 |
| Kerry Blue Terrier | 1 | 15.9 | 15.9 | 15.9 |
| Kuvasz | 3 | 49 | 39.8 | 56 |
| Labrador Retriever | 66 | 30.8 | 20 | 47.6 |
| Lakeland Terrier | 1 | 13 | 13 | 13 |
| Leonberger | 9 | 55.6 | 50 | 82.8 |
| Lhasa Apso | 2 | 9 | 8.2 | 9.8 |
| Maltese | 6 | 6.4 | 4.8 | 8.8 |
| Maremma (and the Abruzzes) Sheepdog | 3 | 53 | 39.6 | 68 |
| Mastino Napoletano | 1 | 43 | 43 | 43 |
| Miniature Pinscher | 8 | 4.8 | 4 | 7.5 |
| Miniature Schnauzer | 2 | 7.1 | 5.6 | 8.5 |
| Mixed Breed | 337 | 23 | 4 | 65.5 |
| Newfoundland | 15 | 60 | 45 | 66 |
| Norwegian Buhund | 1 | 14.2 | 14.2 | 14.2 |
| Nova Scotia Duck Tolling Retriever | 1 | 20.6 | 20.6 | 20.6 |
| Old English Sheepdog | 1 | 39.6 | 39.6 | 39.6 |
| Parson Russell Terrier | 2 | 8.9 | 7.7 | 10 |
| Pekingese | 1 | 3.6 | 3.6 | 3.6 |
| Polish Greyhound | 2 | 33 | 31.6 | 34.3 |
| Polish Lowland Sheepdog | 4 | 17.5 | 16 | 22 |
| Poodle | 12 | 7.4 | 5 | 14.6 |
| Portuguese Podengo | 1 | 6.6 | 6.6 | 6.6 |
| Pug | 17 | 8.1 | 4.7 | 12.7 |
| Pumi | 1 | 25 | 25 | 25 |
| Pyrenean Sheepdog | 1 | 22.2 | 22.2 | 22.2 |
| Rhodesian Ridgeback | 10 | 38.6 | 27 | 47 |
| Romagna Water Dog | 1 | 17 | 17 | 17 |
| Rottweiler | 11 | 44 | 33 | 70 |
| Russian‐European Laika | 1 | 27.5 | 27.5 | 27.5 |
| Saluki | 24 | 22.7 | 16 | 30.5 |
| Samoyed | 1 | 22 | 22 | 22 |
| Schnauzer | 13 | 9 | 6 | 12 |
| Scottish Terrier | 1 | 11 | 11 | 11 |
| Shar Pei | 2 | 21.5 | 21 | 22 |
| Shetland Sheepdog | 3 | 5.8 | 5 | 8.6 |
| Shiba | 2 | 10.3 | 8.6 | 11.9 |
| Shih Tzu | 6 | 7 | 5 | 8 |
| Siberian Husky | 7 | 25.1 | 16 | 30.8 |
| Skye Terrier | 1 | 16 | 16 | 16 |
| Sloughi | 5 | 27.7 | 22.9 | 32.3 |
| Small Münsterländer | 4 | 26 | 22 | 30 |
| Spanish Greyhound | 4 | 25.4 | 20 | 28.3 |
| Spanish Water Dog | 1 | 19 | 19 | 19 |
| St. Bernhard | 4 | 57.5 | 46.9 | 67 |
| Staffordshire Bull Terrier | 3 | 19.4 | 18.2 | 26.8 |
| Tatra Shepherd Dog | 1 | 50.5 | 50.5 | 50.5 |
| Tibetan Terrier | 2 | 14.1 | 12.6 | 15.5 |
| Weimaraner | 1 | 34 | 34 | 34 |
| Welsh Terrier | 1 | 7.6 | 7.6 | 7.6 |
| West Highland White Terrier | 35 | 9 | 5.8 | 15 |
| Whippet | 24 | 13 | 10.8 | 17.7 |
| White Swiss Shepherd Dog | 3 | 41.6 | 27.6 | 43 |
| Yorkshire Terrier | 44 | 3.4 | 1.5 | 9.2 |
Note: Sorted by alphabet including mean value and weight span of each breed. Only breeds acknowledged by the FCI are listed, any others are summarized under mixed breeds. Sighthound breeds classified after the FCI group 10 are underlined.
Abbreviation: FCI, Fédération Cynologique Internationale.
After the first analysis, the study population was separated into 2 groups. Group 1 included only dogs belonging to sighthound breeds (120 animals), and group 2 included all other dogs (1211 animals).
Intraobserver measurement variability was good with 3.46% and 8.62% for PLAX view in diastole and systole, and 4.11% and 4.87% for left A4C view in diastole and systole, respectively.
Volumes obtained from PLAX and left A4C views were significantly different (LVEDV, P = .004; LVESV, P < .0001). However, the mean difference was only 0.2 mL (LVEDV) and 1.2 mL (LVESV). Bland‐Altman analysis showed no systematic underestimation or overestimation with a median of 0.3 (LVEDV) and −0.6 (LVESV) and limits of agreement of −5.8 mL to 6.3 mL in diastole and −5.4 mL to 4.3 mL in systole (Figure 1). For further analyses, mean volumes from right parasternal and left apical views were calculated (LVEDV biplane, LVESV biplane) and used to create the RIs. The linear regressions of LVEDV with the scaling parameters such as BW in kilograms, BSA (kg2/3) in square meters, and body length in meters (kg1/3) are displayed in Figure 2; LVESV showed comparable results. The graphical display comparing the linear regression model using the additive model with their PIs in Figure 3 shows that the additive model fits better to the available data, with a slight curvilinear curve, than the linear regression model (Figure 3). The likelihood ratio test showed that the goodness of fit was significantly different (P < .001) between both models, confirming that the relationship is nonlinear. Results of the weight‐based RI for LVEDV and LVESV obtained by SMOD using the RIs of the additive model are shown in Table 2 for all non‐sighthound breeds and Table 3 for sighthound breeds. The RIs for LVEDV‐I and LVESV‐I, calculated after normalizing the LV volumes to BW, are provided separately for non‐sighthound breeds and sighthound breeds, as well as EF for both the right PLAX and the left A4C views in Table 4. The EF exhibited a weak negative correlation with BW (−0.39; P < .001). In Figure 4, normalized LVEDV‐I and LVESV‐I values are plotted in a scatter diagram with a regression line and 95% PI for the regression curve against the BW.
FIGURE 1.
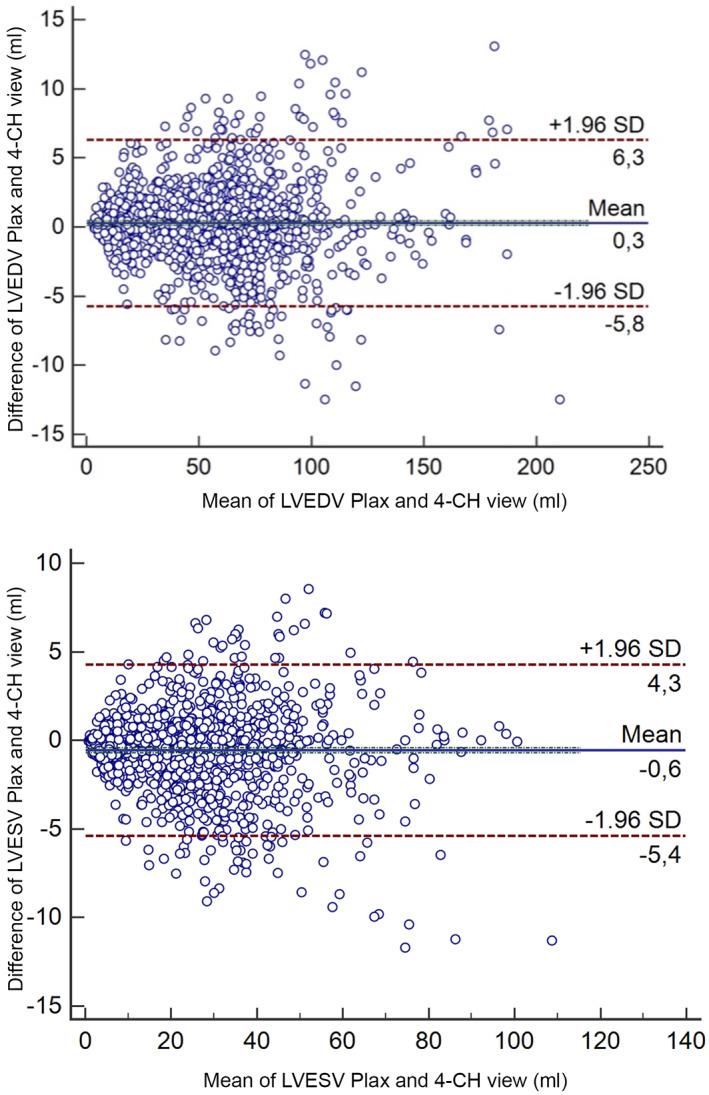
Bland‐Altman graphs showing good correlation between LVEDV and LVESV obtained from the right parasternal long‐axis view and left apical 4‐chamber view. LVEDV, left ventricular end‐diastolic volume; LVESV, left ventricular end‐systolic volume
FIGURE 2.
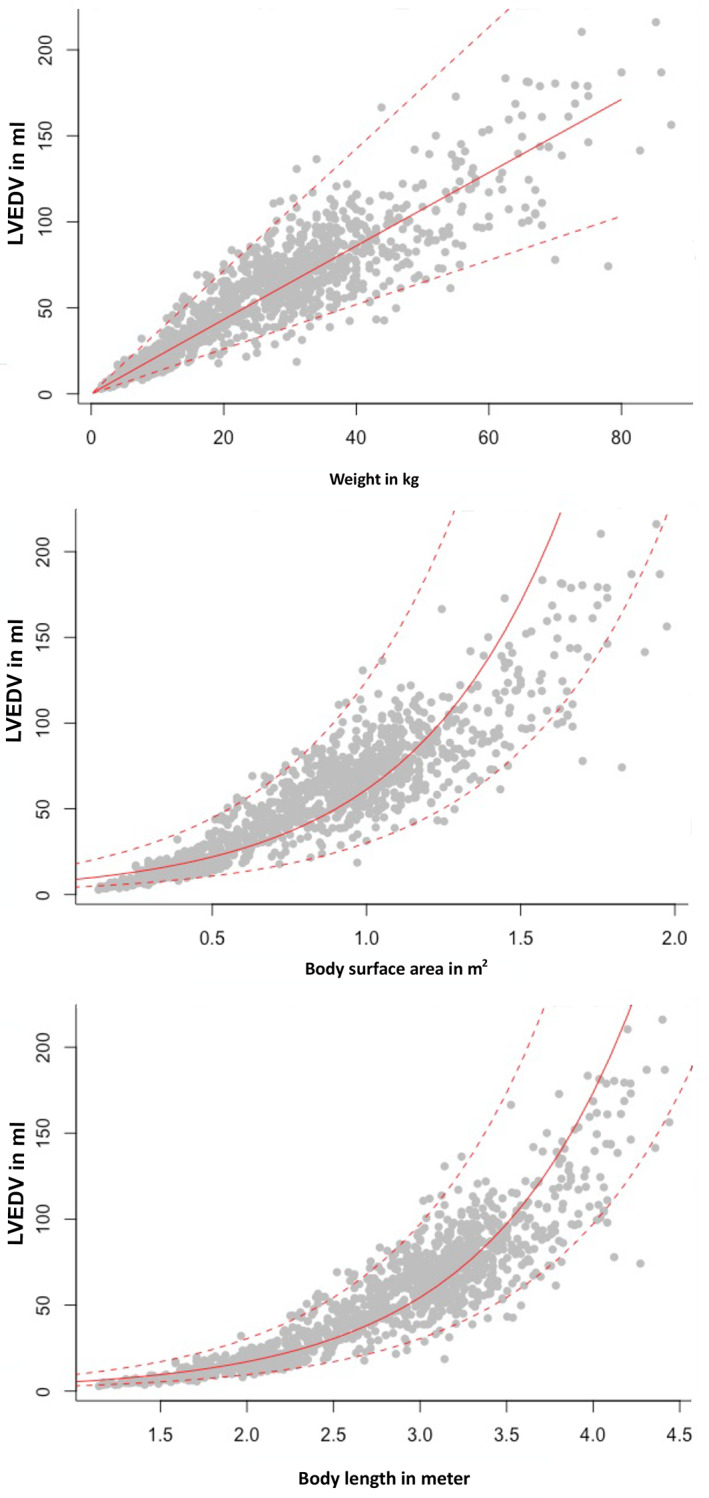
Linear regression model of LVEDV with the scaling parameters such as body weight in kilograms, body surface area in square meters (kg2/3), and body length in meters (kg1/3). LVEDV, left ventricular end‐diastolic volume
FIGURE 3.
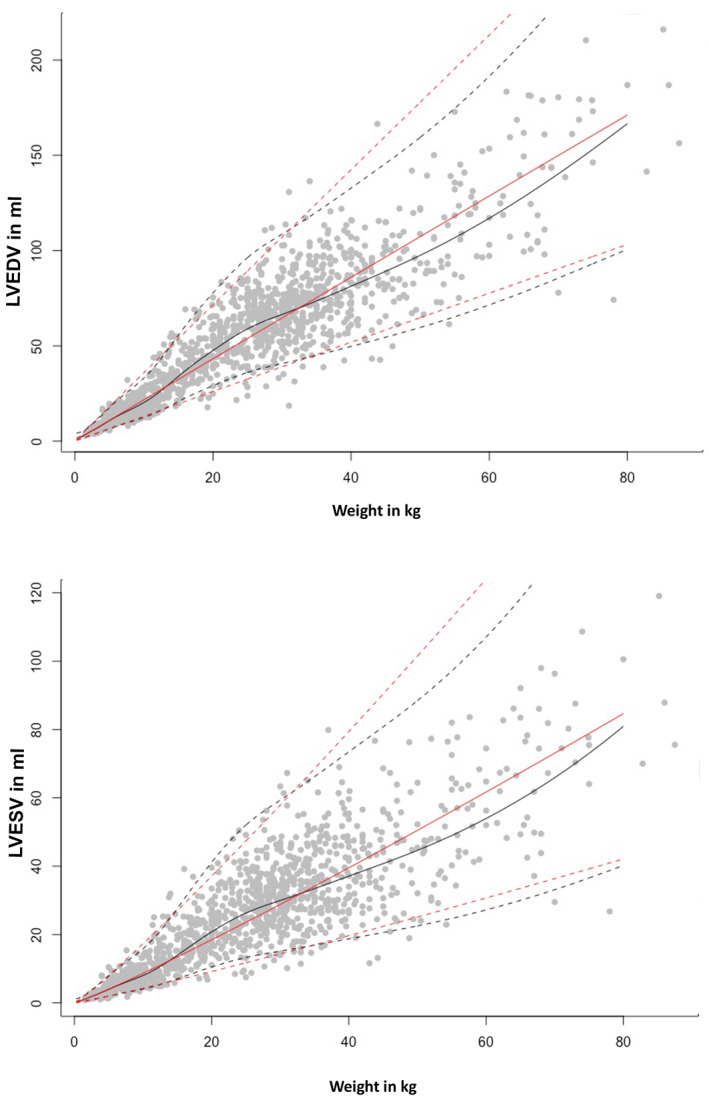
Comparison between the linear regression (red lines) and the additive model (black lines) for LVEDV and LVESV. Upper and lower prediction intervals are marked with dotted lines, the median is displayed as a continuous line. Gray dots are representing the study population. LVEDV, left ventricular end‐diastolic volume; LVESV, left ventricular end‐systolic volume
TABLE 2.
Prediction intervals (PI) for non‐sighthound breeds, estimated as 95% PIs for left ventricular end‐diastolic and end‐systolic volumes in milliliters, measured by Simpson method of discs
| Diastole | Systole | |||
|---|---|---|---|---|
| Body weight | Lower PI | Upper PI | Lower PI | Upper PI |
| 1 | 1.4 | 4.7 | 0.4 | 1.5 |
| 2 | 2.8 | 7.2 | 0.9 | 2.3 |
| 3 | 4.0 | 10.1 | 1.4 | 3.5 |
| 4 | 5.4 | 13.3 | 1.9 | 4.8 |
| 5 | 6.8 | 16.8 | 2.5 | 6.2 |
| 6 | 8.1 | 20.1 | 3.1 | 7.6 |
| 7 | 9.3 | 23.1 | 3.6 | 9.0 |
| 8 | 10.4 | 25.8 | 4.1 | 10.1 |
| 9 | 11.4 | 28.2 | 4.4 | 11.0 |
| 10 | 12.4 | 30.8 | 4.8 | 11.8 |
| 11 | 13.6 | 33.8 | 5.2 | 13.0 |
| 12 | 15.0 | 37.3 | 5.8 | 14.4 |
| 13 | 16.6 | 41.2 | 6.5 | 16.2 |
| 14 | 18.4 | 45.5 | 7.3 | 18.2 |
| 15 | 20.2 | 50.1 | 8.2 | 20.3 |
| 16 | 22.0 | 54.6 | 9.1 | 22.5 |
| 17 | 23.8 | 59.0 | 9.9 | 24.7 |
| 18 | 25.6 | 63.4 | 10.8 | 26.9 |
| 19 | 27.3 | 67.6 | 11.7 | 29.1 |
| 20 | 29.0 | 71.8 | 12.5 | 31.2 |
| 22.5 | 32.9 | 81.4 | 14.4 | 35.8 |
| 25 | 36.2 | 89.6 | 16.0 | 39.7 |
| 27.5 | 38.8 | 96.1 | 17.3 | 42.9 |
| 30 | 41.1 | 101.6 | 18.4 | 45.6 |
| 32.5 | 43.3 | 107.1 | 19.5 | 48.2 |
| 35 | 45.5 | 112.6 | 20.5 | 50.8 |
| 37.5 | 47.8 | 118.3 | 21.5 | 53.3 |
| 40 | 50.1 | 124.0 | 22.5 | 56.0 |
| 42.5 | 52.4 | 129.9 | 23.6 | 58.7 |
| 45 | 54.8 | 135.8 | 24.8 | 61.5 |
| 47.5 | 57.3 | 142.0 | 26.0 | 64.5 |
| 50 | 59.9 | 148.5 | 27.2 | 67.8 |
| 52.5 | 62.7 | 155.4 | 28.6 | 71.3 |
| 55 | 65.6 | 162.8 | 30.1 | 75.0 |
| 57.5 | 68.7 | 170.7 | 31.6 | 79.0 |
| 60 | 72.1 | 179.0 | 33.3 | 83.3 |
| 62.5 | 75.6 | 187.9 | 35.1 | 87.8 |
| 65 | 79.3 | 197.4 | 37.0 | 92.7 |
| 67.5 | 83.3 | 207.4 | 39.0 | 98.0 |
| 70 | 87.4 | 218.1 | 41.1 | 103.6 |
| 72.5 | 91.7 | 229.4 | 43.2 | 109.7 |
| 75 | 96.1 | 241.6 | 45.4 | 116.3 |
| 77.5 | 100.6 | 254.6 | 47.6 | 123.6 |
| 80 | 105.2 | 268.6 | 49.8 | 131.6 |
Note: Assorted by weight in kilograms.
TABLE 3.
Prediction intervals (PI) for sighthound breeds, estimated as 95% PIs for left ventricular end‐diastolic and end‐systolic volumes in milliliter, measured by SMOD
| Diastole | Systole | |||
|---|---|---|---|---|
| Body weight | Lower PI | Upper PI | Lower PI | Upper PI |
| 1 | 2.4 | 12.9 | 0.9 | 5.1 |
| 2 | 3.4 | 14.7 | 1.3 | 5.9 |
| 3 | 4.9 | 16.9 | 1.9 | 6.9 |
| 4 | 6.7 | 19.7 | 2.7 | 8.3 |
| 5 | 9.1 | 23.7 | 3.8 | 10.1 |
| 6 | 11.8 | 29.0 | 5.0 | 12.5 |
| 7 | 14.7 | 35.3 | 6.3 | 15.4 |
| 8 | 17.5 | 41.6 | 7.6 | 18.3 |
| 9 | 20.1 | 47.3 | 8.9 | 21.0 |
| 10 | 22.4 | 52.5 | 10.0 | 23.5 |
| 12.5 | 28.3 | 65.4 | 12.8 | 29.8 |
| 15 | 33.8 | 78.0 | 15.5 | 35.9 |
| 17.5 | 38.8 | 89.5 | 18.0 | 41.6 |
| 20 | 43.3 | 99.9 | 20.2 | 46.8 |
| 22.5 | 47.4 | 109.1 | 22.3 | 51.5 |
| 25 | 50.9 | 117.2 | 24.2 | 55.7 |
| 27.5 | 54.1 | 124.3 | 25.8 | 59.5 |
| 30 | 57.2 | 131.3 | 27.5 | 63.1 |
| 32.5 | 60.6 | 139.2 | 29.2 | 67.1 |
| 35 | 64.3 | 147.7 | 30.9 | 71.2 |
| 37.5 | 68.1 | 156.5 | 32.7 | 75.4 |
| 40 | 71.6 | 165.0 | 34.4 | 79.4 |
| 42.5 | 74.7 | 172.4 | 35.8 | 82.9 |
| 45 | 77.4 | 178.8 | 37.1 | 85.9 |
| 47.5 | 79.8 | 184.5 | 38.2 | 88.6 |
| 50 | 82.1 | 189.9 | 39.3 | 91.1 |
| 52.5 | 84.4 | 195.4 | 40.3 | 93.8 |
| 55 | 86.7 | 201.0 | 41.4 | 96.5 |
| 57.5 | 89.0 | 206.7 | 42.6 | 99.3 |
| 60 | 91.4 | 212.6 | 43.7 | 102.3 |
| 62.5 | 93.7 | 218.7 | 44.9 | 105.4 |
| 65 | 96.1 | 224.9 | 46.0 | 108.6 |
| 67.5 | 98.4 | 231.4 | 47.2 | 112.0 |
| 70 | 100.7 | 238.2 | 48.3 | 115.6 |
| 72.5 | 102.9 | 245.3 | 49.5 | 119.4 |
| 75 | 105.1 | 252.8 | 50.6 | 123.5 |
| 77.5 | 107.1 | 260.7 | 51.7 | 127.9 |
| 80 | 109.0 | 269.2 | 52.7 | 132.6 |
Note: Assorted by weight in kilograms.
Abbreviation: SMOD, Simpson method of disc.
TABLE 4.
Proposed reference intervals for left ventricular volume measurements normalized to body weight using the Simpson method of discs and ejection fraction in 1211 non‐sighthound breeds and 120 sighthound breeds
| Variable | Non‐sighthound dogs Median | 95% reference interval 2.5 centile (90% CI) to 97.5 centile (90% CI) | Sighthound breeds Median | 95% reference interval 2.5 centile (90% CI) to 97.5 centile (90% CI) |
|---|---|---|---|---|
|
LVEDV‐I (mL/kg) PLAX view |
2.15 | 1.25 (1.20, 1.29) to 3.27 (3.18, 3.33) | 3.00 | 1.92 (1.44,2.13) to 4.17 (3.98,4.31) |
|
LVEDV‐I (mL/kg) 4‐CH view |
2.14 | 1.25 (1.17, 1.30) to 3.21 (3.12, 3.40) | 3.04 | 2.02 (1.88, 2.16) to 4.11 (3.97, 4.25) |
|
LVESV‐I (mL/kg) PLAX view |
0.88 | 0.30 (0.27, 0.32) to 1.54 (1.51, 1.56) | 1.40 | 0.72 (0.63, 0.81) to 2.11 (2.01, 2.20) |
|
LVESV‐I (mL/kg) 4‐CH view |
0.95 | 0.35 (0.32, 0.37) to 1.57 (1.54, 1.59) | 1.38 | 0.82 (0.74, 0.91 to 2.11 (2.02, 2.19) |
| EF PLAX (%) | 58 | 40.5 (39.8, 41.2) to 75.3 (74.6, 76.1) | 53 | 41.3 (39.8, 42.9) to 65.1 (63.5, 66.7) |
| EF 4‐CH view (%) | 56 | 39.6 (38.9, 40.4) to 71.9 (71.2, 72.7) | 52 | 37.8 (35.9, 39.7) to 65.9 (64.1, 67.9) |
Abbreviations: CI, confidence interval; LVEDV‐I, left ventricular end‐diastolic volume indexed to body weight (kg); LVESV‐I left ventricular end‐systolic volume indexed to body weight (kg); and PLAX, parasternal long axis.
FIGURE 4.
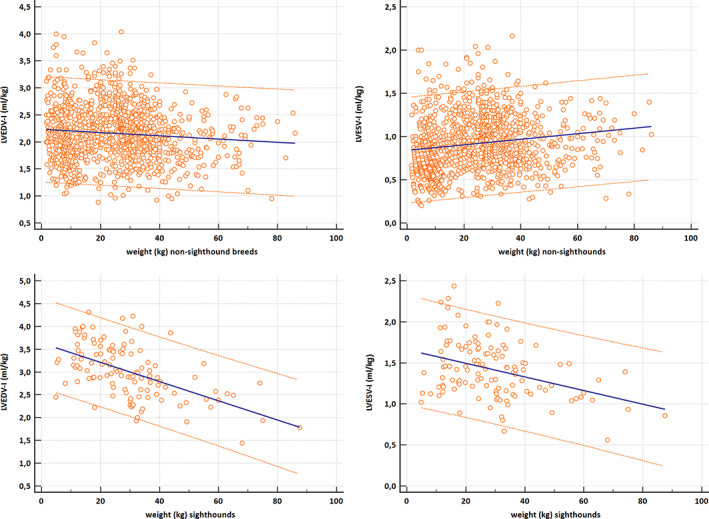
Scatter diagram with a regression line and 95% prediction interval for the regression curve for LVEDV‐I (mL/kg) and LVESV‐I (mL/kg) plotted against body weight (BW; kg). The upper graphs are for non‐sighthound breeds (n = 1211) and the lower graphs for sighthound breed (n = 120). LVEDV‐I, left ventricular end‐diastolic volume normalized to BW in kilograms; LVESV‐I, left ventricular end‐systolic volume normalized to BW in kilograms
The effect of sighthound breeds on the calculation of RIs for LVEDV and LVESV using the additive model is presented in Figure 5. To illustrate the distribution of various breeds within the RI, the data points of Great Danes, Newfoundlands, West Highland White Terriers, and French Bulldogs are shown in Figure 6.
FIGURE 5.
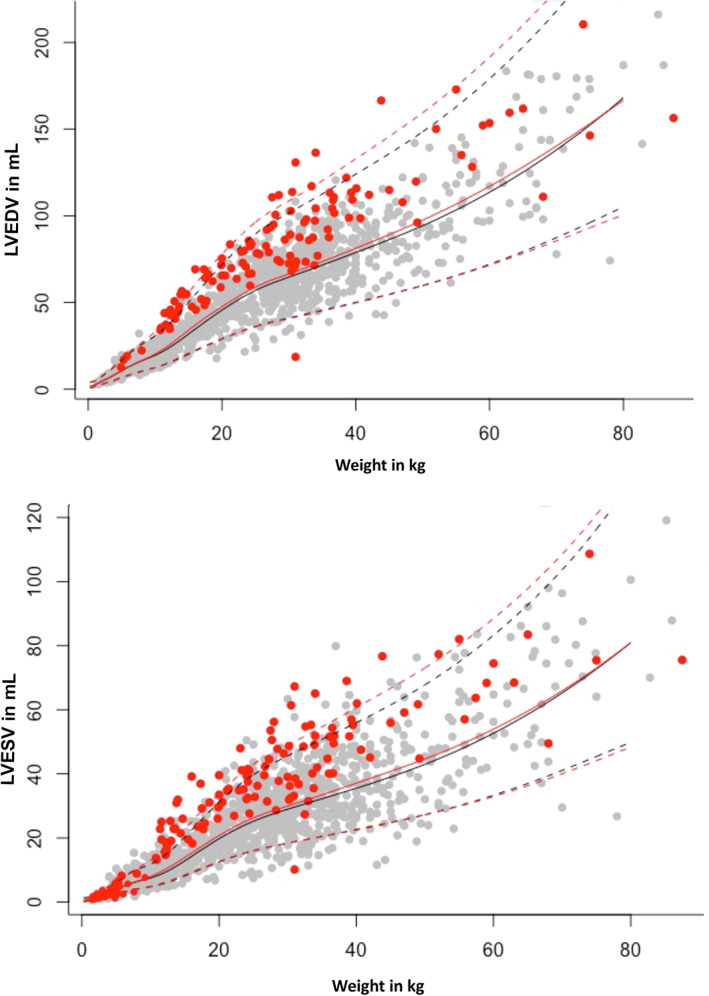
Comparison between the diastolic (above) and systolic (below) prediction intervals (PIs) including and excluding sighthound breeds. Prediction intervals including sighthound breeds (red dots) are represented in red lines. Gray dots represent all other dogs, PI without sighthound breeds is displayed in black lines. Dotted lines stand for upper and lower PI, the median is displayed as a continuous line. LVEDV, left ventricular end‐diastolic volume; LVESV, left ventricular end‐systolic volume
FIGURE 6.
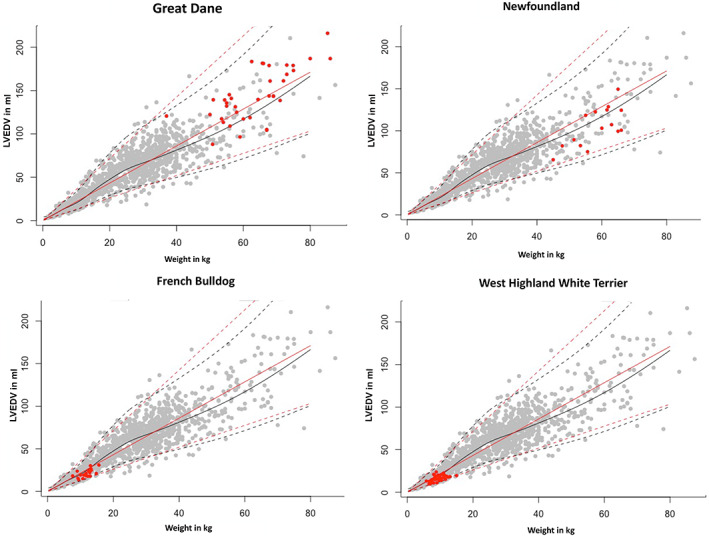
Comparison between the prediction interval (PI) for all breeds without sighthounds and selected individual breeds (red dots). The PI is displayed in black lines. LVEDV, left ventricular end‐diastolic volume; LVESV, left ventricular end‐systolic volume
4. DISCUSSION
Veterinary cardiologists face the problem of dealing with many different breeds and therefore a wide range of different body and BWs. To diagnose cardiac enlargement or, less commonly, to evaluate if a heart is volume underloaded, it is necessary to compare the obtained measurements to RIs. The optimal situation would be to have breed‐specific RIs, generated from a large healthy population. Because such RIs are not available for many breeds, and there are many mixed breed dogs among patients, RIs generated from a large sample size of dogs of different sizes and breeds are an alternative, but those RIs must be related to a scale basis. If allometric scaling is used to normalize cardiac dimensions to BW, cross‐sectional areas should be proportional to BSA (proportional to BW2/3), linear dimensions (eg, M‐mode) should relate to body length (commonly calculated as BW1/3) and volumes theoretically should relate linearly to BW. 46 Recent studies found better relationships between volumes and BSA, and thus reference values for humans as well as Doberman Pinschers, Boxers, Salukis, and Whippets have been published in mL/m2 , but the relationship of volumes to BW was almost identical. 15 , 16 , 52 In our study, the volumetric measurements using SMOD related best with BW (Figure 2), and therefore the reference values in our study are presented based on BW (kg). The use of a table with different BWs also makes use in clinical practice much easier, because no normalization to BSA (ie, no calculations) must be done. All studies that found better correlation of volume to BSA than to BW in kg used single breeds, which might explain why previous studies did not find a better relationship to BW, because they were dealing with a small range of different weights.
Measurements of LV volume are essential in assessing the progression of left‐sided heart disease. As discussed earlier, linear methods as well as volumetric methods based on linear measurements carry the risk of too many assumptions. 4 , 9 The SMOD is not only the echocardiographic standard method used in human medicine to evaluate EF and LV volume, but also has been recommended as the preferred method for the diagnosis of DCM in the Doberman Pinscher. 1 , 14 The superiority of SMOD over the Teichholz method also already has been shown in previous studies. 14
Our study included a wide variety of different breeds and had a large number of enrolled dogs. Not every dog presented at the clinic was enrolled into the study group. Because the clinic has a special interest in the Doberman, Boxer, Whippet, and Saluki breeds, and therefore more dogs of these breeds are presented, the number of dogs enrolled of those particular breeds was decreased to a median size of n = 24 for Whippets and Salukis, and n = 26 for Dobermans and Boxers to avoid overrepresentation. Dogs selected for analysis from the overrepresented breeds were selected randomly from the database.
During the echocardiographic examination, the angle of the transducer was optimized to avoid underestimation of the LV volume. In the right PLAX view, the less experienced examiner tends to position the probe too close to the sternum, or not cranial enough, so the LV is not displayed in its full size. Also, the left apical view can be displayed incorrectly when the probe is positioned too far cranial, or too far away from the sternum (ie, the LV might be foreshortened). Imaging was done only by diplomates or by residents under supervision, so that possible mistakes could be immediately corrected. Overlapping of the lungs also should be avoided, otherwise the endocardial borders cannot be traced exactly. To predict exact LV volumes, 2 orthogonal views are recommended in human medicine. 9 We recommend measuring SMOD using both the right PLAX and the left A4C view and using the larger volume, because overestimation is not possible as long as the aorta is not visualized (ie, the view is a true 4‐chamber view).
Linear regression models, as used in previous studies, did not provide satisfactory results in our study. 53 Problems detected were negative RIs in the low weight range, when using nonlogarithmatized numbers, and an unrealistically wide range in the sector of heavy weight when logarithmatizing the measurements to avoid the first problem. The linear model therefore was limited and did not provide enough flexibility. To solve this problem, another model independent of linearity or any other function was used. This additive model was based on dividing the codomain into smaller intervals bordering at the intersections. The effect of weight on the command variable was estimated based on a polynomial function for each interval. The more intervals applied, the more flexible is the global function of the estimated effect. The effect of weight was almost linear but had a curved deviance in the middle sector. To obtain the most exact RIs, more intersections were set up in this sector. The resulting RIs are therefore adapted to the given data in the best possible way. This method to calculate RI therefore has the advantage of adjusting and fitting the RIs better in certain weight classes, which might occur because of body size and breed differences. Estimating RIs based only on the 2.5th and 97.5th percentiles of weight‐normalized measurements, as recommended by CLSI 51 and used recently in a veterinary study estimating RIs for SMOD and other parameters, 18 would lead to much simpler RIs (appropriate for all BWs), compared to our model‐based intervals. We also performed those calculations (Table 4). This approach however would implicitly make 2 statistical assumptions about the normalized values that do not hold for our data. Both points are visualized in Figure 4, which plots the normalized LVEDV‐I and LVESV‐I values against BW, for both the non‐sighthound dogs and the sighthound breeds. The figure additionally includes a linear regression line from BW on the normalized values and uncertainty intervals of constant size across BW to make the following interpretations easier. First, deriving 1 RI from these normalized values is only reasonable if the normalized values have a comparable range of observed measurements over all BWs. This however is not the case because the normalized LVEDV‐I values get smaller for higher BWs (Figure 4). Second, 1 RI would assume a comparable variation of the normalized values over all BWs. This also is not the case, because the variation is higher for small BW and substantially smaller for higher BWs (Figure 4). Because of these 2 drawbacks, it would not be statistically sound to use this more simplistic method based on the normalized values, because the resulting RIs would not sufficiently describe the variation in the data, but we included them for illustrative and comparative purposes.
The calculated RIs in non‐sighthound breeds appear not to be very different among different BWs and might be used clinically as recommended in a previous study, 18 whereas the use in sighthounds is questionable, and RIs calculated from our additive model are more accurate because the model adjusts to the observed variations (Table 3). The normalized RIs (mL/kg) in Table 4 are slightly larger than those of a previous study using 122 normal dogs with an LVEDV‐I upper RI of 3.27 mL/kg compared to 2.99 mL/kg 18 and an LVESV‐I upper normal RI of 1.54 mL/kg compared to 1.35 mL/kg, 18 with smaller CIs in our study, which might be explained by the much larger population used in our study. The recently published study also used only right parasternal images for SMOD measurements. 18
Earlier studies, which published RIs for specific breeds, found that sighthound breeds, categorized into group 10 by the Fédération Cynologique Internationale following guidelines of the United Kennel Club (UKC), tended to have larger hearts than other breeds. Reference values for M‐mode as well as SMOD have been published showing larger RI than those of comparable breeds (height and weight). 15 , 36 , 54 , 55 The effect of sighthound breeds on the calculation of RIs for LVEDV and LVESV in our study using the additive model (Figure 5) shows that the RIs clearly were smaller when the sighthound breeds were excluded. This observation confirms that sighthound breeds should be excluded or handled separately when RIs are calculated for a general canine population. The “athletic heart” is described in human medicine as a cardiac change in athletes 56 where athletes had larger LV volumes than the inactive control group. 57 It is not known if the larger LV volumes in sighthound breeds represent a training effect or are related to genetic background. 58 To avoid the problem of missing pathologic changes based on an RI that is too wide, subgroups have been established in our study, dividing the study population into sighthounds and other breeds. This approach is recommended by the guidelines of the Quality Assurance and Laboratory Standards Committee if the reference values will have clinical relevance and the literature has already documented differences among the subgroups. This subdivision is only allowed if at least 40 individuals can be assigned to each group. 47
The reference values of sighthound breeds contain 120 individuals, the group of all other breeds with sighthound breeds excluded consists of 1211 individuals. Thus, the larger volumes of sighthound breeds had no effect on the overall RI. Even in the group of all other breeds, differences among breeds can be noted, showing tendencies to affect RI. French Bulldogs, Newfoundland Dogs, West Highland White Terriers, and Great Danes especially showed strong bias. These differences can be explained by the influence of body shape on the size and shape of the heart. Deep‐chested breeds such as sighthound breeds as well as Great Danes have larger heart volumes than do flat‐chested such as French Bulldogs and West Highland White Terriers. Those differences may have their origin in the primary use of the dogs: sighthound breeds and Great Danes were used for hunting, whereas high athletic performance is not expected from a companion dog such as the French Bulldog. Breed‐specific RIs still are important for selected breeds, but the numbers of individuals in our study were not high enough to establish such RIs.
Our study had several limitations. The health status was only evaluated by physical examination and echocardiography, and asymptomatic systemic diseases that may have an influence on the echocardiographic findings were not ruled out by additional diagnostic testing. Including dogs deemed to be normal and healthy was based on as many variables as possible (primarily physical examination, history, echocardiography, experience, and subjective impression), but also based on previously published breed‐specific RIs and if not available based on previously published PIs that might have biased the results. 46 Also, potential arrhythmias, such as arrhythmogenic cardiomyopathy, were not further evaluated by Holter examinations.
The examinations were done by >1 cardiologist, but interobserver measurement variability for SMOD measurements has been shown to be low in previous studies. This factor might also be a strength, because the results of the study potentially can be used by other cardiologists.
The RI > 40 kg includes fewer individuals than the lower weight ranges and thus is not so robust. Additional studies including heavier dogs (>40 kg) should be performed, as well as determining breed‐specific RIs. Nevertheless, it is still possible to evaluate dogs of higher weight based on the RIs of our study, but individual and breed‐specific variances should be considered when interpreting the results.
It has not yet been proven that cardiac dimensions change with age as observed in humans, but age‐related variations must be considered.
5. CONCLUSIONS
Our study provides echocardiographic RIs for SMOD, independent of breed and size and might enable veterinary cardiologist to use this method for all dogs, using the PLAX or A4C view or both. Additional studies must demonstrate the superiority of the SMOD over M‐mode in detecting earlier chamber enlargement as is already proven in Doberman Pinschers. 14
CONFLICT OF INTEREST DECLARATION
Authors declare no conflict of interest.
OFF‐LABEL ANTIMICROBIAL DECLARATION
Authors declare no off‐label use of antimicrobials.
INSTITUTIONAL ANIMAL CARE AND USE COMMITTEE (IACUC) OR OTHER APPROVAL DECLARATION
The study is within German laws for animal welfare.
HUMAN ETHICS APPROVAL DECLARATION
Authors declare human ethics approval was not needed for this study.
ACKNOWLEDGMENT
No funding was received for this study.
Wess G, Bauer A, Kopp A. Echocardiographic reference intervals for volumetric measurements of the left ventricle using the Simpson's method of discs in 1331 dogs. J Vet Intern Med. 2021;35:724–738. 10.1111/jvim.16089
REFERENCES
- 1. Wess G, Domenech O, Dukes‐McEwan J, Häggström J, Gordon S. European Society of Veterinary Cardiology screening guidelines for dilated cardiomyopathy in Doberman Pinschers. J Vet Cardiol. 2017;19:405‐415. [DOI] [PubMed] [Google Scholar]
- 2. Boswood A, Gordon SG, Haggstrom J, et al. Longitudinal analysis of quality of life, clinical, radiographic, echocardiographic, and laboratory variables in dogs with preclinical myxomatous mitral valve disease receiving Pimobendan or placebo: the EPIC study. J Vet Intern Med. 2018;32:72‐85. [DOI] [PMC free article] [PubMed] [Google Scholar]
- 3. Hezzell MJ, Boswood A, Moonarmart W, Elliott J. Selected echocardiographic variables change more rapidly in dogs that die from myxomatous mitral valve disease. J Vet Cardiol. 2012;14:269‐279. [DOI] [PubMed] [Google Scholar]
- 4. Teichholz LE, Kreulen T, Herman MV, Gorlin R. Problems in echocardiographic volume determinations: echocardiographic‐angiographic correlations in the presence of absence of asynergy. Am J Cardiol. 1976;37:7‐11. [DOI] [PubMed] [Google Scholar]
- 5. Tidholm A, Westling AB, Hoglund K, et al. Comparisons of 3‐, 2‐dimensional, and M‐mode echocardiographical methods for estimation of left chamber volumes in dogs with and without acquired heart disease. J Vet Intern Med. 2010;24:1414‐1420. [DOI] [PubMed] [Google Scholar]
- 6. Boon JA. Veterinary Echocardiography. Vol XIX. 2nd ed. Ames, Iowa: Wiley‐Blackwell; 2011:610 S. [Google Scholar]
- 7. Serres F, Chetboul V, Tissier R, et al. Comparison of 3 ultrasound methods for quantifying left ventricular systolic function: correlation with disease severity and prognostic value in dogs with mitral valve disease. J Vet Intern Med. 2008;22:566‐577. [DOI] [PubMed] [Google Scholar]
- 8. Quinones MA, Waggoner AD, Reduto LA, et al. A new, simplified and accurate method for determining ejection fraction with two‐dimensional echocardiography. Circulation. 1981;64:744‐753. [DOI] [PubMed] [Google Scholar]
- 9. Lang RM, Bierig M, Devereux RB, et al. Recommendations for chamber quantification. Eur J Echocardiogr. 2006;7:79‐108. [DOI] [PubMed] [Google Scholar]
- 10. Lang RM, Bierig M, Devereux RB, et al. Recommendations for chamber quantification: a report from the American Society of Echocardiography's Guidelines and Standards Committee and the Chamber Quantification Writing Group, developed in conjunction with the European Association of Echocardiography, a branch of the European Society of Cardiology. J Am Soc Echocardiogr. 2005;18:1440‐1463. [DOI] [PubMed] [Google Scholar]
- 11. Lang RM, Badano LP, Mor‐Avi V, et al. Recommendations for cardiac chamber quantification by echocardiography in adults: an update from the American Society of Echocardiography and the European Association of Cardiovascular Imaging. J Am Soc Echocardiogr. 2015;28:1.e14‐39.e14. [DOI] [PubMed] [Google Scholar]
- 12. Jenkins C, Bricknell K, Chan J, Hanekom L, Marwick TH. Comparison of two‐ and three‐dimensional echocardiography with sequential magnetic resonance imaging for evaluating left ventricular volume and ejection fraction over time in patients with healed myocardial infarction. Am J Cardiol. 2007;99:300‐306. [DOI] [PubMed] [Google Scholar]
- 13. Kuroda T, Seward JB, Rumberger JA, et al. Left ventricular volume and mass: comparative study of two‐dimensional echocardiography and ultrafast computed tomography. Echocardiography. 1994;11:1‐9. [DOI] [PubMed] [Google Scholar]
- 14. Wess G, Maurer J, Simak J, et al. Use of Simpson's method of disc to detect early echocardiographic changes in Doberman Pinschers with dilated cardiomyopathy. J Vet Intern Med. 2010;24:1069‐1076. [DOI] [PubMed] [Google Scholar]
- 15. Seckerdieck M, Holler P, Smets P, Wess G. Simpson's method of discs in Salukis and Whippets: echocardiographic reference intervals for end‐diastolic and end‐systolic left ventricular volumes. J Vet Cardiol. 2015;17:271‐281. [DOI] [PubMed] [Google Scholar]
- 16. Smets P, Daminet S, Wess G. Simpson's method of discs for measurement of echocardiographic end‐diastolic and end‐systolic left ventricular volumes: breed‐specific reference ranges in Boxer dogs. J Vet Intern Med. 2014;28:116‐122. [DOI] [PMC free article] [PubMed] [Google Scholar]
- 17. Stephenson HM, Fonfara S, Lopez‐Alvarez J, et al. Screening for dilated cardiomyopathy in Great Danes in the United Kingdom. J Vet Intern Med. 2012;26:1140‐1147. [DOI] [PubMed] [Google Scholar]
- 18. Visser LC, Ciccozzi MM, Sintov DJ, Sharpe AN. Echocardiographic quantitation of left heart size and function in 122 healthy dogs: a prospective study proposing reference intervals and assessing repeatability. J Vet Intern Med. 2019;33:1909‐1920. [DOI] [PMC free article] [PubMed] [Google Scholar]
- 19. Bayon A, Palacio M, Montes AM, et al. M‐mode echocardiography study in growing Spanish Mastiffs. J Small Anim Pract. 1994;35:473‐479. [Google Scholar]
- 20. Thomas WP, Gaber CE, Jacobs GJ, et al. Recommendations for standards in transthoracic two‐dimensional echocardiography in the dog and cat. Echocardiography Committee of the Specialty of Cardiology, American College of Veterinary Internal Medicine. J Vet Intern Med. 1993;7:247‐252. [DOI] [PubMed] [Google Scholar]
- 21. Morrison SA, Moise NS, Scarlett J, Mohammed H, Yeager AE. Effect of breed and body weight on echocardiographic values in four breeds of dogs of differing somatotype. J Vet Intern Med. 1992;6:220‐224. [DOI] [PubMed] [Google Scholar]
- 22. Crippa L, Ferro E, Melloni E, Brambilla P, Cavalletti E. Echocardiographic parameters and indices in the normal beagle dog. Lab Anim. 1992;26:190‐195. [DOI] [PubMed] [Google Scholar]
- 23. Une S, Terashita A, Nakaichi M, et al. Morphological and functional standard parameters of echocardiogram in beagles. J Jpn Vet Med Assoc. 2004;57:793‐798. [Google Scholar]
- 24. Locatelli C, Santini A, Bonometti GA, et al. Echocardiographic values in clinically healthy adult dogue de Bordeaux dogs. J Small Anim Pract. 2011;52:246‐253. [DOI] [PubMed] [Google Scholar]
- 25. Jacobson JH, Boon JA, Bright JM. An echocardiographic study of healthy Border Collies with normal reference ranges for the breed. J Vet Cardiol. 2013;15:123‐130. [DOI] [PubMed] [Google Scholar]
- 26. Cunningham SM, Rush JE, Freeman LM, Brown DJ, Smith CE. Echocardiographic ratio indices in overtly healthy boxer dogs screened for heart disease. J Vet Intern Med. 2008;22:924‐930. [DOI] [PMC free article] [PubMed] [Google Scholar]
- 27. Misbach C, Lefebvre HP, Concordet D, et al. Echocardiography and conventional Doppler examination in clinically healthy adult Cavalier King Charles Spaniels: effect of body weight, age, and gender, and establishment of reference intervals. J Vet Cardiol. 2014;16:91‐100. [DOI] [PubMed] [Google Scholar]
- 28. Lim CK, Fosgate GT, Green HW, et al. Two‐dimensional left atrium‐to‐aorta ratios and left ventricular M‐mode transthoracic echocardiographic measurements in clinically normal adult Dachshunds. Am J Vet Res. 2016;77:374‐382. [DOI] [PubMed] [Google Scholar]
- 29. Vollmar A. Echocardiographic examinations in Deerhounds, reference values for echodiagnostic. Kleintierpraxis. 1998;43:497‐508. [Google Scholar]
- 30. Koch J, Pedersen HD, Jensen AL, Flagstad A. M‐mode echocardiographic diagnosis of dilated cardiomyopathy in giant breed dogs. Zentralbl Veterinarmed A. 1996;43:297‐304. [DOI] [PubMed] [Google Scholar]
- 31. Muzzi RA, Muzzi LA, de Araujo RB, et al. Echocardiographic indices in normal German shepherd dogs. J Vet Sci. 2006;7:193‐198. [DOI] [PMC free article] [PubMed] [Google Scholar]
- 32. Kayar A, Gonul R, Or ME, et al. M‐mode echocardiographic parameters and indices in the normal German shepherd dog. Vet Radiol Ultrasound. 2006;47:482‐486. [DOI] [PubMed] [Google Scholar]
- 33. Calvert CA, Brown J. Use of M‐mode echocardiography in the diagnosis of congestive cardiomyopathy in Doberman pinschers. J Am Vet Med Assoc. 1986;189:293‐297. [PubMed] [Google Scholar]
- 34. O'Grady M, O'Sullivan M, Minors S, et al. Efficacy of benazepril hydrochloride to delay the progression of occult dilated cardiomyopathy in Doberman Pinschers. J Vet Intern Med. 2009;23:977‐983. [DOI] [PubMed] [Google Scholar]
- 35. O'Leary CA, Mackay BM, Taplin RH, et al. Echocardiographic parameters in 14 healthy English Bull Terriers. Aust Vet J. 2003;81:535‐542. [DOI] [PubMed] [Google Scholar]
- 36. Page A, Edmunds G, Atwell RB. Echocardiographic values in the Greyhound. Aust Vet J. 1993;70:361‐364. [DOI] [PubMed] [Google Scholar]
- 37. Snyder PS, Sato T, Atkins CE. A comparison of echocardiographic indices of the nonracing, healthy greyhound to reference values from other breeds. Vet Radiol Ultrasound. 1995;36:387‐392. [Google Scholar]
- 38. Della Torre PK, Kirby AC, Church DB, et al. Echocardiographic measurements in Greyhounds, Whippets and Italian Greyhounds‐dogs with a similar conformation but different size. Aust Vet J. 2000;78:49‐55. [DOI] [PubMed] [Google Scholar]
- 39. Vollmar AC. Echocardiographic measurements in the Irish Wolfhound: reference values for the breed. J Am Anim Hosp Assoc. 1999;35:271‐277. [DOI] [PubMed] [Google Scholar]
- 40. Vollmar AC. Use of echocardiography in the diagnosis of dilated cardiomyopathy in Irish Wolfhounds. J Am Anim Hosp Assoc. 1999;35:279‐283. [DOI] [PubMed] [Google Scholar]
- 41. Voros K, Hetyey C, Reiczigel J, et al. M‐mode and two‐dimensional echocardiographic reference values for three Hungarian dog breeds: Hungarian Vizsla, Mudi and Hungarian Greyhound. Acta Vet Hung. 2009;57:217‐227. [DOI] [PubMed] [Google Scholar]
- 42. Sisson D, Schaeffer D. Changes in linear dimensions of the heart, relative to body weight, as measured by M‐mode echocardiography in growing dogs. Am J Vet Res. 1991;52:1591‐1596. [PubMed] [Google Scholar]
- 43. Lehtinen S, Wiberg M, Häggström J, et al. Breed‐specific reference ranges for echocardiography in salukis. J Vet Intern Med. 2015;29:471. [Google Scholar]
- 44. Baade H, Schober K, Oechtering G. Echokardiographische Referenzwerte beim West Highland White Terrier unter besonderer Berücksichtigung der Rechtsherzfunktion. Tierärztl Prax Ausg K Kleintiere Heimtiere. 2002;30:172‐179. [Google Scholar]
- 45. Bavegems V, Duchateau L, Sys SU, et al. Echocardiographic reference values in whippets. Vet Radiol Ultrasound. 2007;48:230‐238. [DOI] [PubMed] [Google Scholar]
- 46. Cornell CC, Kittleson MD, Della Torre P, et al. Allometric scaling of M‐mode cardiac measurements in normal adult dogs. J Vet Intern Med. 2004;18:311‐321. [DOI] [PubMed] [Google Scholar]
- 47. Friedrichs KR, Harr KE, Freeman KP, et al. ASVCP reference interval guidelines: determination of de novo reference intervals in veterinary species and other related topics. Vet Clin Pathol. 2012;41:441‐453. [DOI] [PubMed] [Google Scholar]
- 48. Horn PS, Pesce AJ. Reference Intervals: a User's Guide. Washington, DC: American Association for Clinical Chemistry, Incorporated; 2005. [Google Scholar]
- 49. Bland JM, Altman DG. Statistical methods for assessing agreement between two methods of clinical measurement. Lancet. 1986;1:307‐310. [PubMed] [Google Scholar]
- 50. Fahrmeir L, Kneib T, Lang S, et al. Regression: Models, Methods and Applications. Berlin: Springer Science & Business Media; 2013. [Google Scholar]
- 51. Clinical Laboratory Standards Institute . Defining, establishing, and verifying reference intervals in the clinical laboratory; approved guideline. CLSI document EP28‐A3c. 3rd ed. Wayne, PA: Clinical Laboratory Standards Institute; 2010. [Google Scholar]
- 52. Wess G, Mäurer J, Simak J, et al. Comparison of New Reference Values of Biplane Simpson Rule and New M‐Mode Reference Values to Detect Early Echocardiographic Changes in Doberman Pinschers with DCM. In: ACVIM, Denver 2010. [DOI] [PubMed]
- 53. Gerlach N. Referenzwerterstellung für die Simpson‐Scheibchensummations‐Methode und Untersuchung des Einflusses einer zusätzlich zu Pimobendan und Furosemid verabreichten Angiotensin‐converting‐Enzym‐Therapie auf die Entwicklung selektiver Ultraschallparameter bei Hunden mit dekompensierter Mitralklappenendokardiose. In: München University Dissertation, 2009.
- 54. Bavegems V, Van Caelenberg A, Duchateau L, et al. Vertebral heart size ranges specific for whippets. Vet Radiol Ultrasound. 2005;46:400‐403. [DOI] [PubMed] [Google Scholar]
- 55. Lehtinen SMWM, Häggström J, Lohi H. Research communications of the 24th ECVIM‐CA congress. J Vet Intern Med. 2015;29:423‐483. [Google Scholar]
- 56. Gott PH, Roselle HA, Crampton RS. The athletic heart syndrome. Five‐year cardiac evaluation of a champion athlete. Arch Intern Med. 1968;122:340‐344. [DOI] [PubMed] [Google Scholar]
- 57. Morganroth J, Maron BJ, Henry WL, Epstein SE. Comparative left ventricular dimensions in trained athletes. Ann Intern Med. 1975;82:521‐524. [DOI] [PubMed] [Google Scholar]
- 58. Pape LA, Price JM, Alpert JS, Rippe JM. Hemodynamics and left ventricular function: a comparison between adult racing Greyhounds and Greyhounds completely untrained from birth. Basic Res Cardiol. 1986;81:417‐424. [DOI] [PubMed] [Google Scholar]