Abstract
Glycogen accumulation is a highly consistent, distinguishable characteristic of clear cell renal cell carcinoma (ccRCC)1. While elevated glycogen pools might be advantageous for ccRCC cells in nutrient deprived microenvironments to sustain tumor viability, data supporting a biological role for glycogen in ccRCC are lacking. Here, we demonstrate that glycogen metabolism is not required for ccRCC proliferation in vitro nor xenograft tumor growth in vivo. Disruption of glycogen synthesis by CRISPR-mediated knockout of glycogen synthase 1 (GYS1) has no effect on proliferation in multiple cell lines, regardless of glucose concentrations or oxygen levels. Similarly, prevention of glycogen breakdown by deletion or pharmacological inhibition of glycogen phosphorylases B and L (PYGB and PYGL) has no impact on cell viability under any condition tested. Lastly, in vivo xenograft experiments using the ccRCC cell line, UMRC2, reveal no significant alteration in tumor size or volume when glycogen metabolism is altered, largely phenocopying our in vitro observations. Our findings suggest glycogen buildup in established ccRCC tumor cells is likely to be a secondary, and apparently dispensable, consequence of constitutively active HIF-1α signaling.
Kidney cancer ranks 8th in yearly incidence rates out of the nearly 200 distinct cancer classifications in the US2. In fact, SEER data up to 2017 indicates that kidney cancer incidence had among the greatest percent increase among males and females for all cancer types in this latest period analyzed, highlighting a need for deeper comprehension of the disease. Clear cell renal cell carcinoma (ccRCC) is the predominant disease subtype, accounting for more than 70% of patient cases, with a majority of tumors harboring loss-of-function mutations in the von Hippel Lindau (VHL) tumor suppressor3. pVHL is an E3 ligase component that recognizes oxygen-dependent hydroxylation sites on hypoxia inducible factors (HIFs) to negatively regulate HIF protein levels through the ubiquitin-proteosome system. Only during acute hypoxia is pVHL unable to interact with HIFs and, by extension, are HIF proteins stabilized to initiate an adaptive response to low oxygen. The vast majority of ccRCC tumors lack pVHL expression or function and uniquely exhibit chronic HIF-α stabilization, regardless of tumor oxygenation. As such, these tumors categorically display transcriptomic profiles driven by either HIF-1α and HIF-2α together (H1H2) or HIF-2α solely (H2)4. Recent pharmacological advances in the development of small molecule inhibitors of HIF-2α, such as PT2385, have shown therapeutic promise in preclinical and clinical settings, supporting oncogenic addiction to HIFs in ccRCC5,6. However, the scope of HIF-controlled downstream pathways that are clinically relevant for disease progression remains incompletely defined.
Perhaps the most striking phenotypic aftermath of pVHL deficiency in ccRCC tumors is a histologically clear cytoplasm. This is due to the removal of large intracellular lipid droplets, harboring cholesterol esters and triglycerides, and accumulated granules of glycogen during tissue processing for pathology7,8. We previously reported that HIF-2α promotes lipid storage by regulating the expression of an essential lipid droplet coat protein, Perilipin-2 (PLIN2), in ccRCC9. PLIN2 knockdown eradicates lipid droplets and strongly abrogates cell viability, illuminating the importance of lipid homeostasis in ccRCC10. However, regulation or biological relevance of glycogen metabolism in ccRCC has not been investigated in careful detail, despite emerging data that support a pro-tumorigenic role for glycogen in other cancers, such as glioblastoma (GBM) and non-small cell lung cancer (NSCLC), under metabolic stress conditions11,12. Therefore, a thorough assessment of glycogen accretion in ccRCC was warranted.
The biochemical function of glycogen is to store glucose when ATP levels are high and release glucose, in the form of glucose-1-phosphate, when ATP levels decline13. Briefly, glycogen is constructed via a core protein unit, glycogenin, from which glucose molecules are covalently linked together through linear α(1-4) and branched α(1-6) bonds, and reciprocally degraded by hydrolysis to yield both monosaccharides (glucose) and polysaccharides (maltose, etc.) (Figure 1a). This dynamic process is tightly regulated on multiple levels in mammals, both systemically by the insulin/glucagon axis and intracellularly through energy-sensing mechanisms, such as AMPK and HIF-1α. In normal human physiology, the vast majority of glycogen resides in the gluconeogenic organs, namely liver and kidney, and high-energy consuming organs, including muscle and brain14. However, increased glycogen abundance in cancer appears to be a common event across a variety of originating tissues, including kidney, suggesting that glycogen may confer some metabolic benefit within the tumor microenvironment15.
Figure 1. Glycogen synthesis and breakdown are hyperactive in ccRCC tumors.
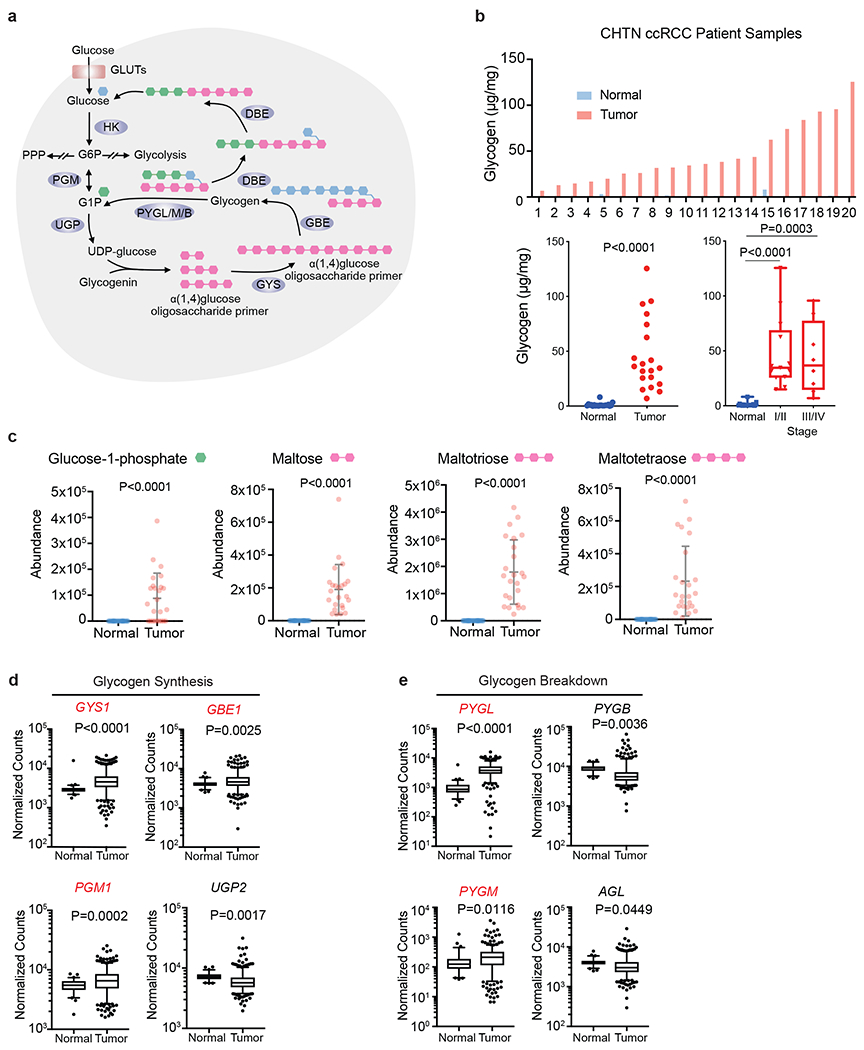
a. Schematic representation of glycogen synthesis and breakdown pathway in the cytosol. Briefly, glucose conversion into glucose-1-phopshate (G1P) is added or subtracted from oligosaccharide chains scaffolded by the core protein, glycogenin. Green hexagon: singly added glucose-1-phosphate; Pink hexagon: polysaccharide molecules added; Blue hexagon: units added as new branch. b. Upper panel: Glycogen extracted from 20 pairs of fresh frozen ccRCC patient tumors and adjacent normal kidneys and then quantified using glycogen assay kit (see Methods). Lower panels: Summary of tumors analyzed for glycogen levels, and subdivided according to tumor stage; n=20 biologically independent human ccRCC tumor/normal paired samples. Box plots (min. to max. all points): center=median, bounds=25th and 75th percentiles, whiskers=min. and max. values. c. Abundance of glycogen metabolism related metabolites in same human ccRCC tumor/normal paired samples. Data presented as mean +/− SEM. d, e. Normalized RNA-seq reads of glycogen synthesis genes (PGM1, UGP2, GYS1, and GBE1) and glycogen breakdown genes (PYGL, PYGB, PYGM, and AGL) in ccRCC (n=428) and normal kidney (n=66) samples; n denotes biologically independent human tissue samples. RNA-seq data obtained from TCGA. Box plots (min. to max. all points): center=median, bounds=25th and 75th percentiles, whiskers=5th and 95th percentiles. P values determined by two-tailed Student’s t test. GLUT: glucose transporter; HK: hexokinase; PPP: pentose phosphate pathway PGM: phosphoglucomutase; UGP: UDP-glucose pyrophosphatase; UDP-glucose: uridine diphospho-glucose; GYS: glycogen synthase; GBE: glycogen branching enzyme; PYGL/M/B: glycogen phosphorylase, liver/muscle/brain; DBE (encoded by AGL): debranching enzyme. Red denotes gene expression increase.
To address whether the glycogen pathway is consistently altered in ccRCC, elevated glycogen levels were confirmed in patient tumors compared to matched normal kidney tissue (Figure 1b). Comparable quantities of glycogen were also detected in six cell line models of ccRCC: 786-O, UOK101, 769P, UMRC2, RCC4, and RCC10 (Extended data figure 1a). To provide a more comprehensive and informative picture of glycogen production and degradation, we queried our previously generated metabolomic data17 on the same patient paired tumor and normal samples for glycogen-related metabolites. Many products of glycogen metabolism were relatively increased in ccRCC, including glucose-1-phosphate, and oligosaccharide branch intermediates, i.e. maltose, maltotriose, and maltotetraose (Figure 1c). These findings are consistent with a separate metabolomics assessment of 138 matched ccRCC/normal tissue pairs we further analyzed16 (Extended data figure 1a). Lastly, TCGA RNA-seq analysis revealed that all genes involved in glycogen metabolism are differentially expressed, including overexpression of those encoding critical synthetic enzymes (PGM1, GYS1, and GBE1), and catabolic enzymes (PYGL and PYGM) (Figure 1d and 1e). Some patients appear to stratify into high or low levels of expression (relative to normal kidney), which may indicate that elevated glycogen abundance is a result of a variety of transcriptional inputs. This was also consistent with our patient samples, where tumors sometimes showed higher or lower expression of a given gene related to glycogen metabolism compared to normal tissue (Extended data figure 1a). Nevertheless, based on increased glycogen content, elevated glycogen-derived metabolites, and differential expression of glycogen modifying genes, we concluded that glycogen metabolism is significantly deregulated in ccRCC tumors.
To determine whether glycogen serves a key biological role in ccRCC, the rate-limiting enzyme, glycogen synthase, was initially evaluated as it directly controls glycogen synthesis (Figure 2a). In mammalian cells, glycogen synthase has two isoforms, GYS1 (expressed in skeletal muscle and other tissues) and GYS2 (expressed predominately in the liver)18. Analysis of TCGA RNA-seq database and primary samples revealed that GYS1 mRNA and protein levels were significantly increased in tumor samples (Figure 2b and 2c). Since constitutive activation of HIF-α proteins through pVHL loss of function is a major driver of ccRCC pathogenesis3, the capability of HIFs to facilitate increased GYS1 transcription was assessed. Based on shRNA knockdown, GYS1 mRNA levels and glycogen deposition were selectively controlled by HIF-1α in HIF-1α expressing cells (H1H2) (Extended data figure 2a and 2b), and HIF-independent mechanisms in HIF-2α only expressing cells (H2) (Extended data figure 2c). Based on previous transcriptomic analyses4, expression levels of GYS1, PYGB, PYGL, and PYGM were not significantly different between H1H2 and H2 ccRCC tumors. Additionally, 786-O cells stably re-expressing pVHL did not show altered expression of glycogen metabolic enzymes (Extended data figure 2c), confirming regulation by pathways other than the HIF-prolylhydroxylation-pVHL system when HIF-1α is absent.
Figure 2. Elevated glycogen synthesis enzyme, GYS1, in ccRCC tumors does not affect proliferation in vitro.
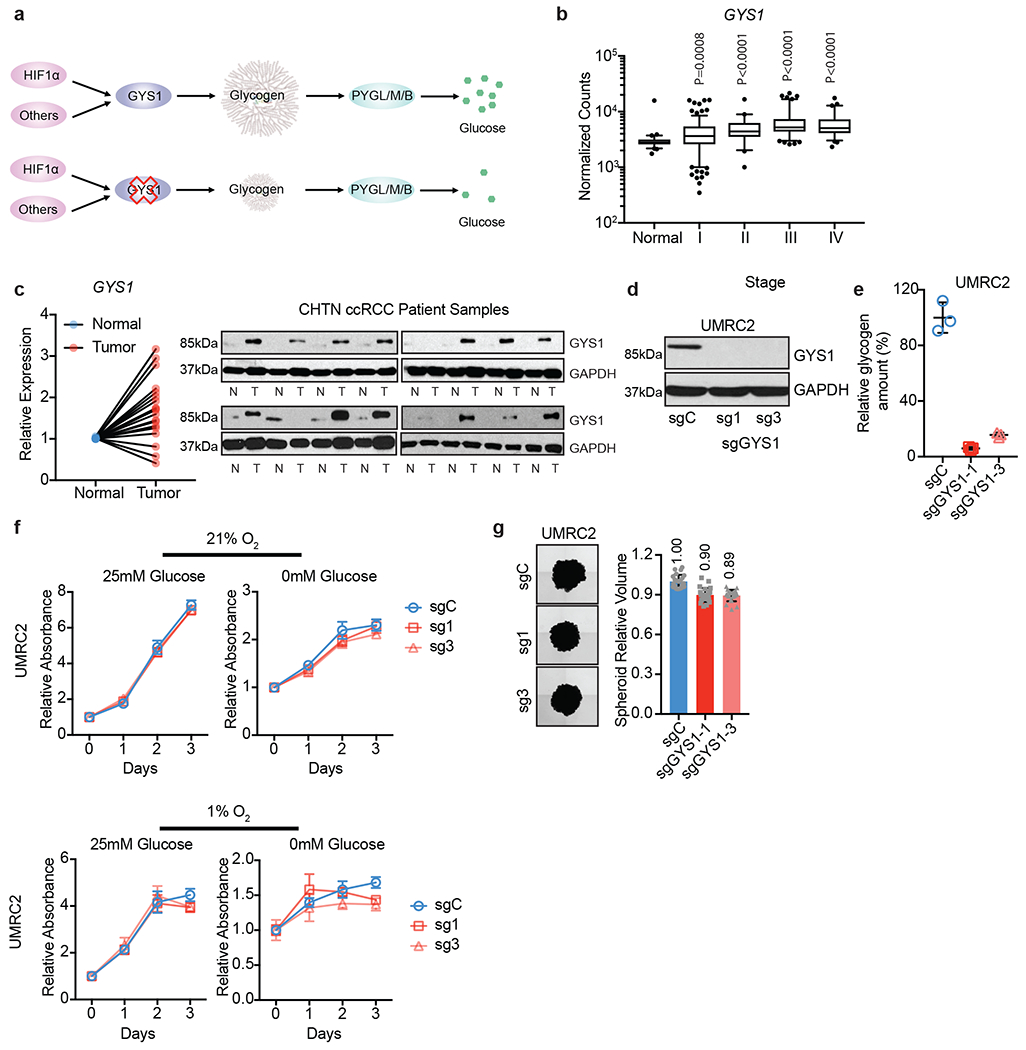
a. Schematic model of simplified glycogen metabolism pathway and hypothetical effect of GYS1 blockade on glycogen and free glucose. b. Normalized RNA-seq reads of GYS1 in stage-stratified ccRCC (n=428) and normal kidney (n=66) samples; n denotes biologically independent human tissue samples. RNA-seq data obtained from TCGA. Box plots (min. to max. all points): center=median, bounds=25th and 75th percentiles, whiskers=5th and 95th percentiles. Center line=median. c. qRT-PCR (left) and immunoblots (right) of GYS1 in matched ccRCC and normal kidney samples; n=20 biologically independent human ccRCC tumor/normal paired samples. For qRT-PCR, TBP and ACTB utilized as endogenous control genes. Relative mRNA expression determined by normalizing to expression in normal tissues. d. UMRC2 ccRCC cells transduced with two independent sgRNAs against GYS1 (sg1 and sg3) or a control sgRNA (sgC). Western blot analysis performed 7 days after virus infection to assess GYS1 expression. e. Glycogen content measured in cells described in d on day 14 after virus infection; n=3 technical replicates as an example of reproducible experiments. Data presented as mean +/− SD. Relative glycogen amount determined by normalizing to glycogen level in sgC cells. f. Growth curves for cells described in d cultured in medium containing 1% FBS combined with indicated glucose and oxygen concentrations; n=6 biologically independent cell populations. Data presented as mean +/− SEM. Relative absorbance determined by normalizing to values at Day 0. g. Representative images acquired at 40X magnification and relative volumes of spheroids formed by cells described in d after 19 days culture; n=24 biologically independent spheroids. Data presented as mean +/− SEM. Relative volume determined by normalizing to that of sgC spheroids. Numbers denote average relative volumes. P values determined by two-tailed Student’s t test. For panels f and g, data are presented as mean values +/− SEM.
In addition to transcriptional regulation, post-translational control of GYS is achieved through phosphorylation, alternating between the phosphorylated inactive state and dephosphorylated active state (Extended data figure 2d)18. GYS dephosphorylation is catalyzed via hydrolysis by protein phosphatase-1 (PP1) which is bound to glycogen targeting subunit proteins, protein phosphatase 1 regulatory subunit 3 (PPP1R3)19. At least seven distinct genes encode PPP1R3: PPP1R3A-G, that are differentially expressed across tissues18. Previous studies demonstrated that PPP1R3C overexpression promotes glycogen accumulation in different tissues, suggesting its essential role in activating GYS and subsequent glycogen buildup20–23. In ccRCC tumors, PPP1R3B and PPP1R3C expression was elevated in all tumor stages (Extended data figure 2e). Consistent with glycogen buildup, these data suggest that elevated GYS1 mRNA and protein levels in ccRCC is a result of HIF-1α stabilization, whereas enhanced GYS1 activity is due to greater expression of accessory proteins important for GYS1 dephosphorylation.
To assess the functional consequences of elevated GYS1 expression and glycogen accumulation in ccRCC, GYS1 protein was reduced using two independent sgRNAs in multiple cell lines with variable baseline glycogen levels (UMRC2, 786-O, RCC4, and UOK101, Extended data figure 1a). As shown in Figure 2d and Extended data figure 3a, both sgRNAs targeting GYS1 robustly decreased GYS1 protein levels, resulting in rapid glycogen depletion in these cells (Figure 2e, and Extended data figure 3b). We hypothesized that cell proliferation would be inhibited if cells were unable to store glucose as glycogen for future use under acute conditions of nutrient deprivation. Surprisingly, GYS1 KO did not affect growth in UMRC2 cells, regardless of culture conditions (25mM vs. 0mM glucose, 21% vs. 1% O2, 1% FBS) (Figure 2f). UMRC2 GYS1 WT and KO cells were also embedded in Matrigel for spheroid growth to better mimic nutrient gradients and tissue pressure observed within the tumor environment. Again, GYS1 KO did not affect spheroid volume during the course of this assay (Figure 2g). The same trend was observed in spheroid assays for 786-O cells, as well as in 2-D proliferation assays for RCC4 and UOK101 cells (Extended data figure 3c and 3d). Of note, both GYS1 WT and KO UOK101 cells were particularly sensitive to growth in 25mM glucose at 1% O2 after 2 days due to lactic acid accumulation. These results suggest that although GYS1 mRNA and protein levels are overexpressed in ccRCC patient tumors and cell lines and associated with a concomitant accumulation in glycogen, neither GYS1 nor glycogen production is required for 2-D or 3-D growth under normal and tumor-relevant stress conditions.
The data showing that glycogen depletion does not affect in vitro ccRCC cell proliferation were rather unexpected, since it had been shown that GYS1 inhibition reduces cell proliferation of other types of cancer, such as leukemia24. An alternative hypothesis to explain this apparent lack of phenotype upon GYS1 inhibition in ccRCC cells proposes that increased GYS1 expression and glycogen accumulation is a collateral effect of HIF-1α activation and other factors, simply making glycogen generation a byproduct. Cells may need to simultaneously increase activity of the breakdown pathway to maintain glycogen homeostasis and avoid aberrant glucose storage into glycogen. Therefore, pVHL-deficient ccRCC cells may require enzymes involved in glycogen breakdown to balance enhanced GYS1 activity for metabolic homeostasis.
To investigate this further, glycogen catabolism (glycogenolysis) was functionally examined in ccRCC (Figure 3a). Glycogen phosphorylase is the rate-limiting enzyme for glycogen degradation and comprises three isoforms in mammals: liver (PYGL), muscle (PYGM), and brain (PYGB)18. As shown in Figure 1e, both PYGL and PYGM mRNA abundance were elevated in ccRCC. Since PYGM expression at baseline was much lower than PYGL, PYGL was initially evaluated. Similar to GYS1, PYGL mRNA levels were amplified in all tumor stages (Figure 3b). To genetically block glycogenolysis, two independent sgRNAs were pooled to target PYGL, producing a nearly complete loss of PYGL protein (Extended data figure 4a and 4b). Because glycogen was depleted in vitro within 12 hours following glucose deprivation (Extended data figure 4c), glycogen levels were measured at 6 hours in glucose-free medium. This time point allows cells to engage glycogenolysis without complete depletion before glycogen could be harvested. PYGL KO was unable to protect glycogen from degradation during this time frame (Extended data figure 4d), suggesting that these cells either did not utilize PYGL to mobilize glycogen under glucose deprived conditions or there exists redundancy in this process. Consistent with our finding, Favaro et al. showed that in a GBM cell line U87, PYGL knockdown did not increase glycogen content under normoxia11. However, they obtained the opposite result under hypoxia, where glycogen accumulated and proliferation decreased in shPYGL cells. To examine whether this can be recapitulated in ccRCC cells, PYGL WT/KO cells were subjected to hypoxia treatment (0.5% O2). In contrast to U87 cells, PYGL depletion in ccRCC cells did not accumulate more glycogen under hypoxia (Extended data figure 4e). In addition, there was no difference in cell growth between WT and PYGL KO cells when cultured in any condition tested (replete, low serum, low glucose, low oxygen) (Extended data figure 4f). Taken together, these data suggest that although PYGL expression is upregulated in ccRCC, it is not necessary for glycogenolysis, nor it is required for in vitro cell growth.
Figure 3. ccRCC tumor cells do not rely on glycogen breakdown for growth in vitro despite glycolytic entry of glycogen-derived glucose.
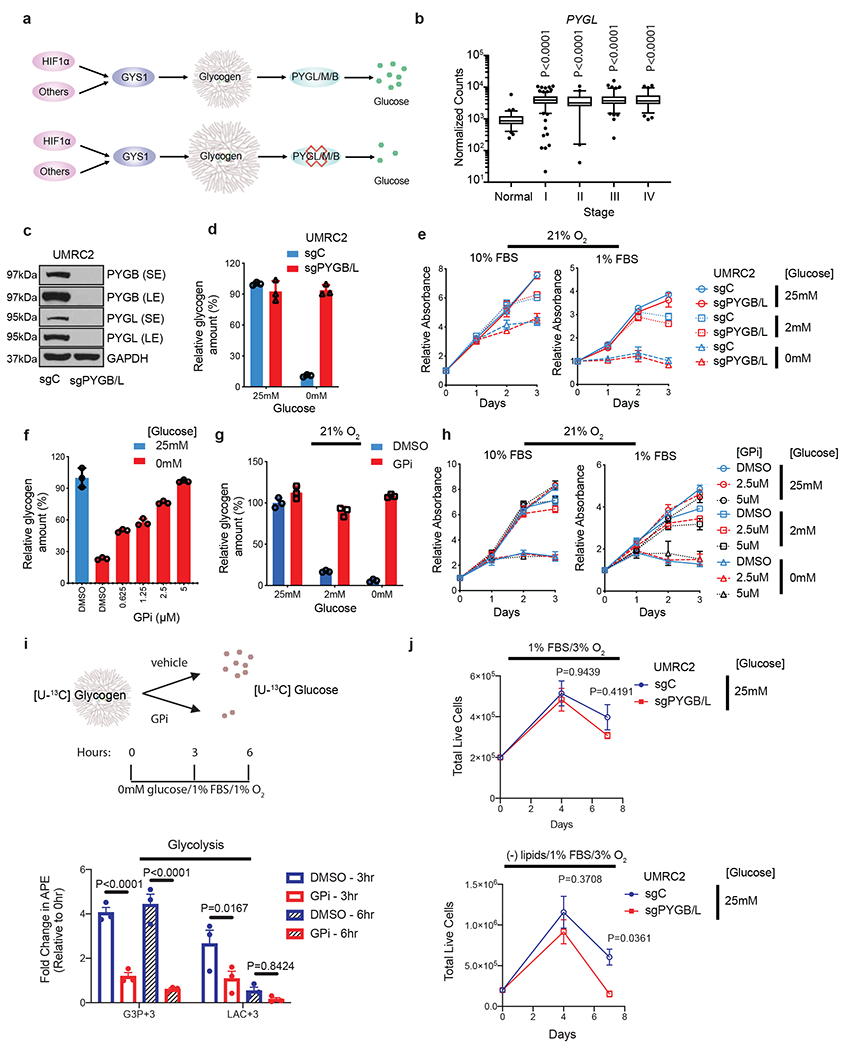
a. Hypothetical effect of PYGL/M/B blockade on glycogen breakdown. b. Normalized TCGA RNA-seq reads of PYGL in stage-stratified ccRCC (n=428 tumors) and normal kidney (n=66 tissue) samples. P values determined by two-tailed Student’s t test. c. Protein assessment comparing WT UMRC2 cells and PYGL KO UMRC2 cells described in Extended Data Figure 4b transduced with a control sgRNA against LacZ (sgC) or combined two sgRNAs targeting PYGB (sgPYGB/L), respectively. SE, short exposure; LE, long exposure. d. Glycogen quantification of cells described in c cultured in 25mM or 0mM glucose for 6 hours. Normalized to sgC in 25mM glucose. e. Growth curves for cells described in c cultured in indicated conditions; n=6. Normalized to Day 0. f. Glycogen quantification of UMRC2 cells cultured in 25mM (blue) or 0mM (red) glucose, treated with indicated concentrations of DMSO or GPi for 6 hours. Normalized to 25mM glucose. g. Glycogen quantification of UMRC2 cells cultured in 25mM, 2mM, or 0mM glucose and treated with DMSO (blue) or 5μM GPi (red) in 21% O2 for 48 hours. Normalized to 25mM glucose condition plus DMSO. h. Growth curves for UMRC2 parental cells treated with DMSO, 2.5μM, or 5μM GPi and cultured in indicated conditions; n=6 biologically independent cell populations. Normalized to Day 0. i. Upper panel: schematic of uniformly 13C-labeled ([U-13C]) glucose release from glycogen. Bottom panel: fold change in atomic percent excess (APE) of key glycolytic metabolites. Normalized to 0 hr; n=3. G3P+3: Glyceraldehyde-3-phosphate with three 13C carbons. LAC+3: Lactate with three 13C carbons. GPi concentration was 10μM (bottom panel). j. Growth curves for UMRC2 under the indicated culture conditions; n=3 biologically independent cell populations. For I and J, two-way ANOVA with Sidak’s multiple comparison test was used to determine significance. For all glycogen measurements, data from n=3 technical replicates and presented as mean +/− SD. For all growth curves, data from biologically independent cell populations and presented as mean +/− SEM.
As PYGL was insufficient to control glycogen breakdown, other isoforms were analyzed for functional redundancy. Although PYGB expression was downregulated in ccRCC tumors, it had comparable baseline mRNA levels as PYGL (Figure 1e). Neither genetic knockout or constitutive overexpression of PYGB protein disrupted proliferation of UMRC2 under metabolic stress conditions (Extended data figure 4g and 4h). Upon reduction of PYGB protein, PYGL protein levels were increased, suggesting possible compensation (Extended data figure 4g). Consistent with TCGA patient data, PYGM mRNA abundance was very low compared to the other two isoforms in UMRC2 (Extended data figure 4i), and PYGM was not evaluated further. Therefore, PYGL and PYGB were simultaneously depleted with sgRNAs to avoid compensation from either enzyme (Figure 3c, and Extended data figure 5a). Notably, PYGB/L DKO completely prevented glycogenolysis under glucose deprivation, suggesting both these isoforms are active in ccRCC (Figure 3d, and Extended data figure 5b). However, PYGB/L DKO cells did not exhibit higher glycogen content than WT cells under hypoxia, despite a trend towards increased deposition of glycogen with low oxygen exposure (Extended data figure 5c). This result suggests that ccRCC cells do not use any glycogen-derived glucose under hypoxic conditions, perhaps due to the increased uptake of extracellular glucose downstream of even greater hypoxia-mediated HIF stabilization. In addition, PYGB/L DKO did not affect cell proliferation under any conditions (Figure 3e, and Extended data figure 5d). To verify this result independently, a selective glycogen phosphorylase inhibitor, GPi, was employed. GPi dose-dependently maintained glycogen content in glucose-free culture condition (Figure 3f, and Extended data figure 5e), and during a long-term treatment, GPi blocked glycogen degradation when cells were cultured in low glucose (2mM) or no glucose (0mM) conditions, regardless of oxygenation (Figure 3g, and Extended data figure 5f). Consistent with PYGB/L DKO, GPi treatment did not affect in vitro ccRCC cell growth (Figure 3h, and Extended data figure 5g). These findings indicate that ccRCC tumor cells do not rely on glycogen breakdown for growth.
Despite no observable role in maintaining ccRCC viability, glycogen is rapidly broken down under low glucose conditions (Extended data figure 4c), suggesting that glycogen-derived glucose is metabolized in some way. Therefore, glycogen was labeled with [U-13C] glucose and then either allowed to or prevented from breakdown to specifically determine how glycogen-derived glucose was utilized (Figure 3i, and Extended data figure 6a and 6b). As a proof of principle, the percentage of intracellular, labeled glucose relative to unlabeled glucose was greater in cells that can properly catabolize glycogen under low glucose conditions (Extended data figure 6c). Mass spectrometry results indicated that glycogen-derived glucose was diffusely processed into various metabolites (Extended data figure 6d), but perhaps more concentrated in glycolytic intermediates and serine rather than the TCA cycle (Figure 3i, and Extended data figure 6d).
Due to increased glyceraldehyde-3-phosphate (G3P), serine/glycine, and very slightly ribose-5-phosphate labeling, additional experiments were designed to test potential proliferation defects in cells that lack glycogenolysis under nutrient conditions pertaining to these metabolites. Aside from the obvious role of G3P in glycolysis, G3P can also be catalyzed to generate glycerol, which is necessary for lipid synthesis. Serine/glycine and the pentose phosphate pathways both produce NAPDH, also needed for lipid synthesis. Therefore, UMRC2 control or PYGB/L DKO cells were subjected to lipid starvation and assessed for relative cell numbers over 7 days. Although UMRC2 cells typically grow poorly without an exogenous source of lipids, this was exacerbated somewhat in cells that cannot break down glycogen (Figure 3j) (see below for further discussion).
To evaluate whether these metabolic perturbations could also affect other cellular functions aside from growth, such as migration, Boyden chamber assays were performed using control or PYGB/L DKO UMRC2 cells. Similar to the lack of a proliferation phenotype, no observable change in migration was detected between cells that can or cannot engage in glycogenolysis (Extended data figure 7a and 7b).
Lastly, to determine whether glycogen metabolism is important for ccRCC tumor progression in vivo, we systematically transplanted our UMRC2 models into both flanks of nude mice. For glycogen synthesis, no significant difference was evident between the growth of GYS1 KO and WT tumors (Figure 4a), despite robust glycogen and GYS1 protein depletion (Figure 4b and 4c). Similarly, for glycogen breakdown, no consistent statistically significant effects on tumor volume or weight were observed when both PYGL and PYGB were effectively eliminated, and glycogen levels were either maintained or slightly elevated in PYGB/L DKO tumors (Figure 4d–f). Collectively, these results indicate that neither glycogen accumulation nor homeostasis plays a major role in ccRCC tumor models.
Figure 4. Genetic perturbation in glycogen metabolism does not alter ccRCC xenograft progression in vivo.
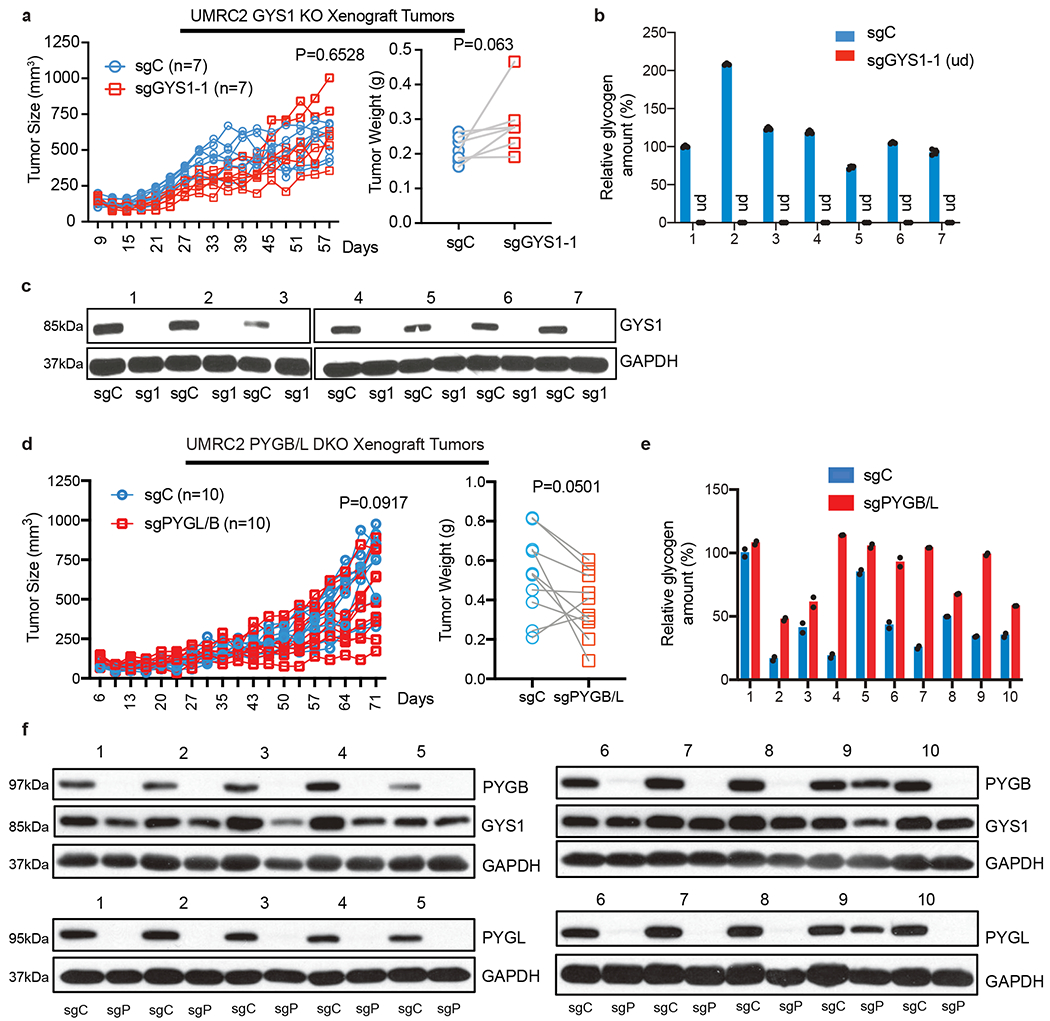
a. Tumor volume measurements for UMRC2 control (sgC) and GYS1 KO (sg1) subcutaneous xenograft tumors (in opposing flanks of each animal) at indicated time points (left); n=7 biologically independent tumors. Tumor weights at harvest determined (right). Note: some points overlap. b. Glycogen quantification of 7 pairs of sgC and sg1 xenograft tumors at harvest; n=3 technical replicates per tumor sample. Relative glycogen amount determined by normalizing to glycogen level in #1 sgC tumor. c. Western blot analysis for GYS1 in xenograft tumors. d. Tumor volume measurements for UMRC2 control (sgC) and PYGL/B KO (sgPYGL/B) subcutaneous xenograft tumors (in opposing flanks of each animal) at indicated time points (left); n=10 biologically independent tumors. Tumor weights at harvest determined (right). Note: some points overlap. e. Glycogen quantification of 10 pairs of sgC and sgPYGL/B xenograft tumors at harvest; n=2 technical replicates per tumor sample. Relative glycogen amount determined by normalizing to glycogen level in #1 sgC tumor. f. Western blot analysis for PYGL and PYGB protein in xenograft tumors. sgC: UMRC2 control sgLacZ; sgP: UMRC2 sgPYGB/L. For tumor volume and weight measurements, two-way ANOVA with Sidak’s multiple comparison test and paired t test were used to determine significance, respectively. For all glycogen measurements, data are presented as mean +/− SD.
In this study, we demonstrated that glycogen is largely unnecessary for ccRCC cell growth in a variety of models and stress conditions, clarifying an important clinical distinction for a classical biological feature of the disease. Only under low oxygen and low lipid conditions did inhibition of glycogen breakdown appear to modestly reduce cell growth. One explanation for this phenotype could be that ccRCC cells metabolize glycogen-derived glucose in pathways important for lipid synthesis, which is why no phenotype was observed in lipid replete culture conditions. It remains perplexing why 25mM exogenous glucose could not compensate for the lack of glycogen-derived glucose during lipid starvation. Nevertheless, since this phenotype was not observed in transplantable in vivo models, it is likely that overall deregulated glycogen metabolism in ccRCC is a side effect of constitutive HIF-1α signaling with minimal biological importance under conventional stress conditions (i.e. low glucose, low oxygen). In other cancer types, such as GBM11 and NSCLC12, data does exist supporting a pro-tumorigenic role of glycogen. Whether these tumor microenvironments have reduced fatty acid or triglyceride availability is unknown. Therefore, a key unanswered question remains in how cancer cells of distinct metabolic dependencies and microenvironments utilize glycogen. In our ccRCC models, we reproducibly observe glycogen degradation in low glucose and, conversely, glycogen retention in PYGB/L DKO cells exposed to glucose deprivation. This indicates ccRCC cells mobilize glycogen-derived glucose for some metabolic processes. Based on the glycogen labeling experiment, potential metabolic pathways include glycolysis, serine/glycine biosynthesis, and the pentose phosphate pathway. More in depth metabolite analyses, such as antioxidant readouts or lipidomics, could clarify and connect a metabolic role of glycogen to a specific stress condition. In vivo models of PYGB/L DKO tumor growth in either a low- or high-fat diet to mimic changes in serum lipids, or with antiangiogenic treatment to intensify a hypoxic tumor microenvironment, could also be examined.
Future work on glycogen in ccRCC could identify distinct destinations of glycogen-derived glucose under specific culture conditions. This may reveal synthetic lethality approaches between GYS1 or PYGB/L inhibition, tailored to a patient’s unique tumor metabolism. For example, tumors addicted to glutamine, fatty acid, or acetate availability may become vulnerable when glycogen cannot feed glucose-1-phosphate into the central carbon pathway25–27. Additionally, it has recently been described that glycogen breakdown in the nucleus can regulate gene expression through altering histone acetylation in non-small cell lung cancer12. Whether or not nuclear glycogen impacts the epigenetic landscape, or if the epigenetic profile itself can alleviate any proliferation defects from the loss of glycogen metabolism in ccRCC, has yet to be explored. Another avenue of synthetic lethality could be in serine/glycine biosynthesis (Extended data figure 6d). Nevertheless, we suggest that elevated glycogen content in ccRCC patient tumors should not be considered a therapeutic target on its own.
Methods
Primary Patient Samples
Deidentified fresh-frozen matched ccRCC tumor/normal samples were obtained from the Cooperative Human Tissue Network (CHTN), which operates with the review and approval of their local Institutional Review Boards.
Cell Culture and Cell Proliferation Assays
Human ccRCC cell lines (UMRC2, 786-O, RCC4, and UOK101) were obtained from the American Type Culture Collection (ATCC) and cultured in DMEM supplemented with 10% FBS and Penn/Strep. All cells were routinely confirmed to be Mycoplasma negative (MycoAlert; tested every 3 months). For culture conditions with various glucose concentrations, cells were maintained in glucose-free DMEM supplemented with 10% dialyzed FBS (cat. 100-108, GeminiBio) and indicated concentrations of glucose. Hypoxic conditions (0.5% O2 and 1% O2) were achieved in a Baker Ruskinn in vivo2 workstation, by supplementing ambient air with balanced N2 and CO2. For lipid depletion experiments, cells were cultured in charcoal-stripped FBS (cat. 900-123, GeminiBio). Cell proliferation assays were performed using WST-1 reagent (cat. 5015944001, Sigma-Aldrich,): cells were plated in 96-well plates at 800-1,500 cells/well and allowed to attach overnight. The medium was changed according to indicated culture conditions on the following day, which was considered as Day 0. Cells were subjected to WST-1 assay following manufacturers protocol on each day. Cell proliferation rate was represented by relative absorbance, which was determined by normalizing to the absorbance number at Day 0 of the assay. Additional proliferation assays were performed using Trypan Blue exclusion and labeled as “Total Live Cells” on the Y axis (see Figure 3j and Extended data figure 4h (upper panel)). Cells were plated in 6-well plates at 50,000-100,000 cells/well and allowed to adhere overnight. The next day, cells were given fresh medium and cultured in the experimental conditions. At each time point, cells were trypsinized and resuspended in FBS-containing medium. Cell/trypan blue mixtures were counted by a Countess II (Life Technologies) and corrected for dilutions.
Boyden Chamber Cell Migration Assay
50,000 UMRC2 cells were seeded in 0.1 ml of 0% FBS, DMEM (0mM glucose) per transwell polycarbonate insert with 8μm pores (cat. 3422, Corning). Approximately 0.6 ml of either 0% or 10% FBS DMEM (25 mM glucose) was added to each bottom well. Following overnight incubation, inserts were washed with PBS and then gently scraped with a cotton swab (topside only). Next, membrane inserts were incubated in approximately 0.6 ml of 0.5% crystal violet (cat. C6158, Sigma-Aldrich) in 20% methanol for 10 minutes. Transwells were washed twice with PBS and allowed to dry overnight. Membrane inserts were cut out and mounted on a microscope slide for imaging.
Plasmids, Lentivirus Production, and Viral Transduction
For shRNAs, the lentiviral vector pLKO.1 SCR (scrambled shRNA plasmid no. 17920) was from Addgene. shRNAs targeting HIF1A (shHIF1A_52, shHIF1A_9) and EPAS1 (shHIF2A_6, shHIF2A_7) were described previously9. For genetic knockout using CRISPR/Cas9, the lentiviral vector LentiCRISPR v2 (plasmid no. 52961) and LentiCRISPRv2GFP (plasmid no. 82416) were obtained from Addgene. Human single-guide RNAs (sgRNA) targeting GYS1 #1 (GAACGCAGTGCTCTTCGAAG), #3 (CTACACGGTGCTGCAGACGA); PYGL #1 (GAAGCTGCTCCCTCGACATT), #3 (TAGCCACGCCATTCACAGCA), and #4 (GAGGACCCGGGAGATGTTCT) along with a control sgRNA targeting mouse Rosa26 locus (AAGATGGGCGGGAGTCTTCT) were cloned into LentiCRISPR v2 plasmid, while sgRNAs targeting PYGB #1 (CAACGTGGGAGACTACATCG) and #4 (CCACCTTCTCCACGTCCACC) along with a control sgRNA targeting LacZ (TCGTTTTACAACGTCGTGAC) were cloned into LentiCRISPRv2GFP plasmid. To produce lentiviruses, 293T cells were co-transfected with shRNA or CRISPR plasmid of interest along with packaging plasmids psPAX2 and pMD2.G using FuGENE 6 transfection reagent (cat. E2691, Promega). Lentiviruses were collected 48 hours after transfection. Viruses were used with 8 μg/ml polybrene for infection. For the LentiCRISPR v2 system, cells were selected with 4 μg/ml puromycin for 5 days to establish stable cell lines, while for LentiCRISPRv2GFP system, top 50% GFP positive cells were sorted for future culture and analysis. For PYGB overexpression analyses, 25 μl of pre-made, constitutive expression lentiviral vector, pLOC-PYGB (cat. OHS5899-202619959, Dharmacon), were added to 1.5 ml of UMRC2 cells. Cells were selected with 5 μg/ml blasticidin for 4 days prior to subsequent experimentation.
Western Blot Analysis
Cells and tumor tissue samples were lysed in RIPA lysis and extraction buffer (cat. 89900, ThermoFisher Scientific) containing Roche complete ULTRA Protease/Phosphatase Inhibitor (cat. 05892791001). Protein concentration was quantified with Pierce BCA Protein Assay Kit (cat. 23225, ThermoFisher Scientific). Isolated proteins were resolved by SDS-PAGE, and Western blot analysis was performed. All primary antibodies were diluted 1:1,000 in 5% w/v nonfat milk. Blots were incubated with primary antibodies overnight at 4°C. GYS1 (cat. ab40810) and ACTIN (cat. ab3280) antibodies were from abcam; HIF-1α antibody was from Cayman (cat. 10006421); HIF-2α antibody was from Novus Biologicals (cat. NB100-122); GAPDH antibody was from Cell Signaling Technology (cat. 2118); PYGL antibody was from Sigma (cat. HPA000962); PYGB antibody was from proteintech (cat. 12075-1-AP). Primary antibodies were detected using horseradish peroxidase–conjugated secondary antibodies from Cell Signaling Technology (cat. 7074) followed by exposure to enhanced chemiluminescence substrate (cat. NEL103001EA, PerkinElmer) or SuperSignal West Femto Maximum Sensitivity Substrate (cat. 34095, ThermoFisher Scientific).
Reagents
GPi (pan-glycogen phosphorylase inhibitor) CP316819 was purchased from Tocris (cat. 3542).
TCGA RNA-seq Analysis
RNA-seq data for ccRCC and normal kidney samples were downloaded and analyzed from the TCGA on April 2, 2013 as previously described17. Differential gene expression analysis of tumor and normal samples were performed using DeSeq (Bioconductor Version 2.12). Box and whisker plots correspond to 5-95th percentiles (bars), 25-75th percentiles (box), and median (line in box).
RNA Extraction, Real-Time Quantitative RT-PCR Analysis
Total RNA was isolated using the RNeasy Mini Kit (cat. 74104, QIAGEN), and cDNA was synthesized using the High-Capacity RNA-to-cDNA Kit (cat. 4387406, ThermoFisher Scientific). Quantitative reverse-transcription PCR (qRT-PCR) was performed on a ViiA7 Real-Time PCR system from Applied Biosystems. Predesigned TaqMan primers were obtained from ThermoFisher Scientific for the following genes: TBP (Hs00427620_m1), ACTB (Hs01060665_g1), HIF1A (Hs00153153_m1), HIF2A (Hs01026149_m1), CCND1 (Hs00765553_m1), PDK1 (Hs00176853_m1), GYS1 (Hs00157863_m1), PYGB (Hs00765686_m1), PYGL (Hs00958087_m1), PYGM (Hs00989942_m1), and RNA18S/45S (Hs03928985_g1).
Glycogen Quantification
Glycogen levels were measured using the Glycogen Assay Kit II (Colorimetric) from abcam (cat. Ab169558). Briefly, cells or tumor tissues were homogenized with dH2O on ice and then boiled for 10 min. Homogenates were then spun at 13,000 rpm for 10 min and supernatants were assayed for glycogen content. Results were normalized by protein content.
Matrigel-Based Spheroid Growth Assay
Matrigel-based 3D spheroids formation technique was described previously28. Briefly, 3,000 cells per well were plated in a 96-well ultra-low attachment plate (cat. CLS3474, Sigma) along with DMEM plus 10% FBS and 2.5% matrigel (cat. 354234, Corning). Plates were centrifuged at 1,500 rpm to promote spheroid formation, and then imaged at indicated time points using the EVOS FL Imaging System. Final pictures were taken at 40X magnification. Spheroid volume was calculated using a previously published ImageJ macro29.
Metabolites and Glycogen Tracing
Mass spectrometry-based metabolomics analysis of primary ccRCC was performed with Metabolon (Extended Data Figure 1b), as previously described17. In addition, publicly available metabolomics data from Hakimi, et al.16 were downloaded and values normalized to normal kidney tissue (Figure 1c). For the glycogen tracing experiment, cells were seeded at 50-70% confluency in 15 cm dishes (Day 0). The following day (Day 1), media was changed to 1% dialyzed FBS, 0 mM glucose DMEM, to deplete unlabeled glycogen stores, and incubated at 1% O2 overnight. The next day (Day 2), 25mM of uniformly labeled 13C ([U-13C]) glucose (cat. CLM-1396-1, Cambridge Isotope Lab.) was added to cells, to regenerate glycogen with labeled glucose, and cultured overnight at 1% O2. The following day (Day 3), media was aspirated and cells were washed twice with 1X PBS to remove labeled glucose. Cells were then incubated at 1% O2 overnight in fresh 1% dialyzed FBS, 0 mM glucose DMEM with 10 μM of GPi (see reagents) to prevent the breakdown of labeled glycogen. On the last day (Day 4), media was changed to either DMSO control or 10 μM GPi in fresh 1% dialyzed FBS, 0 mM glucose DMEM and cultured for 0, 3, or 6 hrs. At these time points, cell metabolites were extracted by (1) aspirating media, (2) washing twice with cold PBS, (3) adding 0.5 ml of 4% perchloric acid, and (4) transferring semi-frozen supernatant to microfuge tubes. All samples were submitted to the Metabolomic Core at the Children’s Hospital of Philadelphia for LC/MS analysis. Data are normalized to internal metabolite controls and presented as atomic percent excess (APE) to describe the percentage of a 13C-labeled metabolite relative to its unlabeled form.
Periodic Acid Schiff Staining
Glycogen was detected in tumor sections following a standardized periodic acid Schiff (PAS) staining technique, which was performed by the Molecular Pathology & Imaging Core at the University of Pennsylvania.
Mice and Xenograft Experiments
Xenograft tumor experiments were approved by the Animal Care and Use Committee at the University of Pennsylvania. 200μL of 5 million UMRC2 control or knockout cells were subcutaneously injected into opposing flanks of the same 4-6 week old female NIH-III nude mouse (strain code 201, Charles River), in a 1:1 mixture of DMEM and matrigel. Once palpable tumors were established, tumor volume was monitored by caliper measurements. Upon completion of the experiment, the animals were sacrificed by CO2 inhalation, followed by cervical dislocation, and xenograft tumors were dissected for downstream analyses.
Statistics and Reproducibility
Experimental significance was determined by P value, whereby any value 0.05 or below was considered mathematically unlikely to be random. Unpaired, two-tailed Student’s t test was used for simple column analyses between two conditions, unless comparing matched samples, such as from same patient or mouse, in which case paired t tests were employed. Two-way ANOVA with Sidak’s multiple comparison correction test was used for more complex group analyses and multiple conditions (see individual figure legends). All graphs and statistical inquiries were generated using GraphPad Prism versions 7.0 - 9.0.1 (current). For all qRT-PCR and glycogen quantifications, data is derived from technical replicates, presented as mean +/− standard deviation (SD), and represents results of reproducible experiments. For all growth curves and metabolite tracing, data is derived from biological replicates and presented as mean +/− standard error of the mean (SEM). For box plots, graphs are shown with all points, center line as the median, box bounds as 25th and 75th percentiles, and whiskers as either 5th and 95th percentiles or minimum and maximum values (see individual figure legends). For all experiments shown, similar results were obtained across multiple cell lines (see Extended Data for additional cell lines) and reproduced at least once by multiple authors.
Extended Data
Extended Data Figure 1. (related to Figure 1). Glycogen synthesis and breakdown are hyperactive in ccRCC tumors.
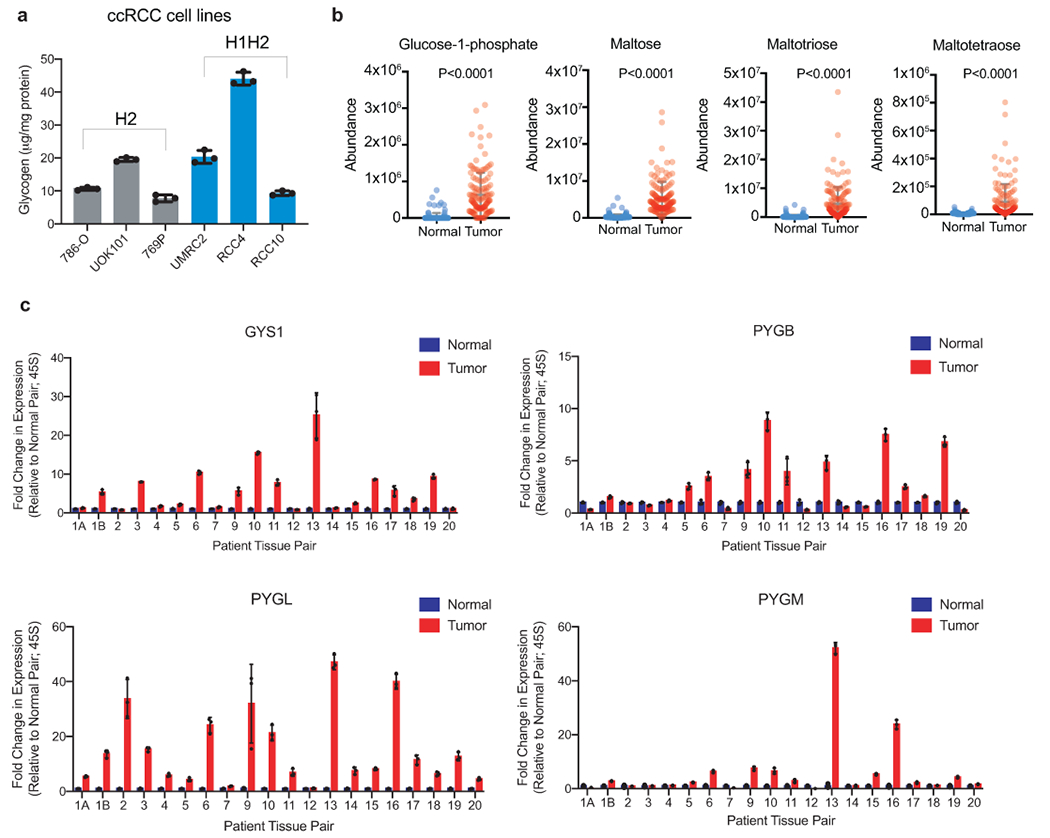
a. Glycogen quantification of six ccRCC cell lines in replete conditions (10% FBS, 25mM glucose DMEM) normalized to protein mass; n=3 technical replicates as an example of reproducible experiments. Data presented as mean +/− SD. “H2”: cell lines exclusively expressing HIF-2α. “H1H2”: cell lines expressing both HIF-1α and HIF-2α. b. Abundance of glycogen metabolism-related metabolites (glucose-1-phosphate, maltose, maltotriose, and maltotetraose) in n=138 biologically independent human ccRCC tumor/normal paired samples; data extracted from Hakimi AA, et al16. Data presented as mean +/− SEM. c. qRT-PCR of GYS1, PYGB, PYGL, and PYGM in 20 matched ccRCC and adjacent normal kidney tissues; n=3 technical replicates per tissue sample as an example of reproducible experiments. Data presented as mean +/− SD. Ribosomal subunit 45S RNA (45S) utilized as the endogenous control gene. P values determined by two-tailed Student’s t test.
Extended Data Figure 2. (related to Figure 2). Glycogen synthesis enzyme GYS1 is overrepresented in ccRCC and regulated by HIF-1α.
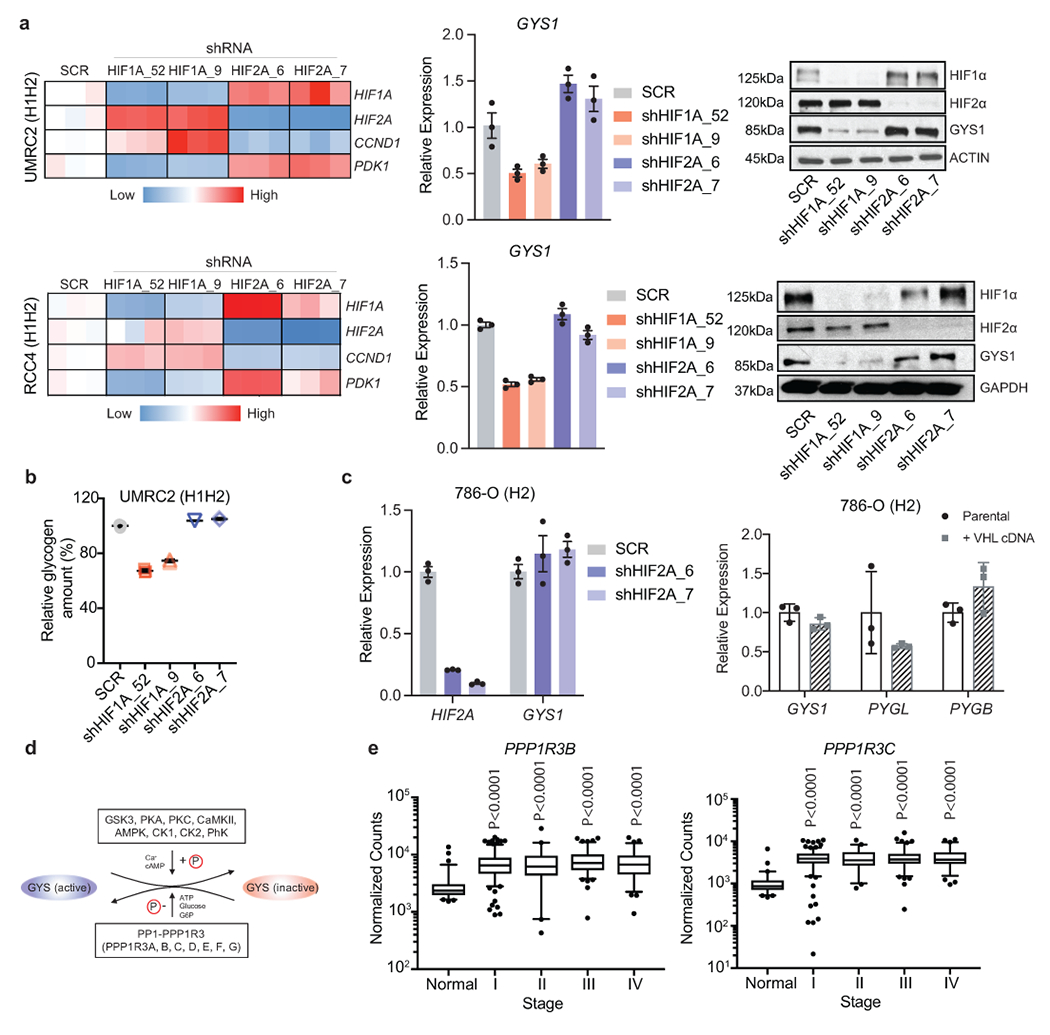
a. UMRC2 and RCC4 (H1H2) ccRCC cells transduced with two independent shRNAs against HIF1A (shHIF1A_52 and shHIF1A_9), EPAS1 (shHIF2A_6 and shHIF2A_7), or a SCR (scrambled shRNA) control. qRT-PCR and Western blot for GYS1 shown. PDK1 and CCND1 included as positive controls for HIF-1α and HIF-2α suppression, respectively. For qRT-PCR, TBP and ACTB utilized as endogenous control genes, and relative mRNA expression determined by normalizing to expression in SCR samples; n=3 technical replicates as an example of reproducible experiments. Data are presented as mean +/− SD. b. Glycogen quantification in UMRC2 cells transduced with indicated shRNAs after 4 days; n=3 technical replicates as an example of reproducible experiments. Data are presented as mean +/− SD. Relative glycogen amount determined by normalizing to levels in SCR samples. c. (Left panel) EPAS1 (HIF-2A) depleted by two independent shRNAs (shHIF2A_6 and shHIF2A_7) or (right panel) ectopic VHL expression in 786-O (H2) ccRCC cells. Expression relative to ACTB shown by qRT-PCR; n=3 technical replicates as an example of reproducible experiments. Data are presented as mean +/− SD. d. Schematic representation of GYS regulation by PP1 and PPP1R3 (see text for details). e. Normalized RNA-seq reads of PPP1R3B and PPP1R3C in stage-stratified ccRCC (n=428) and normal kidney (n=66) samples; n denotes biologically independent human tissue samples. RNA-seq data obtained from TCGA. Box plots (min. to max. all points): center=median, bounds=25th and 75th percentiles, whiskers=5th and 95th percentiles. P values determined by two-tailed Student’s t test.
Extended Data Figure 3. (related to Figure 2). Glycogen is dispensable for ccRCC cell growth in vitro.
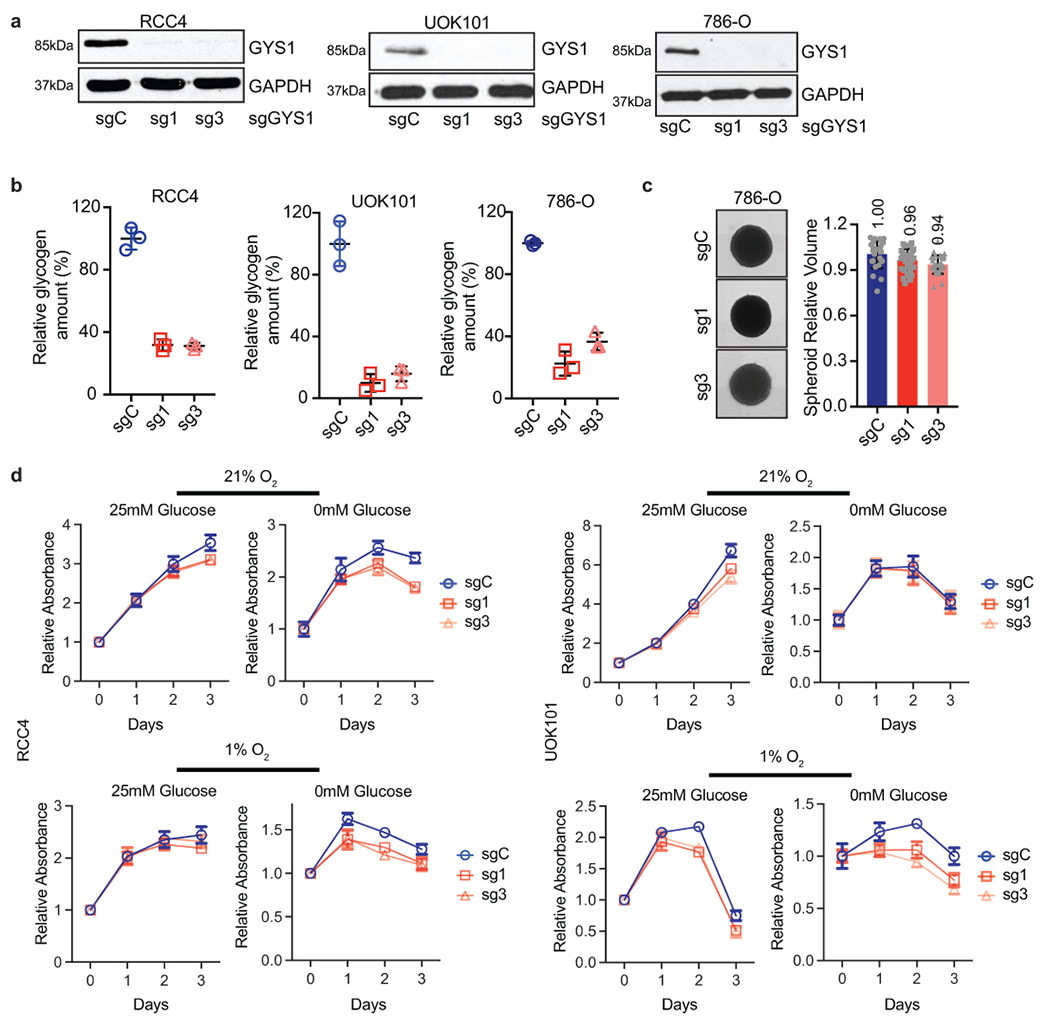
a. RCC4, UOK101, and 786-O ccRCC cells transduced with two independent sgRNAs against GYS1 (sg1 and sg3) or a control sgRNA (sgC). Western blot analysis performed 7 days after virus infection to assess GYS1 expression. b. Glycogen levels measured in cells described in a on day 7 after virus infection; n=3 technical replicates as an example of reproducible experiments. Data presented as mean +/− SD. Relative glycogen amount was determined by normalizing to glycogen level in sgC cells. c. Representative images acquired at 40X magnification and relative volumes of spheroids formed by 786-O cells described in a after 19 days culture; n=24 biologically independent spheroids. Data presented as mean +/− SEM. Relative volume was determined by normalizing to that of sgC spheroids. Numbers denote average relative volumes. d. Growth curves for cells described in a cultured in medium containing 1% FBS combined with indicated glucose and oxygen concentrations; n=6 biologically independent cell populations. Data presented as mean +/− SEM. Relative absorbance was determined by normalizing to values at Day 0.
Extended Data Figure 4. (related to Figure 3). PYGL is not required for glycogen breakdown and in vitro ccRCC cell growth.
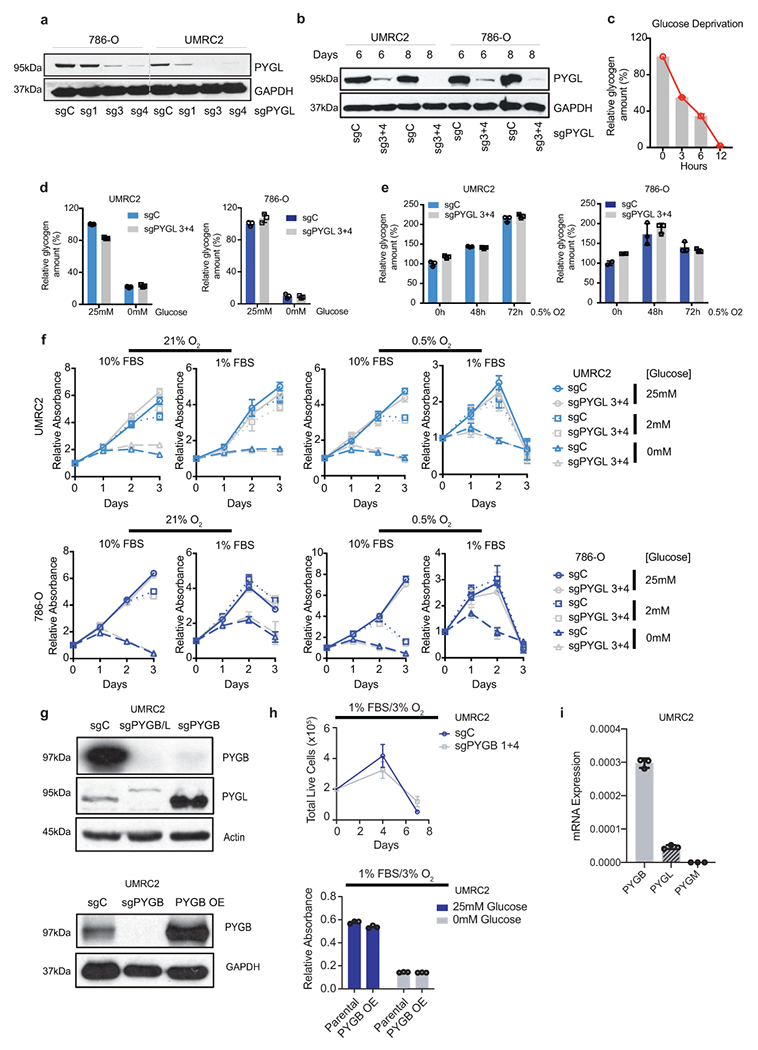
a, b. Protein assessment of 786-O and UMRC2 ccRCC cells transduced with three independent or two pooled sgRNAs against PYGL (sg1, sg3, sg4, or sg3+4) or a control sgRNA (sgC). Samples collected at 7 (a) or 6,8 (b) days after lentiviral infection. c. UMRC2 cells cultured in glucose-free medium for indicated time points, glycogen extracted and quantified. Relative glycogen amount determined by normalizing to glycogen level in cells at 0 hour. c. Cells described in b cultured in medium with 25mM glucose or starved in glucose-free medium for 6 hours, glycogen extracted and quantified. Relative glycogen amount determined by normalizing to glycogen level in sgC cells cultured in medium with 25mM glucose. e. Cells described in b cultured in 0.5% O2 for indicated time points, glycogen extracted and quantified. Relative glycogen amount determined by normalizing to glycogen level in sgC cells cultured in 21% O2. f. Growth curves for cells described in b cultured in indicated conditions; n=6 biologically independent cell populations. Relative absorbance determined by normalizing to values at Day 0. g. Protein assessment of pooled sgRNAs 1+4 targeting PYGB (sgPYGB) or overexpression of PYGB (PYGB OE), upper and bottom panels respectively. sgC: control (guide targeting LacZ); sgPYGB/L: double knockout. h. Growth assays of UMRC2 under the indicated conditions. Live cell numbers were measured by Trypan Blue exclusion, and finalized values adjusted for dilution; n=3 biologically independent cell populations. PYGB knockout and PYGB overexpression (upper and bottom panels respectively). Parental refers to uninfected UMRC2 cells. I. qRT-PCR on UMRC2 cells for glycogen phosphorylase isoforms; n=3 technical replicates. Data presented as mean +/−SD. Ribosomal subunit 45S RNA (45S) utilized as the endogenous control gene. For all glycogen measurements, data from n=3 technical replicates and presented as mean +/− SD. For all growth curves, data are presented as mean +/− SEM.
Extended Data Figure 5. (related to Figure 3). ccRCC tumor cells do not rely on glycogen breakdown for growth.
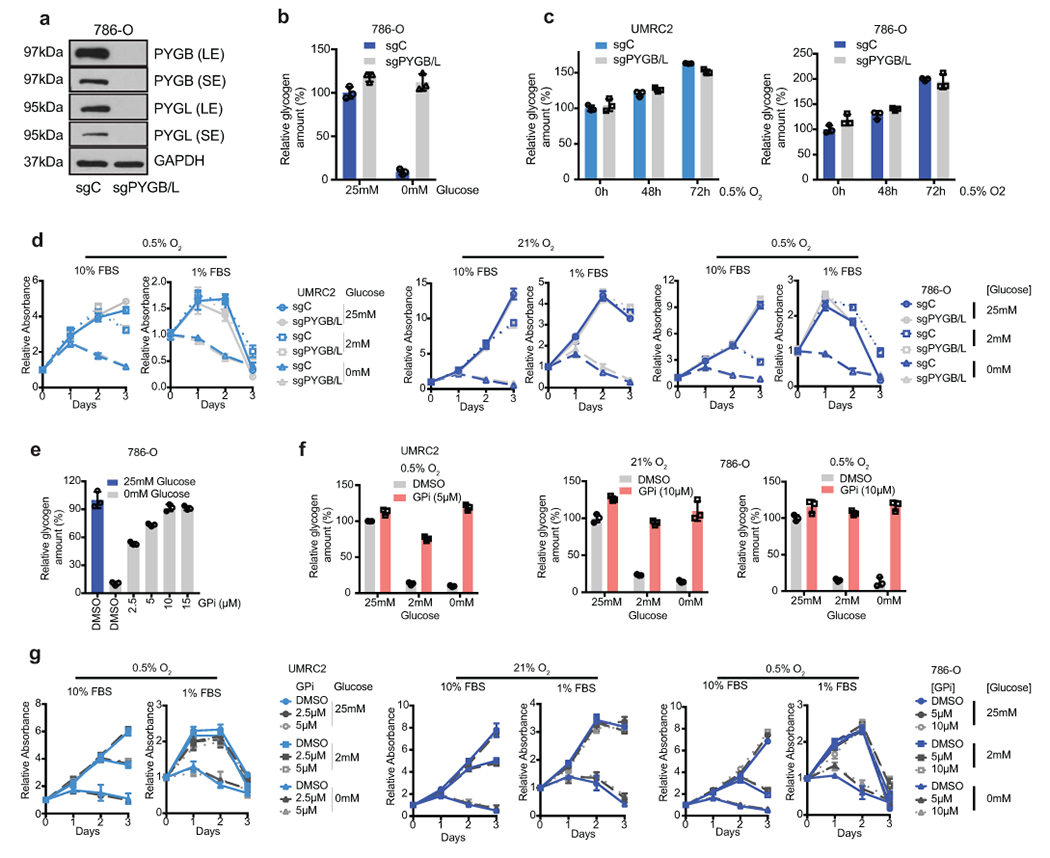
a. WT and PYGL KO 786-O cells transduced with a control sgRNA against LacZ (sgC) or combined two sgRNAs targeting PYGB (sgPYGB/L), respectively. Top 50% GFP positive cells sorted for culture. Western blot analysis performed 14 days after virus infection to assess PYGL and PYGB expression. SE, short exposure; LE, long exposure. b. Cells described in a cultured in medium with 25mM glucose or starved in glucose-free medium for 6 hours, glycogen extracted and quantified. Relative glycogen amount determined by normalizing to glycogen level in sgC cells cultured in medium with 25mM glucose. c. UMRC2 and 786-O sgC vs. sgPYGL/B ccRCC cells cultured in 0.5% O2 for indicated time points, glycogen extracted and quantified. Relative glycogen amount determined by normalizing to glycogen level in sgC cells cultured in 21% O2. d. Growth curves for UMRC2 cells described in Figure 3c and 786-O cells described in a cultured in indicated conditions. Relative absorbance determined by normalizing to values at Day 0. e. 786-O cells cultured in medium with 25mM or 0mM glucose, treated with indicated concentrations of DMSO or GPi for 6 hours. Glycogen extracted and quantified. Relative glycogen amount determined by normalizing to glycogen level in cells cultured in 25mM glucose condition. f. UMRC2 and 786-O cells cultured in medium with 25mM, 2mM, or 0mM glucose, treated with DMSO or 10μM GPi in 21% O2 or 0.5% O2 for 48 hours. Glycogen extracted and quantified. Relative glycogen amount determined by normalizing to glycogen level in cells cultured in 25mM glucose condition treated with DMSO. g. Growth curves for UMRC2 and 786-O parental cells treated with DMSO, 5μM, or 10μM GPi and cultured in indicated conditions. Relative absorbance determined by normalizing to values at Day 0. For all glycogen measurements, data from n=3 technical replicates and presented as mean +/− SD. For all growth curves, data from n=6 biologically independent cell populations and presented as mean +/− SEM.
Extended Data Figure 6. (related to Figure 3). Glycogen-derived glucose broadly enters the central carbon pathway during glucose starvation.
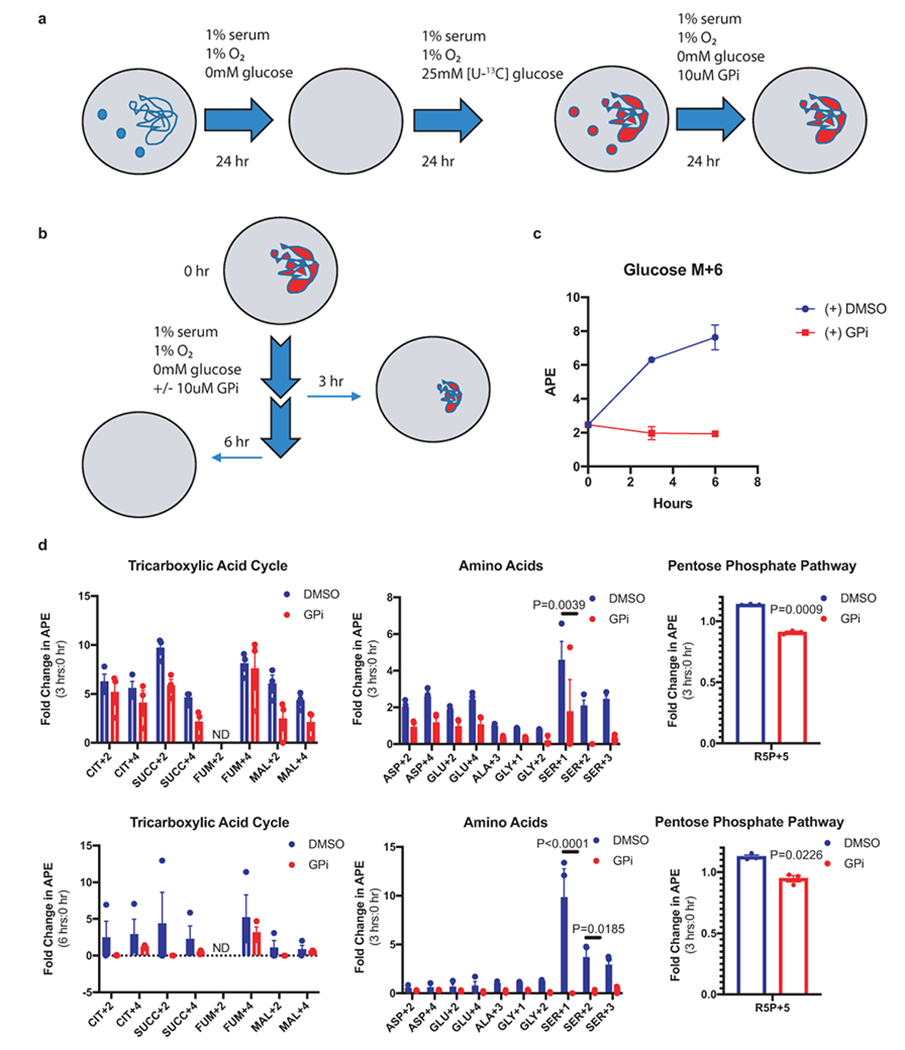
a. Glycogen labeling experimental design. [U-13C]: uniformly labeled heavy carbon (13C); GPi: glycogen phosphorylase inhibitor. Small blue or red circles denote free, unlabeled or labeled glucose, respectively. Large blue or red undefined shapes denote unlabeled or labeled glycogen, respectively. b. Sample collection scheme for metabolomic analysis following labeled glycogen breakdown or retention. c. Percentage of labeled glucose (Glucose M+6) relative to unlabeled glucose in cells over 6 hours of glycogen breakdown or retention; n=3 biologically independent cell populations. d. Fold change in APE relative to time 0 for indicated metabolites after 3 hours (upper panel) and 6 hours (bottom panel) of glycogen breakdown or retention; n=3 biologically independent cell populations. For all metabolite measurements, data presented as mean +/− SEM. CIT: citrate; SUCC: succinate; FUM: fumarate; MAL: malate; ASP: aspartate; GLU: glutamate; ALA: alanine; GLY: glycine; SER: serine; R5P: ribose-5-phosphate. ND: not detectable. (+1,2,3 denotes number of 13C carbons). Two-way ANOVA with Sidak’s multiple comparison test was used to determine significance.
Extended Data Figure 7. (related to Figure 3). Glycogen availability does not alter cell migration.
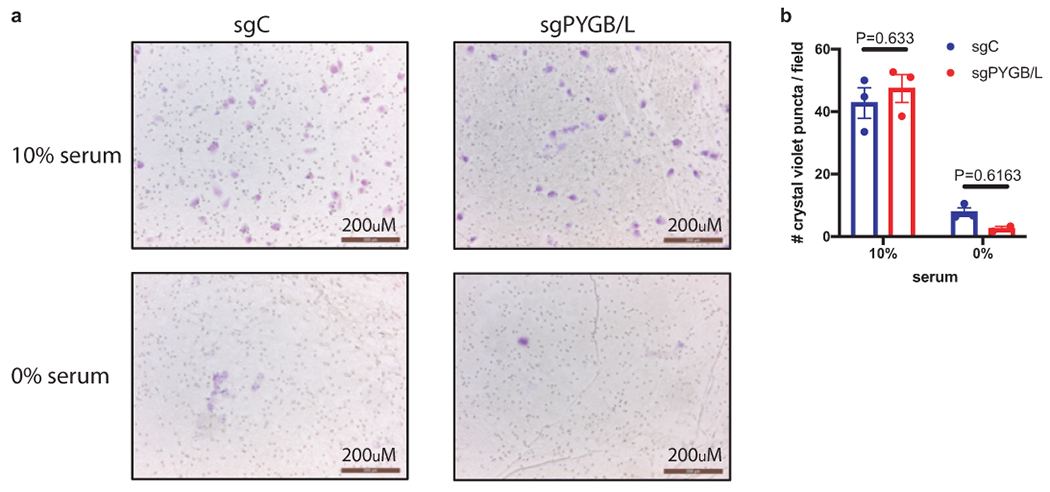
a. Representative field image of crystal violet-stained UMRC2 cells under the specified conditions and genetic alterations. Scale bar=200μm. b. Quantification of cell migration calculated as average cell number per field; n=3 biologically independent cell populations (average count of 4 center-oriented fields per sample). Data presented as mean +/− SEM. sgC: UMRC2 control sgLacZ; sgPYGB/L: UMRC2 PYGB/L double knockout. Two-way ANOVA with Sidak’s multiple comparison test was used to determine significance.
Acknowledgements
We thank the past and present members of the Simon laboratory for their helpful discussions on the project. We are grateful to Y. Daikhin, O. Horyn, and Ilana Nissim (Metabolomics Core Facility, Children’s Hospital of Philadelphia) for the glycogen tracing measurements. This work was supported by a NIH National Research Service Award (F31CA239514-01, to J.G.) and National Cancer Institute grants (P01CA104838 and R35CA220483, to M.C.S.).
Footnotes
Competing Interests
The authors declare no competing interests.
Data Availability
Human patient ccRCC tumor and normal tissue RNA-seq dataset was obtained from The Cancer Genome Atlas (TCGA) at https://www.cbioportal.org (see above TCGA RNA-seq analysis for further details). Human patient ccRCC tumor and normal metabolomics dataset was obtained from Hakimi, et al16 (https://www.cell.com/cancer-cell/comments/S1535-6108(15)00468-7#secsectitle0145). All data that support the findings of this study are available from the corresponding author upon request.
References
- 1.Ericsson JL, Seljelid ROS. Comparative light and electron microscopic observations of the cytoplasmic matrix in renal carcinomas. Virchows Arch Pathol Anat Physiol Klin Med. 1966;341(3):204–223. [DOI] [PubMed] [Google Scholar]
- 2.NC I. SEER Cancer Sta Facts: Kidney and Renal Pelvis Cancer. 2018. [Google Scholar]
- 3.Sanchez DJ, Simon MC. Genetic and metabolic hallmarks of clear cell renal cell carcinoma. Biochim Biophys Acta - Rev Cancer. 2018;1870(1):23–31. doi: 10.1016/J.BBCAN.2018.06.003 [DOI] [PMC free article] [PubMed] [Google Scholar]
- 4.Gordan JD, Lal P, Dondeti VR, et al. HIF-α Effects on c-Myc Distinguish Two Subtypes of Sporadic VHL-Deficient Clear Cell Renal Carcinoma. Cancer Cell. 2008;14(6):435–446. doi: 10.1016/J.CCR.2008.10.016 [DOI] [PMC free article] [PubMed] [Google Scholar]
- 5.Wallace EM, Rizzi JP, Han G, et al. A Small-Molecule Antagonist of HIF2α Is Efficacious in Preclinical Models of Renal Cell Carcinoma. Cancer Res. 2016;76(18):5491 LP - 5500. doi: 10.1158/0008-5472.CAN-16-0473 [DOI] [PubMed] [Google Scholar]
- 6.Courtney KD, Infante JR, Lam ET, et al. Phase I dose-escalation trial of PT2385, a first-in-class hypoxia-inducible factor-2a antagonist in patients with previously treated advanced clear cell renal cell carcinoma. J Clin Oncol. 2018;36(9):867–874. doi: 10.1200/JCO.2017.74.2627 [DOI] [PMC free article] [PubMed] [Google Scholar]
- 7.Zhang Y, Udayakumar D, Cai L, et al. Addressing metabolic heterogeneity in clear cell renal cell carcinoma with quantitative Dixon MRI. JCI insight. 2017;2(15):1–14. doi: 10.1172/jci.insight.94278 [DOI] [PMC free article] [PubMed] [Google Scholar]
- 8.Riscal R, Skuli N, Simon MC. Even Cancer Cells Watch Their Cholesterol. Mol Cell. 2019. doi: 10.1016/j.molcel.2019.09.008 [DOI] [PMC free article] [PubMed] [Google Scholar]
- 9.Qiu B, Ackerman D, Sanchez DJ, et al. HIF2α-Dependent Lipid Storage Promotes Endoplasmic Reticulum Homeostasis in Clear-Cell Renal Cell Carcinoma. Cancer Discov. 2015;5(6):652 LP - 667. doi: 10.1158/2159-8290.CD-14-1507 [DOI] [PMC free article] [PubMed] [Google Scholar]
- 10.Ackerman D, Tumanov S, Qiu B, et al. Triglycerides Promote Lipid Homeostasis during Hypoxic Stress by Balancing Fatty Acid Saturation. Cell Rep. 2018;24(10):2596–2605.e5. doi: 10.1016/j.celrep.2018.08.015 [DOI] [PMC free article] [PubMed] [Google Scholar]
- 11.Favaro E, Bensaad K, Chong MG, et al. Glucose Utilization via Glycogen Phosphorylase Sustains Proliferation and Prevents Premature Senescence in Cancer Cells. Cell Metab. 2012;16(6):751–764. doi: 10.1016/J.CMET.2012.10.017 [DOI] [PubMed] [Google Scholar]
- 12.Sun RC, Dukhande VV, Zhou Z, et al. Nuclear Glycogenolysis Modulates Histone Acetylation in Human Non-Small Cell Lung Cancers. Cell Metab. 2019;30(5):903–916.e7. doi: 10.1016/J.CMET.2019.08.014 [DOI] [PMC free article] [PubMed] [Google Scholar]
- 13.Adeva-Andany MM, González-Lucán M, Donapetry-García C, Fernández-Fernández C, Ameneiros-Rodríguez E. Glycogen metabolism in humans. BBA Clin. 2016;5:85–100. doi: 10.1016/J.BBACLI.2016.02.001 [DOI] [PMC free article] [PubMed] [Google Scholar]
- 14.Calì C, Tauffenberger A, Magistretti P. The strategic location of glycogen and lactate: From body energy reserve to brain plasticity. Front Cell Neurosci. 2019;13(March):1–7. doi: 10.3389/fncel.2019.00082 [DOI] [PMC free article] [PubMed] [Google Scholar]
- 15.Rousset M, Zweibaum A, Fogh J. Presence of Glycogen and Growth-related Variations in 58 Cultured Human Tumor Cell Lines of Various Tissue Origins. Cancer Res. 1981;41(3):1165 LP - 1170. http://cancerres.aacrjournals.org/content/41/3/1165.abstract. [PubMed] [Google Scholar]
- 16.Hakimi AA, Reznik E, Lee C-H, et al. An Integrated Metabolic Atlas of Clear Cell Renal Cell Carcinoma. Cancer Cell. 2016;29(1):104–116. doi: 10.1016/J.CCELL.2015.12.004 [DOI] [PMC free article] [PubMed] [Google Scholar]
- 17.Li B, Qiu B, Lee DSM, et al. Fructose-1,6-bisphosphatase opposes renal carcinoma progression. Nature. 2014;513(7517):251–255. doi: 10.1038/nature13557 [DOI] [PMC free article] [PubMed] [Google Scholar]
- 18.Zois CE, Harris AL. Glycogen metabolism has a key role in the cancer microenvironment and provides new targets for cancer therapy. J Mol Med. 2016;94(2):137–154. doi: 10.1007/s00109-015-1377-9 [DOI] [PMC free article] [PubMed] [Google Scholar]
- 19.Munro S, Ceulemans H, Bollen M, Diplexcito J, Cohen PTW. A novel glycogen-targeting subunit of protein phosphatase 1 that is regulated by insulin and shows differential tissue distribution in humans and rodents. FEBS J. 2005;272(6):1478–1489. doi: 10.1111/j.1742-4658.2005.04585.x [DOI] [PubMed] [Google Scholar]
- 20.Shen GM, Zhang FL, Liu XL, Zhang JW. Hypoxia-inducible factor 1-mediated regulation of PPP1R3C promotes glycogen accumulation in human MCF-7 cells under hypoxia. FEBS Lett. 2010;584(20):4366–4372. doi: 10.1016/j.febslet.2010.09.040 [DOI] [PubMed] [Google Scholar]
- 21.Yang R, Zhang M, Gustafson AR, et al. Loss of protein targeting to glycogen sensitizes human hepatocellular carcinoma cells towards glucose deprivation mediated oxidative stress and cell death. Biosci Rep. 2015;35(3). doi: 10.1042/BSR20150090 [DOI] [PMC free article] [PubMed] [Google Scholar]
- 22.Jurczak MJ, Danos AM, Rehrmann VR, Allison MB, Greenberg CC, Brady MJ. Transgenic overexpression of protein targeting to glycogen markedly increases adipocytic glycogen storage in mice. Am J Physiol - Endocrinol Metab. 2007;292(3):952–963. doi: 10.1152/ajpendo.00559.2006 [DOI] [PubMed] [Google Scholar]
- 23.Greenberg CC, Meredith KN, Yan L, Brady MJ. Protein targeting to glycogen overexpression results in the specific enhancement of glycogen storage in 3T3-L1 adipocytes. J Biol Chem. 2003;278(33):30835–30842. doi: 10.1074/jbc.M303846200 [DOI] [PubMed] [Google Scholar]
- 24.Bhanot H, Reddy MM, Nonami A, et al. Pathological glycogenesis through glycogen synthase 1 and suppression of excessive AMP kinase activity in myeloid leukemia cells. Leukemia. 2015;29(7):1555–1563. doi: 10.1038/leu.2015.46 [DOI] [PMC free article] [PubMed] [Google Scholar]
- 25.Varnier M, Leese GP, Thompson J, Rennie MJ. Stimulatory effect of glutamine on glycogen accumulation in human skeletal muscle. Am J Physiol Metab. 1995;269(2):E309–E315. doi: 10.1152/ajpendo.1995.269.2.E309 [DOI] [PubMed] [Google Scholar]
- 26.Lundsgaard A-M, Fritzen AM, Kiens B. Molecular Regulation of Fatty Acid Oxidation in Skeletal Muscle during Aerobic Exercise. Trends Endocrinol Metab. 2018;29(1):18–30. doi: 10.1016/J.TEM.2017.10.011 [DOI] [PubMed] [Google Scholar]
- 27.Hardin CD, Roberts TM. Differential Regulation of Glucose and Glycogen Metabolism in Vascular Smooth Muscle by Exogenous Substrates. J Mol Cell Cardiol. 1997;29(4):1207–1216. doi: 10.1006/JMCC.1996.0356 [DOI] [PubMed] [Google Scholar]
- 28.Vinci M, Gowan S, Boxall F, et al. Advances in establishment and analysis of three-dimensional tumor spheroid-based functional assays for target validation and drug evaluation. BMC Biol. 2012;10(1):29. doi: 10.1186/1741-7007-10-29 [DOI] [PMC free article] [PubMed] [Google Scholar]
- 29.Ivanov DP, Parker TL, Walker DA, et al. Multiplexing spheroid volume, resazurin and acid phosphatase viability assays for high-throughput screening of tumour spheroids and stem cell neurospheres. PLoS One. 2014;9(8):1–14. doi: 10.1371/journal.pone.0103817 [DOI] [PMC free article] [PubMed] [Google Scholar]


