

Abstract
In this Letter, we propose a novel triplex-parameter detection method to realize simultaneous radiometric, photoacoustic, and ultrasonic imaging based on single-pulse excitation. The optical attenuation, optical absorption, and acoustic impedance properties can be obtained simultaneously by analyzing the photoacoustic signals and the ultrasonic echo signals. To test the feasibility and accuracy of this method, agar phantoms with different absorption coefficients and elastic coefficients were measured. Then, this method was experimentally verified by imaging a leaf skeleton piece embedded in an agar cylinder. Furthermore, pilot experiments were performed by triplex imaging of pig ear tissue ex vivo to characterize the cartilage and surrounding tissue. Experimental results demonstrated that this technique has future potentials for visualizing and providing the functional and structural information of biological tissues.
Photoacoustic (PA) imaging is a noninvasive biomedical imaging modality, based upon the ultrasound induced by the pulsed laser due to thermoelastic expansion, which provides high optical contrast with high spatial resolution at unprecedented imaging depths [1–3]. When a sample is irradiated by a short excitation pulsed laser, optical absorption of the sample leads to nonradiative transition followed by a rapid local temperature rise. The localized temperature rise then causes thermal expansion as well as subsequent emission of PA wave generation based on the thermoelastic mechanism [4,5]. By recording the whole PA waves across the sample and extracting its peak amplitude mainly, the absorbed laser distribution on the sample can be reconstructed. The contrast of PA imaging is dominated by different optical absorption, making it an attractive candidate for biomedical applications [6–12]. Although PA techniques have made great progress in the past decade, there are few achievements that can simultaneously obtain multiple contrasts to eventually provide complementary information for pathological diagnosis [13–15].
In fact, when we use an ultrasonic transducer to detect the PA signals from the tissues, two additional images with different contrasts mechanisms can be obtained simultaneously. The radiometric and ultrasonic technique is readily implemented in PA setups in which the laser used for PA signal generation illuminates the transducer after passing through the sample. In radiometric imaging, the portion of the excitation laser beam that is transmitted through the sample impinges directly upon the active element, which usually has an extremely high absorption coefficient and increased efficiency of thermoacoustic conversion. Thus, another PA wave will be generated and detected by the piezoelectric material of the transducer [16,17]. Meanwhile, this PA wave will propagate to the sample and get reflected, so that an ultrasonic image can be obtained by using the echo [18]. In this way, for every laser pulse emitted, two PA waves are generated simultaneously, one originating from the sample, and the other originating within the transducer; one ultrasonic echo from the sample can be acquired later.
In this Letter, we proposed a triplex-parameter detection method to realize the simultaneous laser radiometric (LR), PA, and laser ultrasonic (LU) imaging based on single-pulse excitation. The optical attenuation, optical absorption, and acoustic impedance properties can be obtained simultaneously. This novel method will take full advantage of these three parameters to simultaneously assess the functional and biomechanical property of biological tissue. Additionally, three different contrast mechanisms may increase the diagnostic capability of the PA technique in biomedical and clinical studies.
The schematic diagram of the experimental setup is shown in Fig. 1. A picosecond pulsed laser operating at 532 nm wavelength with 400 Hz repetition rate and 7 ps pulse duration (COMPILER 532/266, Passat, Ltd., Canada) was used as the excitation source. The transmitted laser was focused by a 4× microscope objective lens (NA=0.1) to illuminate the target. The signal was generated from the illuminated point, traveled through distilled water, and then was captured by a customized ultrasonic transducer with 5 MHz center frequency. The signal was then amplified with a gain of 50 dB and recorded with a data acquisition card (NI PCI-5153EX, National Instruments) at a sampling rate of 100 M samples/s. The time sequence is described in Fig. 2. The data points were obtained by mechanically scanning the sample over the desired region with a step size of 20 μm with a scanning stage (LMS203 Fast XY Scanning stage, Thorlabs). For each step, the signals were averaged 100 times to improve the signal-to-noise ratio. For a 1 mm × 1 mm image area, scanning took up to roughly 10 min. All data was sent to a computer to be stored, and the signals were analyzed with the fast Hilbert transform, and then the LR/PA/LU images can be obtained by using the maximum intensity projection by MATLAB computation. During data acquisition, the sample was placed in a water container, and a thermocouple was used to measure and control the experimental temperature of 20 ± 0.1°C for carrying out all the measurements.
Fig. 1.
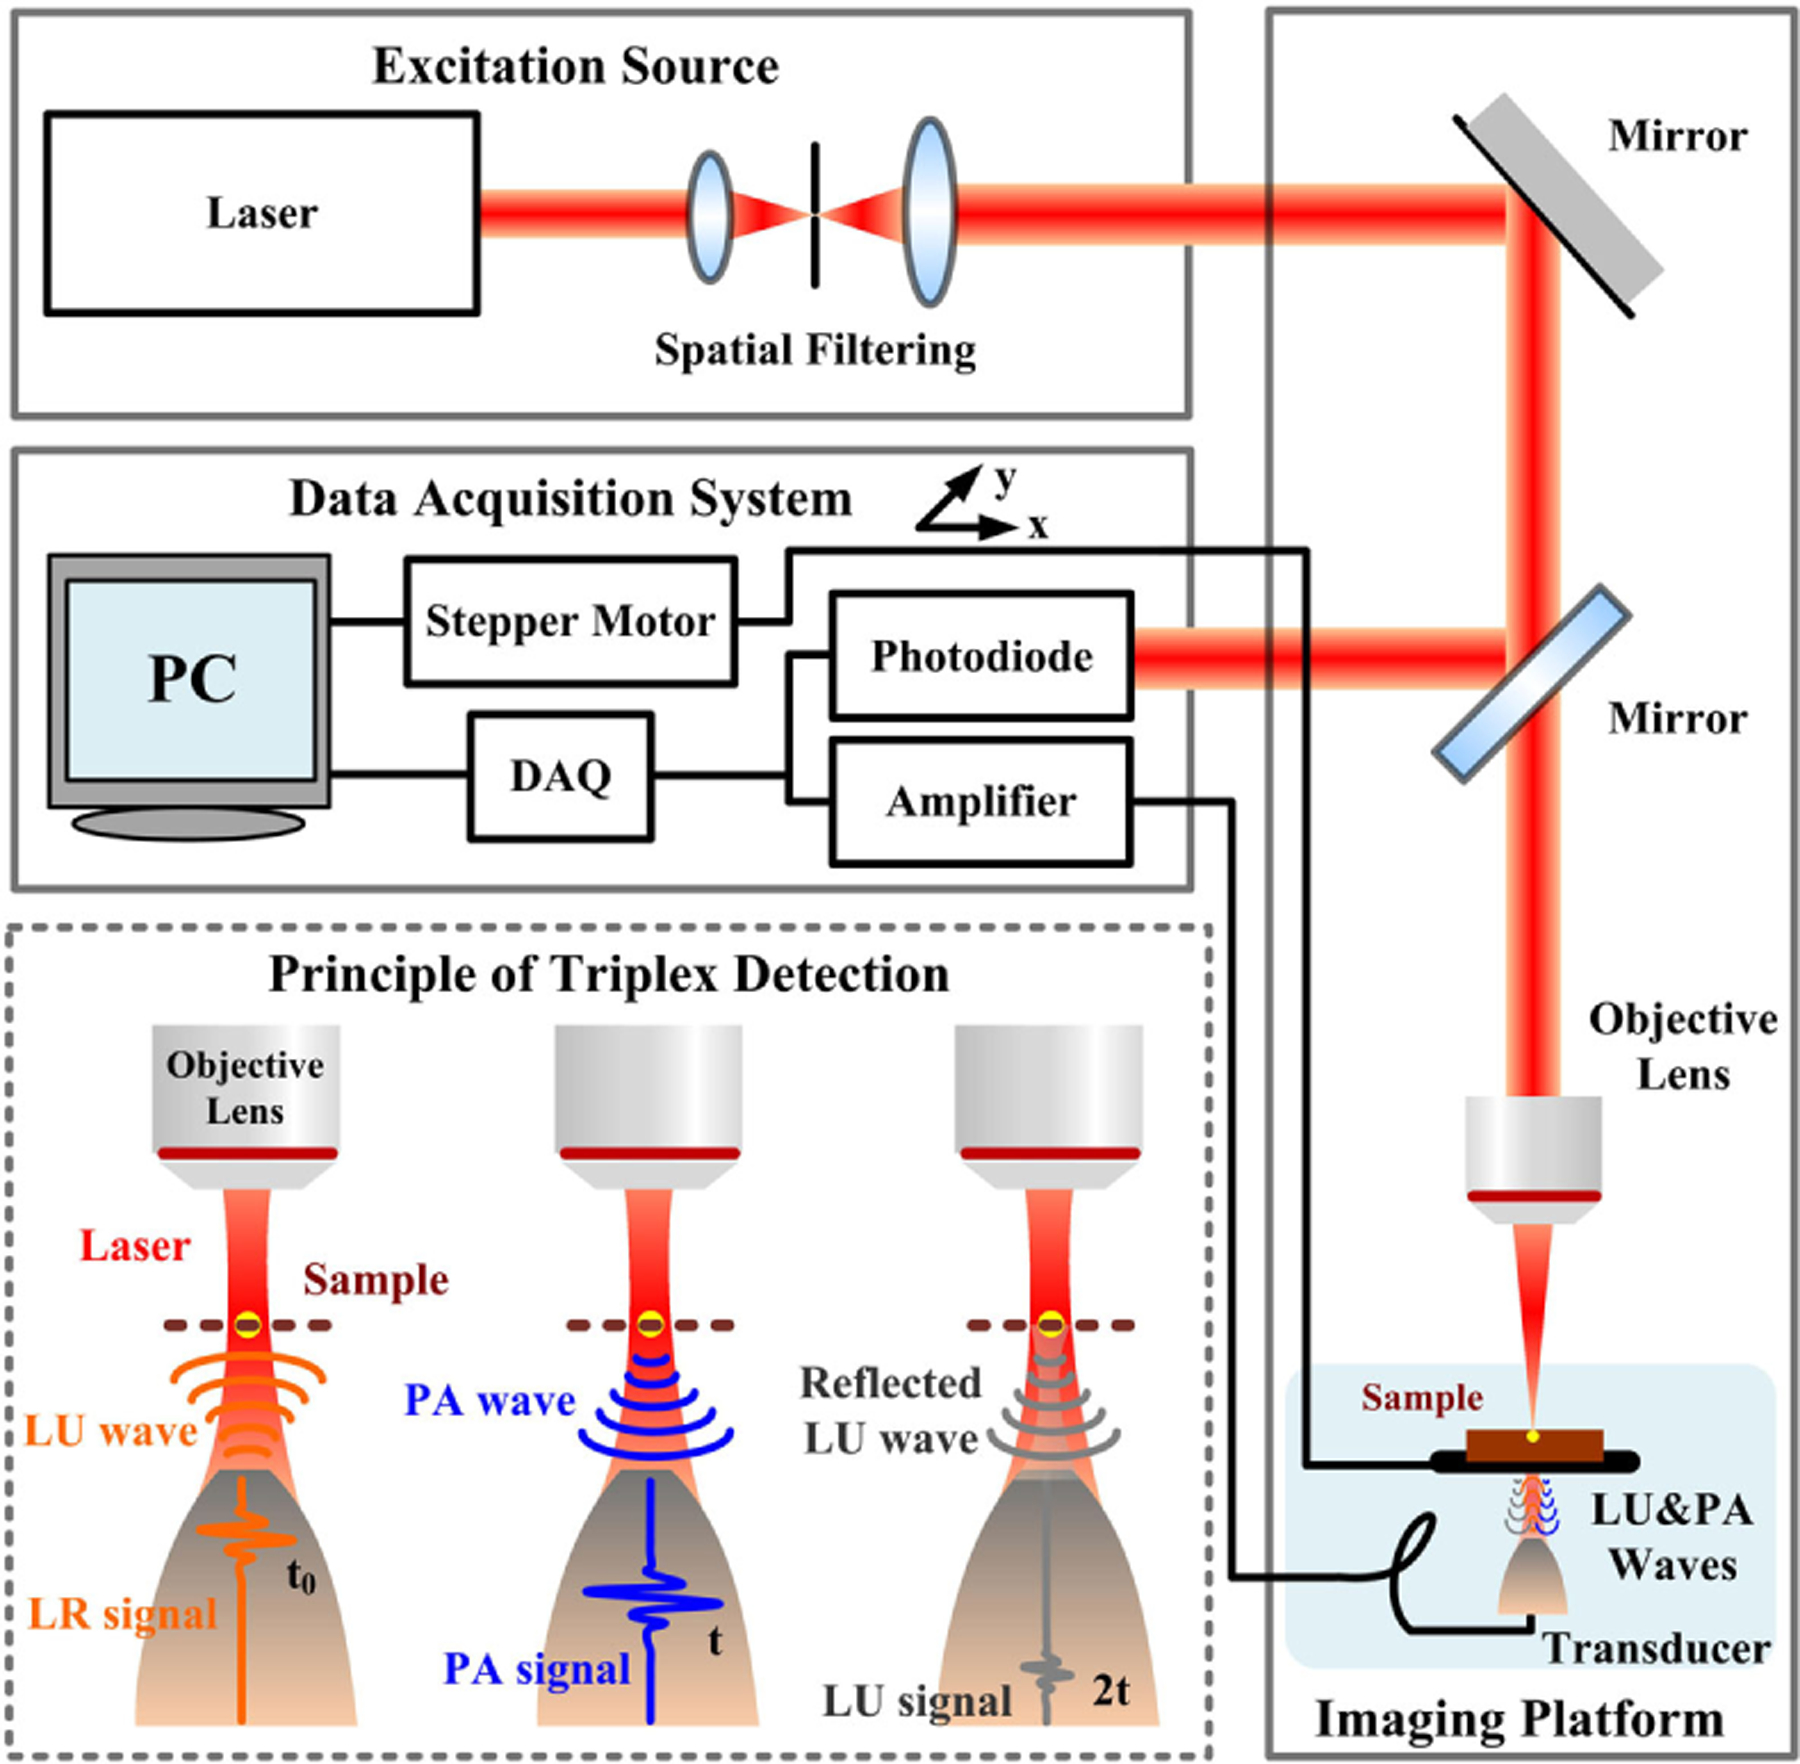
Schematic of the triplex radiometric, photoacoustic, and ultrasonic imaging technique based on single-pulse excitation.
Fig. 2.
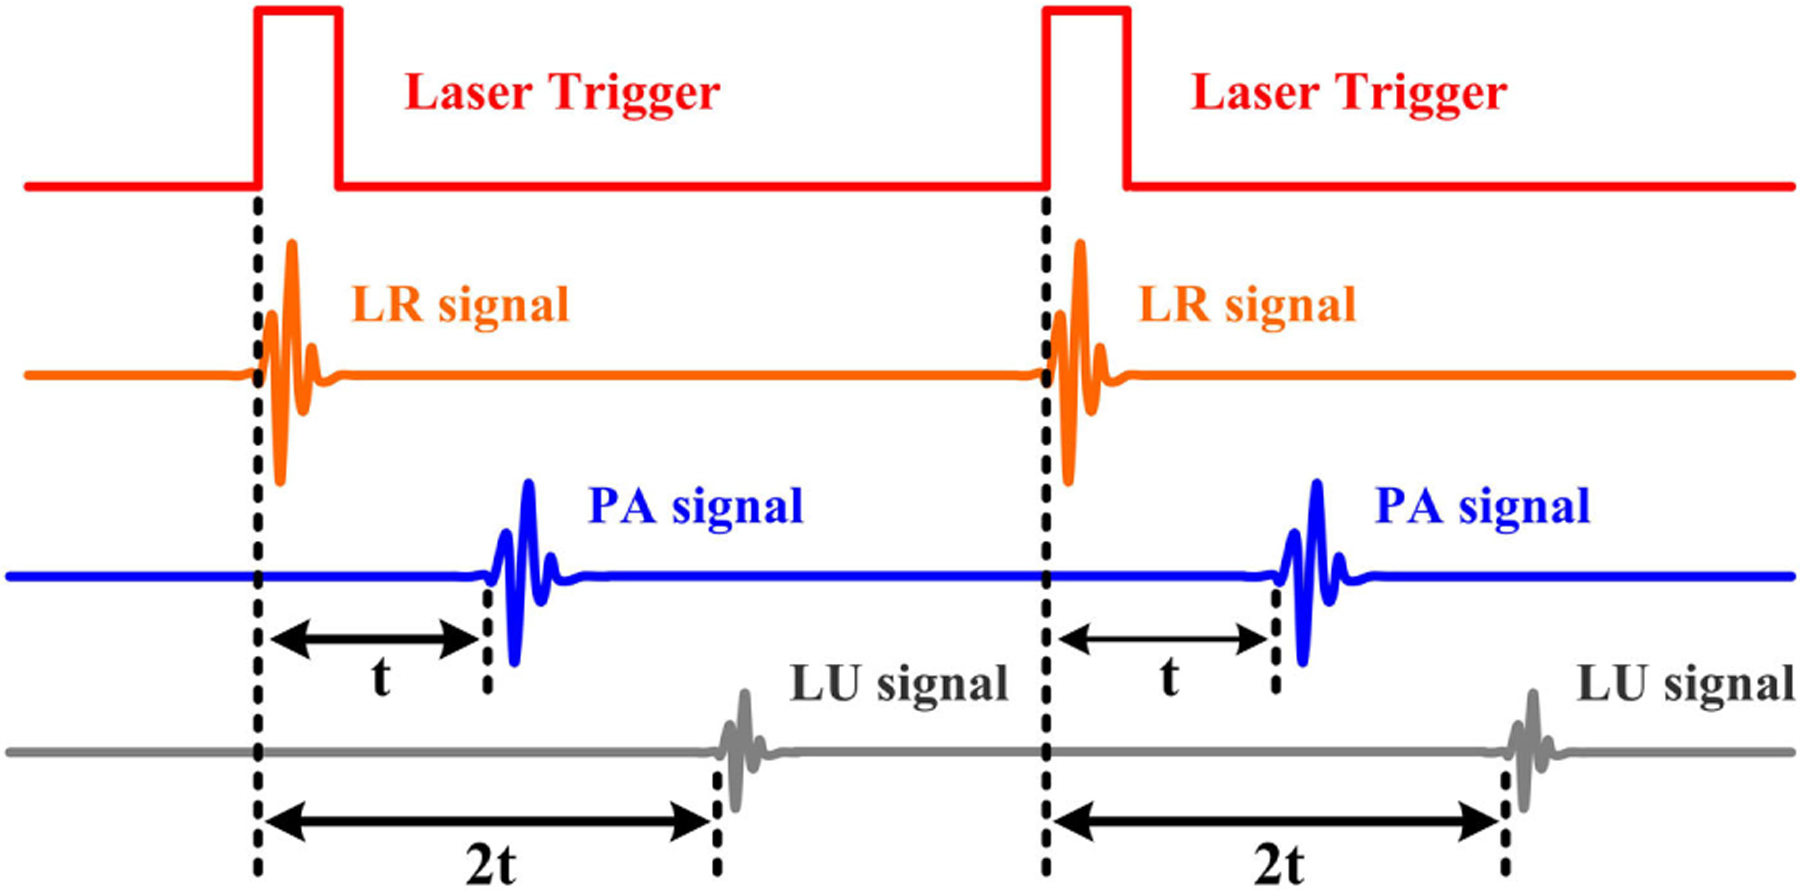
Time sequence showing the laser trigger, radiometric, photoacoustic, and ultrasonic signals.
The lateral resolution of the triplex imaging system was quantified by imaging the edge of a blade. The results are shown in Fig. 3. The radiometric image of the blade is shown in Fig. 3(a). The edge spread function (ESF) was calculated along the red dashed line. Taking the derivative of the ESF, the line spread function (LSF) can be obtained, which demonstrated that the lateral resolution of this system is roughly 100 μm as defined by the full width at half-maximum (FWHM) of the LSF in Fig. 3(b). Figure 3(c) shows the recorded PA signals of the agar and blade, respectively. Due to the low laser absorption of the agar, the signal has a big LR part and a small PA part. Additionally, we can also get the reflected LU signal from the agar with double time interval. In contrast, when the laser moved onto the blade, a bigger PA signal could be obtained simultaneously with a small LR signal and a negligible LU signal. The results indicated that this imaging system can acquire triplex contrast information simultaneously.
Fig. 3.
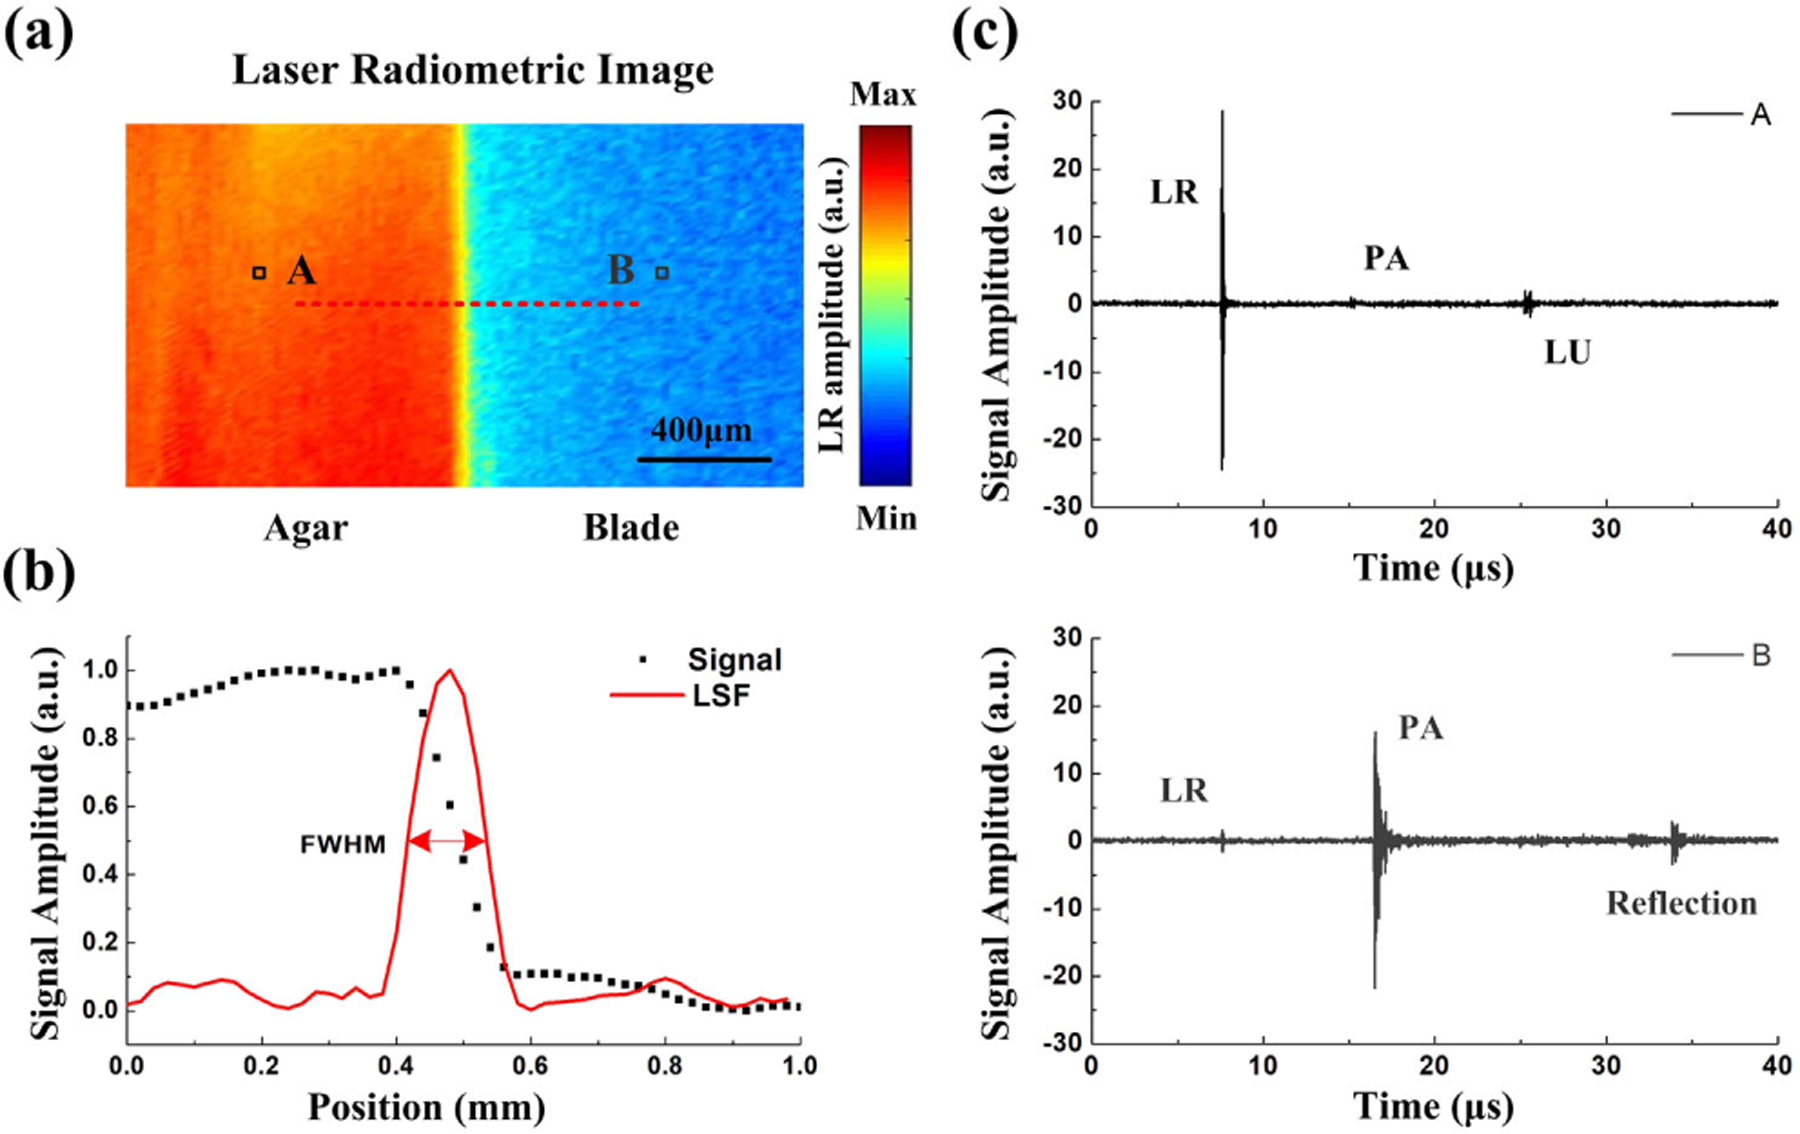
(a) Laser radiometric image of the blade edge; (b) signal amplitude distribution on the edge and the line spread function (LSF) (c) recorded PA signals of the agar and blade, respectively.
As illustrated in Fig. 4, agar–ink mixtures with different absorption and acoustic impedance coefficients were used as different models to validate the proposed method for triplex contrast measurement. In Fig. 4(a), three agar phantoms that contained 2% agar and 0.2%, 0.4%, and 0.6% ink were used. As predicted theoretically, the observed LR signal and the LU signal decreased while the PA signal increased with the increase of absorption coefficient of the mixtures. In contrast, as shown in Fig. 4(b), the amplitudes of the LR signals were almost the same, and the samples did not generate any PA signals owing to relatively weak light absorption of agar at 532 nm wavelength. However, the amplitude of the reflected LU signal is proportional to the difference in acoustic impedance that varies corresponding to the density change inside of the agar phantom [19]. The greater the difference in acoustic impedance between the adjacent agar medium, the more LU waves will be reflected. The results indicated that the triplex contrast mechanism could compensate for each other’s deficiencies.
Fig. 4.
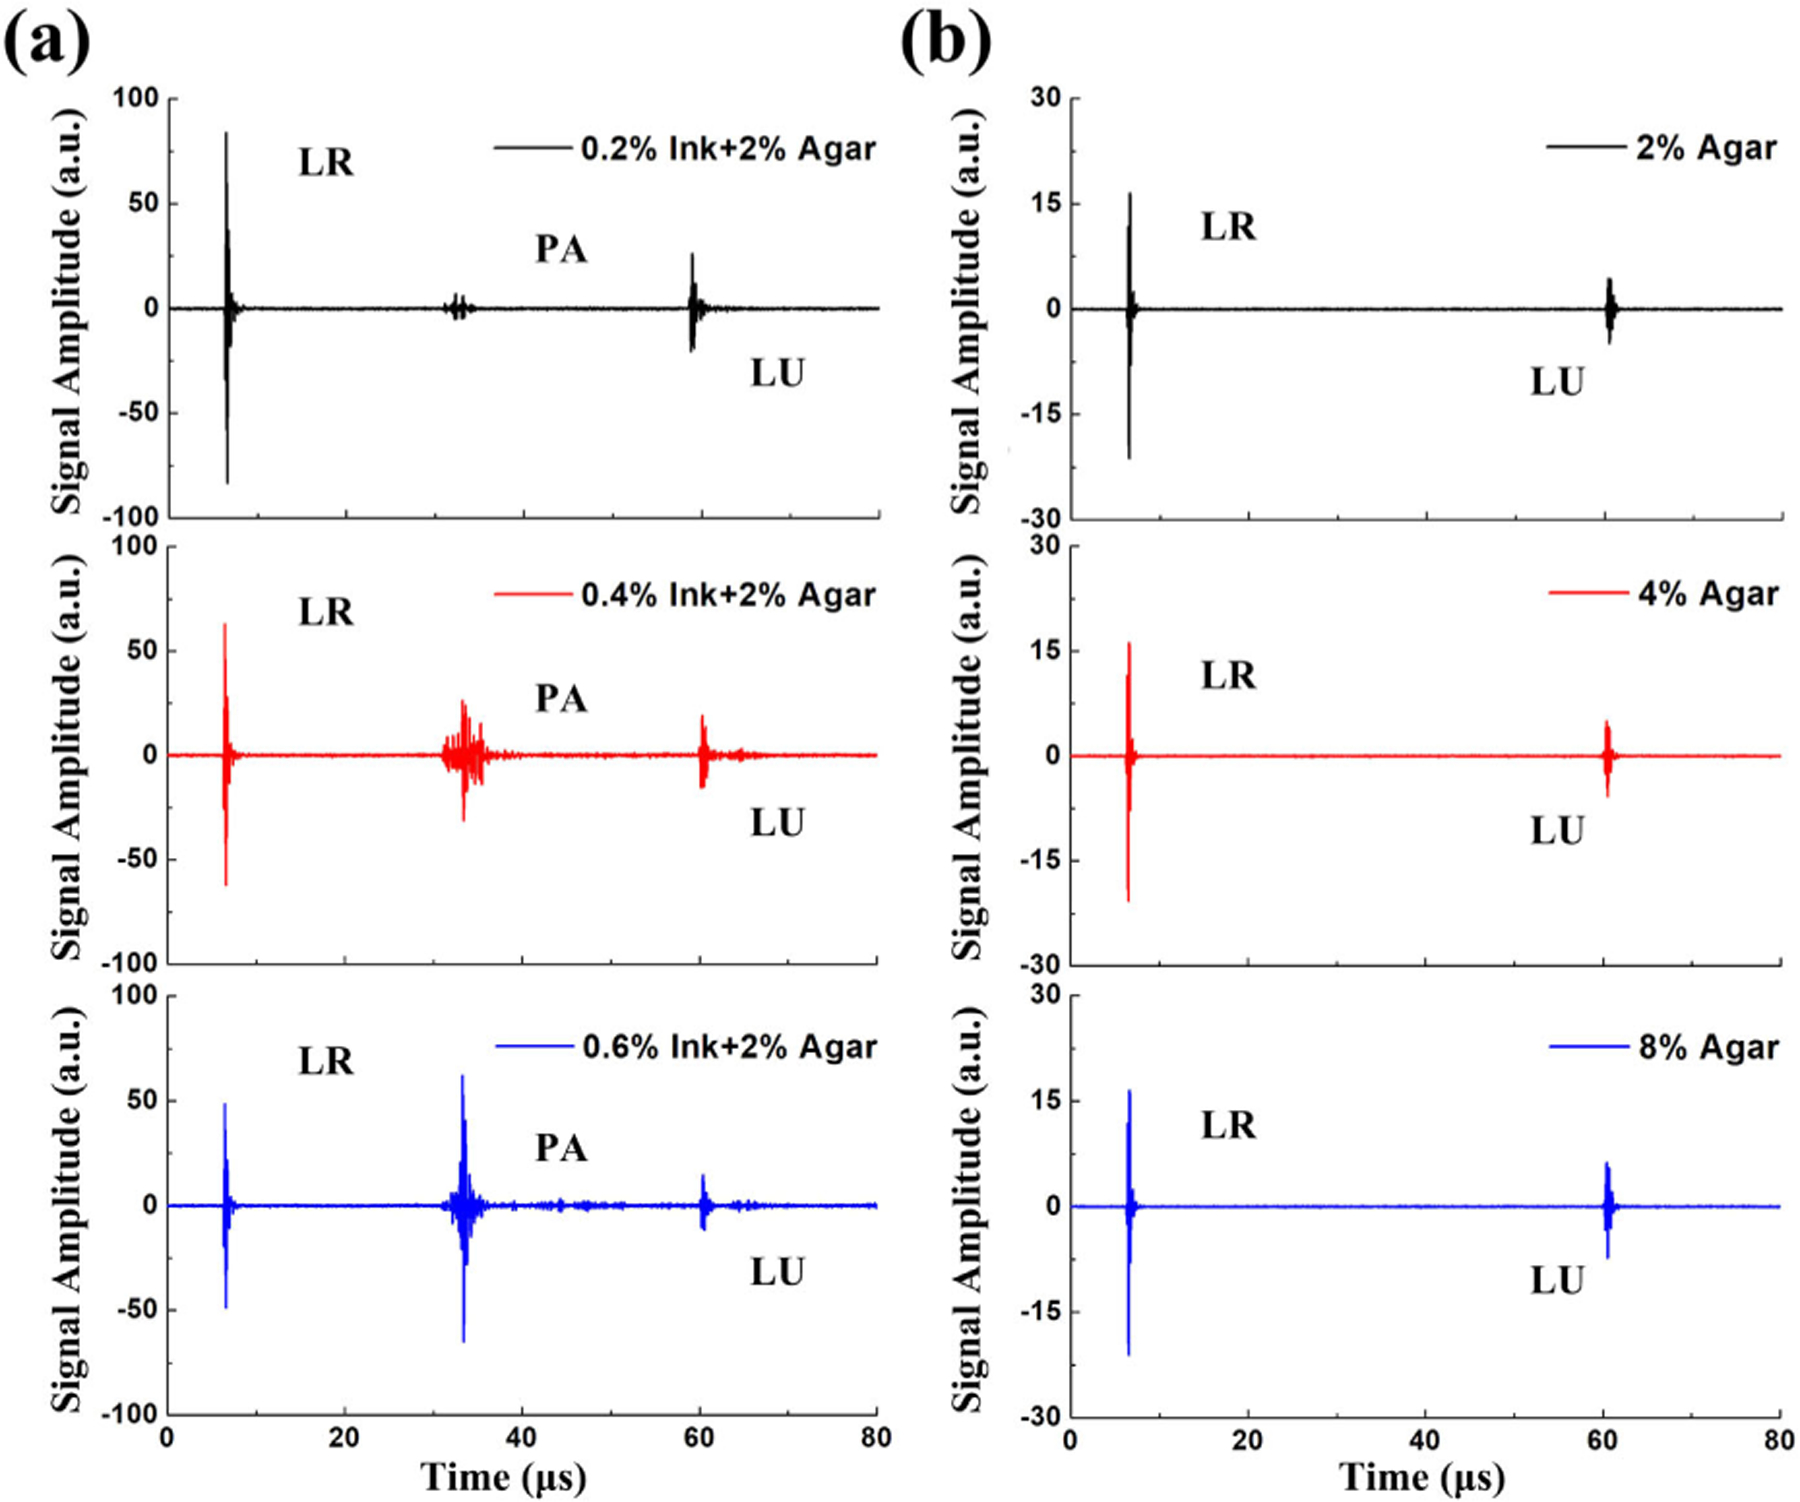
PA signals that were generated in agar–ink mixtures with (a) different ink concentrations and (b) different agar concentrations.
In Fig. 5(a), a leaf skeleton embedded in agar phantom was used to experimentally validate the proposed method. Figures 4(d) and 5(b) show two-dimensional images resulting from the simultaneous LR/PA/LU scan. Due to the high optical absorption at 532 nm, the black leaf skeleton significantly decreased the detected LR signal and yielded high PA signals in PA imaging. Thus, compared with the LR image in Fig. 5(b), the PA image showed the opposite contrast in Fig. 5(c). Meanwhile, as demonstrated in Fig. 4, the LU signal intensity is affected by the LR signal, which directly linked to the laser radiation dose on the transducer active element. In this way, the LU image in Fig. 5(d) provided excellent agreement with the LR image. Additionally, the reconstructed profiles, extracted from the triplex images along the horizontal red dashed lines [Fig. 5(a)], are plotted in Fig. 5(e). Since the intensity of the LU signal is directly affected by the LR signal, the calibrated LU image [Fig. 5(f)] can be obtained through numerically dividing the LU image by the LR image, which can provide the acoustic impedance information of the agar phantom. Correspondingly, due to the heterogeneity of the agar in the background, the LU signals will be relatively stronger in the denser areas of the agar phantom, and the black spots in the background represent the agar with lower density [20].
Fig. 5.
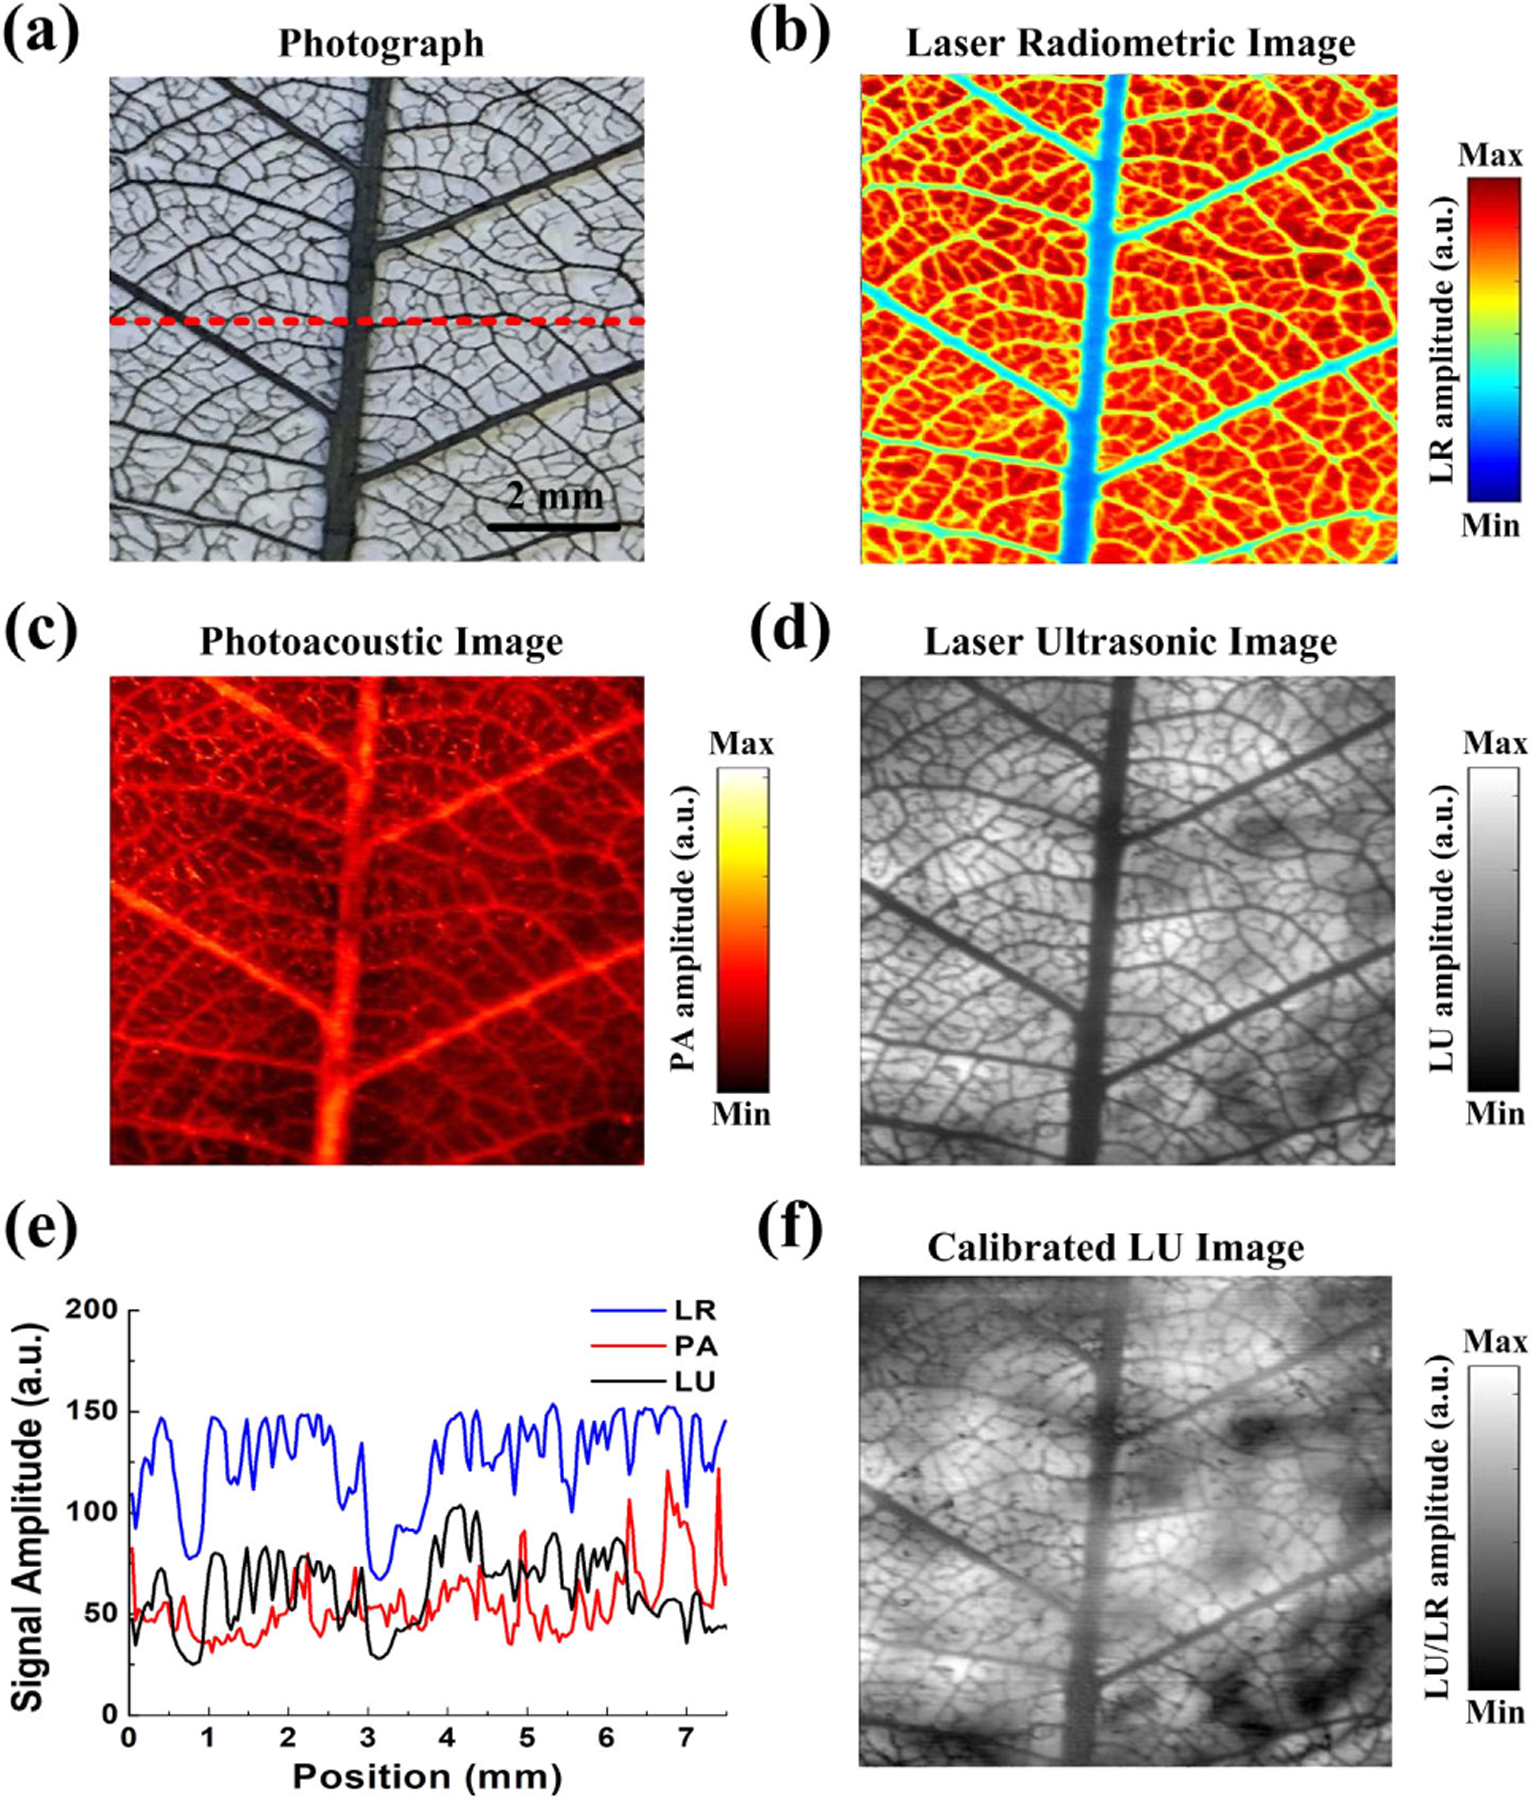
(a) Photograph, (b) laser radiometric image, (c) photoacoustic image, and (d) laser ultrasonic image of the leaf skeleton. (e) The maximum amplitude distribution of the triplex signals along the red dashed line in (a). (f) Calibrated laser ultrasonic image of the leaf skeleton.
The ex vivo experiment with a pig ear was designed to demonstrate the feasibility of the triplex imaging for biomedical applications [Fig. 6(a)]. In Fig. 6(b), the LR image could visualize the ear profile, which showed that the cartilage tissue had higher light absorption and scattering than that of the surrounding tissue. Meanwhile, the location of fat can be separated based on the sufficiently high contrast compared to the cartilage as shown in the PA image in Fig. 6(c). Due to the different acoustic impedance, the contrast of the cartilage was much higher in Fig. 6(d), which indicated that the stiffness of the cartilage was much higher than that of the surrounding tissue. Figure 6(e) shows the reconstructed profiles extracted from the triplex images along the horizontal black dashed lines. Through calibration, we can additionally provide the acoustic impedance differences of the cartilage and the fat granule [Fig. 6(f)]. This result demonstrated that this triplex PA measurement can simultaneously provide scattering, absorption, and biomechanical information of different type of tissues, which can provide triplex-information of biological tissues for accurate medical diagnosis.
Fig. 6.
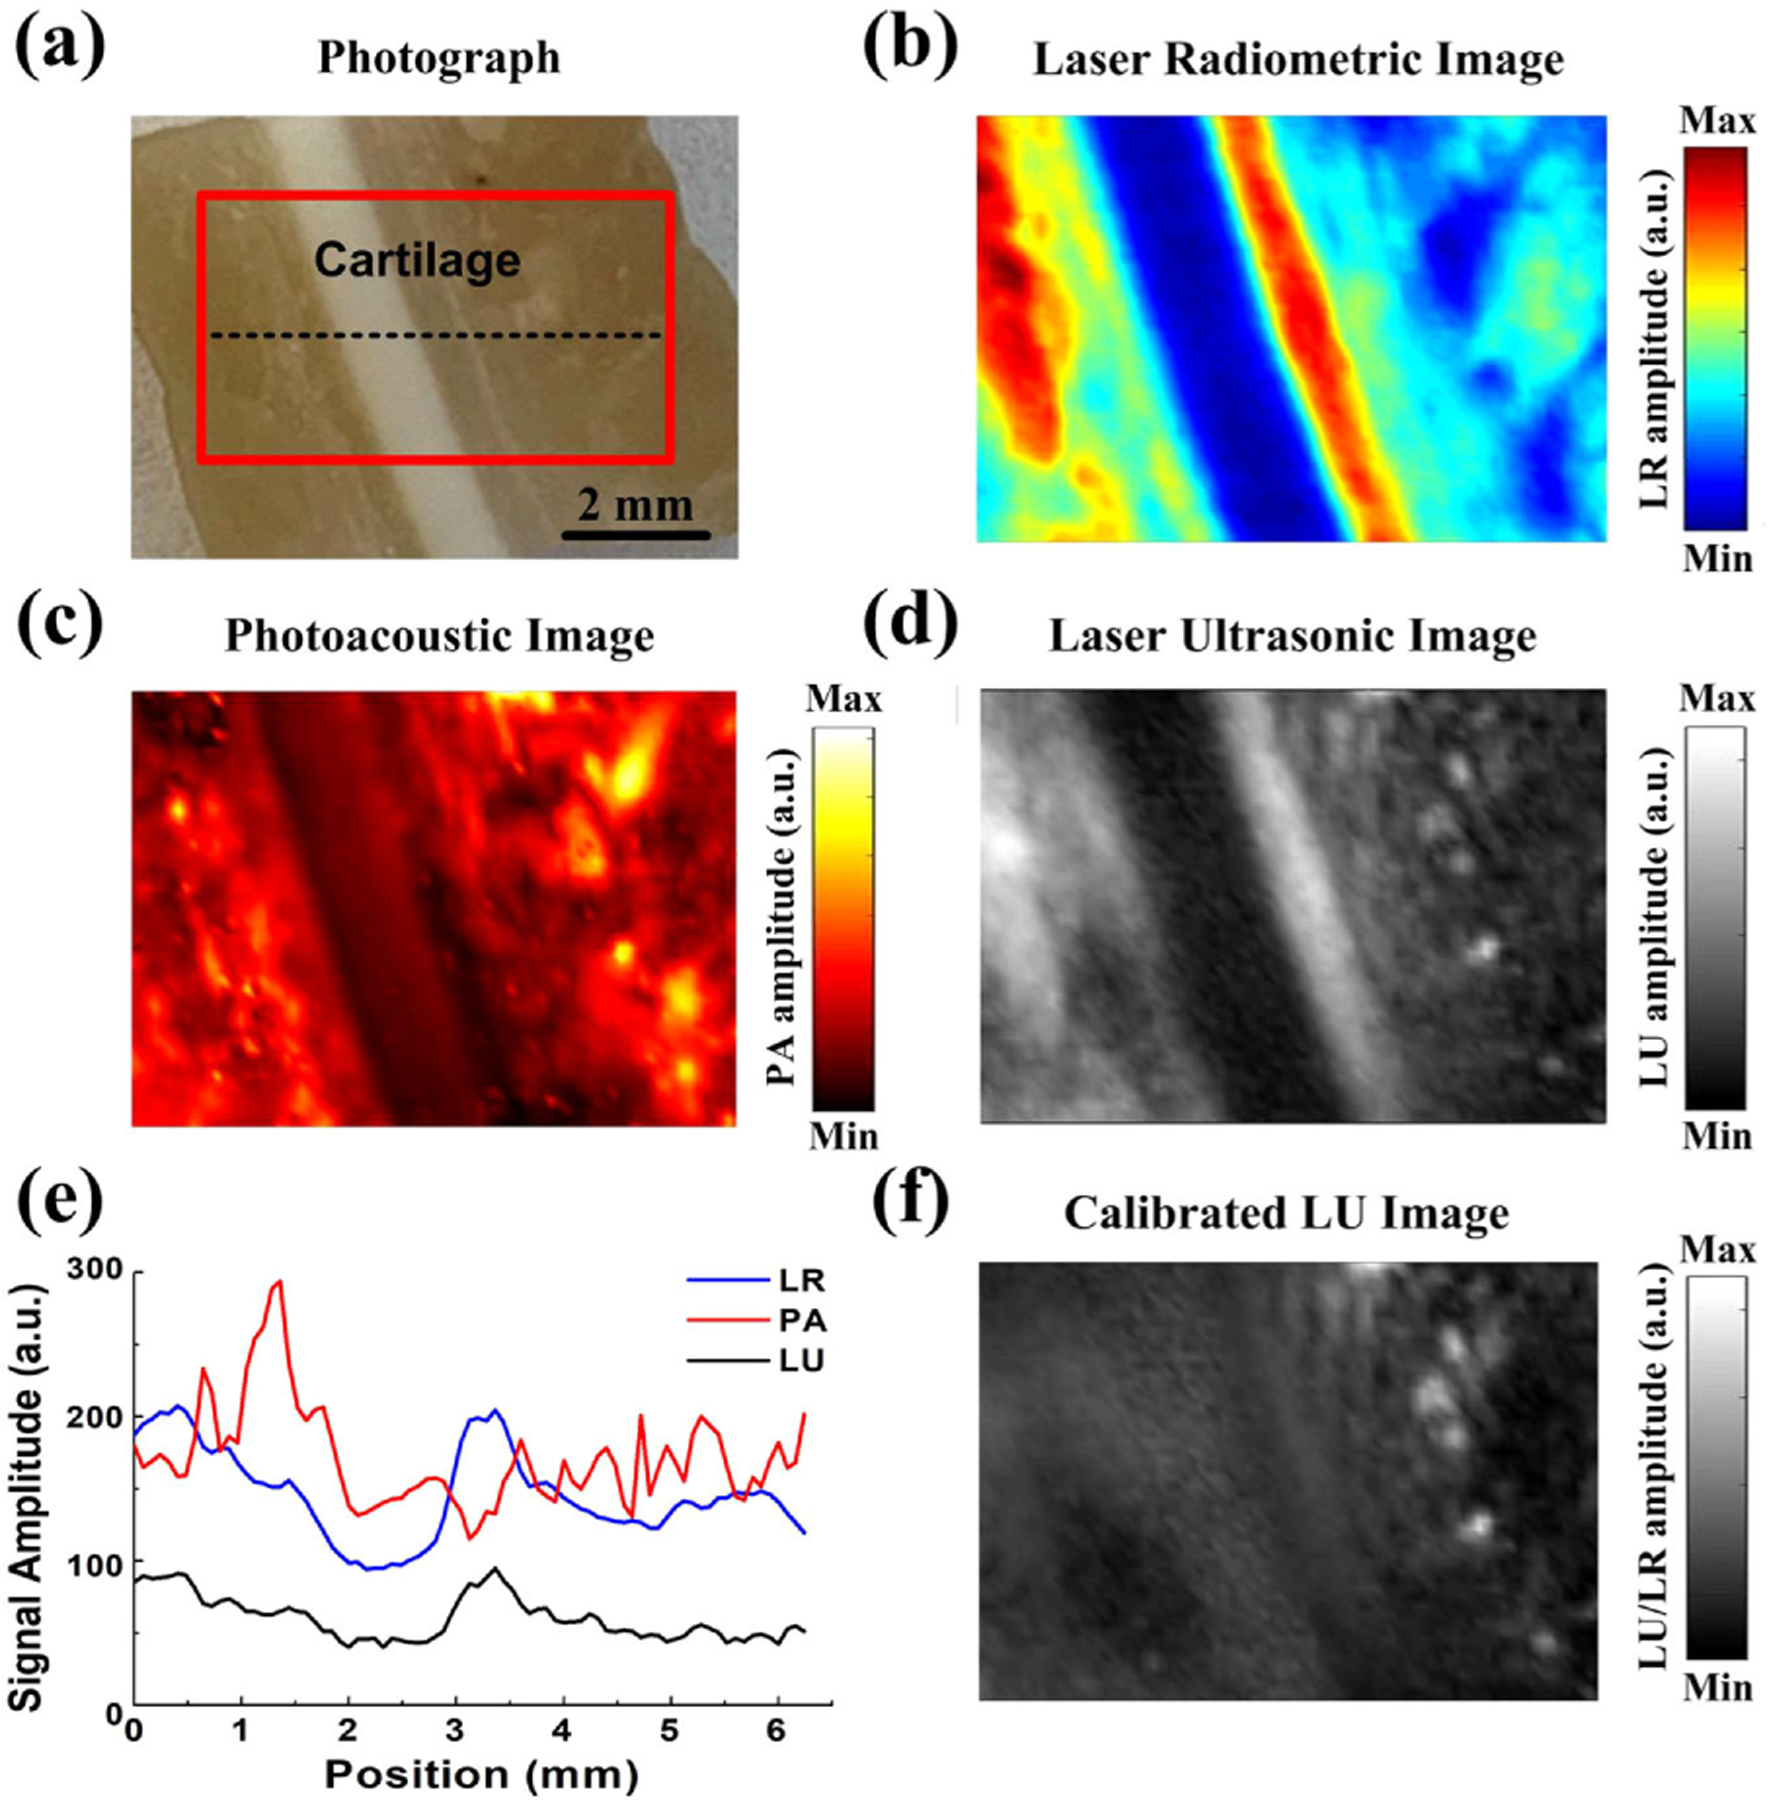
(a) Photograph of the pig ear. The red solid rectangle indicates the detection area. (b) The laser radiometric image, (c) photoacoustic image, and (d) laser ultrasonic image obtained from the pig ear in the rectangular area in (a). (e) The maximum amplitude distribution of the triplex signals in the black dashed line in (a). (f) Calibrated laser ultrasonic image of the pig ear.
In this Letter, a novel PA technique that can realize triplex-parameter detection of biological tissues with high spatial resolution was described, which provided simultaneous radiometric, PA, and ultrasonic imaging based on single-pulse excitation. However, there are still many problems that remain to be improved. In traditional PA imaging, a reflection-mode PA microscopy system is often designed and implemented to noninvasively image optical absorption contrast in vivo. In this Letter, we have used the transmission-mode PA setup to obtain the radiometric image, which relatively reflected the spatial difference in optical absorption and scattering properties of the sample. Thus, this technique can only function for imaging of thin biological samples due to the transmission-mode and the low penetration depth at 532 nm. To overcome this problem, a near-infrared nanosecond pulsed laser will be employed as the excitation source in the future to realize the triplex imaging with a large range of imaging depth.
Although this triplex-parameter detection technique was well applied to the ex vivo detection of tissue-mimicking phantom and biological tissues, a prospective study is still needed to extrapolate this method to in vivo biomedical applications or clinical situation. Near-infrared diffuse optical tomography (DOT), which is emerging as a novel biomedical imaging technique, probes absorption as well as scattering properties of biological tissues [21]. By combining DOT with our method, we may realize quantitative in vivo mapping of the optical absorption coefficients and scattering coefficients of thick tissues with additional ultrasonic information, which in turn would provide new insights into the functional and compositional imaging in biomedical applications such as tumor detection in the breast or three-dimensional imaging of bones and joints [22].
From clinical translation prospective, the proposed idea can be easily incorporated into a new imaging modality called x-ray-induced acoustic computed tomography (XACT). The XACT imaging technique was applied to detect the acoustic waves generated in the object following x ray photon irradiation. These acoustic waves can be then used to reconstruct an image that contains information of the x ray dose distribution within the object [23–25]. By employing a pulsed x-ray source and a two-dimensional planar array ultrasonic transducer, we can easily realize this triplex imaging method to obtain the integrated x ray, XACT, and ultrasound images. In this way, x ray attenuation, absorption, and acoustic impedance contrast reconstructions can be achieved simultaneously, which has great potentials in clinical transformation for diagnosis and treatment of tumor or bone-related diseases. Another potential clinical application of this technique is label-free trimodal histological imaging of tissue slices. In clinical medicine, the tissue specimens are usually processed into histological sections with staining and then used in the microscopic examination to study the manifestations of disease. However, without requiring thin slicing and staining, the proposed approach can provide label-free triplex radiometric, PA, and ultrasonic histology images of the tissue slices with high resolution and high contrast, which will benefit the rapid diagnosis of fresh pathological specimens [26].
In summary, we have developed a novel integrated trimodal radiometric, PA, and ultrasonic detection technique for triplex imaging of biological tissues based on single-pulse excitation. The phantom experiments demonstrated that this trimodality imaging system has the capacity for imaging the optical attenuation, optical absorption, and acoustic impedance differences with high resolution and high contrast. Furthermore, ex vivo experiment on pig ear tissues was performed to show the capability of this triplex imaging method to visualize and characterize different types of tissues such as cartilage, fat, and other surrounding tissues. It is trusted that this triplex imaging technique would provide morphological, functional, and mechanical properties of biological tissues simultaneously with complementary contrast mechanisms, which have great potential in noninvasive diagnosis and assessment of the pathological progression.
Funding.
National Natural Science Foundation of China (61525503, 61620106016, 61722508, 61835009, 61935012, 61961136005, 61905158); Postdoctoral Science Foundation of China (2018M633103); Department of Education of Guangdong Province (2016KCXTD007); Natural Science Foundation of Guangdong Province (2014A030312008); Shenzhen Science and Technology Funding (JCYJ201803051); National Institute of Health (1R37CA240806); American Cancer Society (133697-RSG-19-110-01-CCE); the Oklahoma Center for the Advancement of Science and Technology (HR19-131); Stephenson Cancer Center bridge fund; IBEST-OUHSC fund; Research Council of the University of Oklahoma Norman Campus.
Footnotes
Disclosures.
The authors declare no conflicts of interest.
REFERENCES
- 1.Wang LV and Hu S, Science 335, 1458 (2012). [DOI] [PMC free article] [PubMed] [Google Scholar]
- 2.Ntziachristos V, Nat. Methods 7, 603 (2010). [DOI] [PubMed] [Google Scholar]
- 3.Beard P, Interface Focus 1, 602 (2011). [DOI] [PMC free article] [PubMed] [Google Scholar]
- 4.Zhao Y, Yang S, Chen C, and Xing D, Opt. Lett 39, 2565 (2014). [DOI] [PubMed] [Google Scholar]
- 5.Deán-Ben XL, Gottschalk S, Larney BM, Shoham S, and Razansky D, Chem. Soc. Rev 46, 2158 (2017). [DOI] [PMC free article] [PubMed] [Google Scholar]
- 6.Fang H, Maslov K, and Wang LV, Appl. Phys. Lett 91, 264103 (2007). [Google Scholar]
- 7.Sethuraman S, Amirian JH, Litovsky SH, Smalling RW, and Emelianov SY, Opt. Express 16, 3362 (2008). [DOI] [PubMed] [Google Scholar]
- 8.Kruger RA, Lam RB, Reinecke DR, DelRio SP, and Doyle RP, Med. Phys 37, 6096 (2010). [DOI] [PMC free article] [PubMed] [Google Scholar]
- 9.Wang LV and Yao J, Nat. Methods 13, 627 (2016). [DOI] [PMC free article] [PubMed] [Google Scholar]
- 10.Zhao Y, Chen C, Liu H, Yang S, and Xing D, Appl. Phys. Lett 109, 203702 (2016). [Google Scholar]
- 11.Jin T, Guo H, Jiang H, Ke B, and Xi L, Opt. Lett 42, 4434 (2017). [DOI] [PubMed] [Google Scholar]
- 12.Chen Q, Guo H, Jin T, Qi W, Xie H, and Xi L, Opt. Lett 43, 1615 (2018). [DOI] [PubMed] [Google Scholar]
- 13.Chen Z, Yang S, and Xing D, Opt. Lett 41, 1636 (2016). [DOI] [PubMed] [Google Scholar]
- 14.Liu T, Wei Q, Wang J, Jiao S, and Zhang HF, Biomed. Opt. Express 2, 1359 (2011). [DOI] [PMC free article] [PubMed] [Google Scholar]
- 15.Zhao Y, Yang S, Wang Y, Yuan Z, Qu J, and Liu L, Appl. Phys. Lett 113, 143703 (2018). [Google Scholar]
- 16.Moore MJ, Strohm EM, and Kolios MC, Opt. Express 26, 22315 (2018). [DOI] [PubMed] [Google Scholar]
- 17.Ermilov SA, Su R, Conjusteau A, Anis F, Nadvoretskiy V, Anastasio MA, and Oraevsky AA, Ultrason. Im 38, 77 (2016). [DOI] [PubMed] [Google Scholar]
- 18.Ding W, Ji Z, and Xing D, Appl. Phys. Lett 110, 183701 (2017). [Google Scholar]
- 19.Sites BD, Brull R, Chan VW, Spence BC, Gallagher J, Beach ML, Sites VR, and Hartman GS, Reg. Anesth. Pain Med 32, 412 (2007). [DOI] [PubMed] [Google Scholar]
- 20.Abu-Zidan FM, Hefny AF, and Corr P, J. Emerg. Trauma Shock 4, 501 (2011). [DOI] [PMC free article] [PubMed] [Google Scholar]
- 21.Xi L and Jiang H, J. Biophoton 9, 213 (2016). [DOI] [PubMed] [Google Scholar]
- 22.Bauer AQ, Nothdurft RE, Culver JP, Erpelding TN, and Wang LV, J. Biomed. Opt 16, 096016 (2011). [DOI] [PMC free article] [PubMed] [Google Scholar]
- 23.Hickling S, Lei H, Hobson M, Léger P, Wang X, and Naqa IE, Med. Phys 44, 608 (2017). [DOI] [PubMed] [Google Scholar]
- 24.Xiang L, Tang S, Ahmad M, and Xing L, Sci. Rep 6, 26118 (2016). [DOI] [PMC free article] [PubMed] [Google Scholar]
- 25.Tang S, Nguyen DH, Zarafshani A, Ramseyer C, Zheng B, Liu H, and Xiang L, Appl. Phys. Lett 110, 103504 (2017). [Google Scholar]
- 26.Shi J, Wong TT, He Y, Li L, Zhang R, Yung CS, Hwang J, Maslov K, and Wang LV, Nat. Photonics 13, 609 (2019). [DOI] [PMC free article] [PubMed] [Google Scholar]