Abstract
Purpose
Uncertainty in proton range can be reduced by proton computed tomography (CT). A novel design of proton CT using a multiple-layer ionization chamber with two strip ionization chambers on the surface is proposed to simplify the imaging acquisition and reconstruction.
Methods
Two strip ionization chambers facing the proton source were coupled into a multiple-layer ionization chamber (MLIC). The strip chambers measured locations and lateral profiles of incident proton beamlets after exiting the imaging object, while the integral of depth dose measured in the MLIC was translated into the residual energy of the beamlet. The simulation was performed at 5 levels of imaging dose to demonstrate the feasibility and performance expectations of our design. The energy of the proton beamlet was set to 150 ± 0.6 MeV. A collimator with a round slit of 1cm in diameter was placed in the central beam axis upstream from steering magnets. Proton stopping power ratio (SPR) was reconstructed through inverse radon transform on sinograms generated with proton beamlets scanning through an imaging phantom from a half-circle gantry rotation. The imaging phantom was 10 cm in diameter. The base was made of water-equivalent material holding 13 tissue-equivalent inserts constructed according to ICRP 1975.1 All inserts were 1cm in diameter with materials ranging from lung to cortical bone. Percentage discrepancies were reported by comparing to the ground truths. The imaging dose and quality were also evaluated.
Results
The maximum deviation in reconstructed proton SPR from the ground truths was reported to be 1.02% in one of the 13 inserts when the number of protons per beamlet passing through the slit dropped to 103. Imaging dose was correlated linearly to incident protons and was determined to be 0.54 cGy if 5×10² protons per beamlet were used. Imaging quality was acceptable for planning purpose and held consistently through all levels of imaging dose. Spatial resolution was measured as 5 line pairs per cm consistently in all simulations varying in imaging dose.
Conclusion
Proton CT using a multiple-layer ionization chamber with two strip ionization chambers on the surface simplifies data acquisition while achieving excellent accuracy in proton SPR and acceptable spatial resolution. The imaging dose is lower compared to kV CBCT, making it potentially a great tool for localization and plan adaption in proton therapy.
Keywords: Range Uncertainty, Proton Computed Tomography (PCT), Monte Carlo Simulation
Introduction
Charged particles deposit energy along the track mainly by interacting with orbital electrons. The transport of protons in media can be characterized by the Bethe-Bloch equation, which describes a unique pristine peak at the end of proton range with drastically increased cross-section for interaction with orbital electrons as protons slow down. This characteristic pristine peak, also named Bragg peak in literature, facilitates radiation therapy by delivering a high dose within the tumor region while sparing surrounding normal tissues, and thus achieving higher dose conformity than conventional photons or electrons. However, large uncertainties in the prediction of proton range can cause a compromise in tumor coverage or excessive toxicity to organs at risk at the distal vicinity of the Bragg peak. Therefore, the accuracy of proton range prediction plays a vital role in proton radiotherapy.
The current standard practice to determine proton range is through calibration from Hounsfield unit of an X-ray computed tomography (xCT) scan. Nevertheless, the calibration adds several additional sources of error, including calibration errors (up to 0.5% to 1.8% of the total proton beam range), xCT errors (beam hardening, reconstruction artifacts, etc), and patient positioning errors (misalignment, motions, and anatomical changes).2–6 Even the most accurate calibration method up to date (stoichiometric calibration) results in an uncertainty in stopping power ratio (SPR) of 1.6% for soft tissue, 2.4% for bone, and 5.0% for lung.7 This uncertainty in range prediction has to be accounted for with an extra margin of 3.5% of the beam range in addition to the 1–3 mm margin used in treatment planning, which limits the effectiveness and powerfulness of proton therapy.5
The uncertainty in translating photon attenuation to SPR can be reduced if SPR is measured with protons directly. Different designs of proton radiography (pRG) and proton computed tomography (pCT) have been proposed and developed in the past decades. These designs can be generally categorized into two categories: proton tracking systems and proton integrating systems. The former consists of a couple of position sensitive detector (PSD) modules to indicate the exact pathway of a single proton, and a residual energy range detector to measure its residual energy. The first implementation of proton CT was implemented by Hanson et al in 19788 and revived by Schneider et al as a QA tool for the accuracy of proton therapy range prediction.9 A new proton tracking system was developed by Pemler et al in 1999, where two pairs of PSDs (one pair before and one pair after the patient) were used to image an area of 22.0 × 3.0 cm2 with 1 MHz proton rates.10 Later on, a collaboration between Loma Linda University (LLU) and University of California Santa Cruz (UCSC), developed the first and the second generation of proton-tracking system using four PSDs (two before and two after the patient) to determine both direction and position of the incoming and outgoing proton. The proton rate was improved from 10–20 kHz to over 1 MHz, significantly reducing the acquisition time.11, 12 By incorporating proton “most likely path” in an advanced iterative reconstruction method, the error of SPR was brought down to less than 1%.13 However, this type of systems requires well-controlled release and rapid detection of protons at both the entrance and exit sides of patient, which yields complicated and bulky equipment that is difficult to use in proton treatment room.14
On the other hand, proton integrating system detects the residual energy of an undetermined number of protons, which leads to a much simpler configuration, and thus is possible to be incorporated in proton treatment machines in clinical operation currently. In 1999, Zygmanski et al developed a proton integrating pCT using a gadolinium oxysulfide scintillator screen that was coupled to a charge-coupled device (CCD).15 Other variations in detectors have been utilized to improve the performance of proton integrating system, such as single ion chamber16, diode17, 18, complementary metal oxide semi-conductor19, amorphous silicon flat panel detector.20, 21 However due to the effect of multiple Coulomb scattering (MCS), transmitting protons have a broad spectrum of residual energy or range. This effect is called range mixing. Thus, images acquired by proton integrating system suffered from edge artifacts at the interfaces between materials,15 overall low spatial resolution, and relatively large SPR error.22 In 2018, Zhang et al developed a proton integrating radiography system that measured so-called time-resolved dose rate functions (DRFs), and derived water equivalent path length (WEPL) based on intensity weighted root-mean-square (RMS) of DRFs.23 The error of SPR was claimed to be within ±1%, and the detector pixel pitch was 0.388 mm, which was promising for clinical use. However, their results were still limited by the range mixing effect, and redundant scanning at the same location.
In this study, we propose a new proton integrating system with pencil scanning proton beam that is not only practical for clinical use but also alleviates the effects of MCS one step further than previous systems. In this pCT prototype, a multiple-layer parallel ionization chamber was used to measure the residual range of proton beams at different depth simultaneously at each trigger of the proton beamlet. Additionally, two strip ionization chamber plates in front of the multiple-layer ionization chamber were used to determine the lateral displacement and profiles of proton beamlets. In this design, the complete longitudinal profile is acquired, alongside the distribution and location of exiting protons. Since the distribution is largely determined by MCS, reconstruction incorporating exiting beam profile has the ability to correct the MCS effect, and ultimately leads to higher resolution and SPR fidelity.
Methods and Materials
Spot size
Sizes of proton spots in air could vary from 3mm to 12 mm24–26. To improve imaging resolution consistently to accommodate different energies and various proton delivery platforms, a collimator was introduced in our design. The purpose of the collimator was to control proton spot size in air. The collimator, made of 10 cm-thick brass, was placed upstream to steering magnets. A round slit of 1mm in diameter was drilled in the center of the collimator, aligning with the central beam axis. The change of energy spectrum after protons going through the slit was investigated and reported.
Multi-layer ionization chamber (MLIC) array
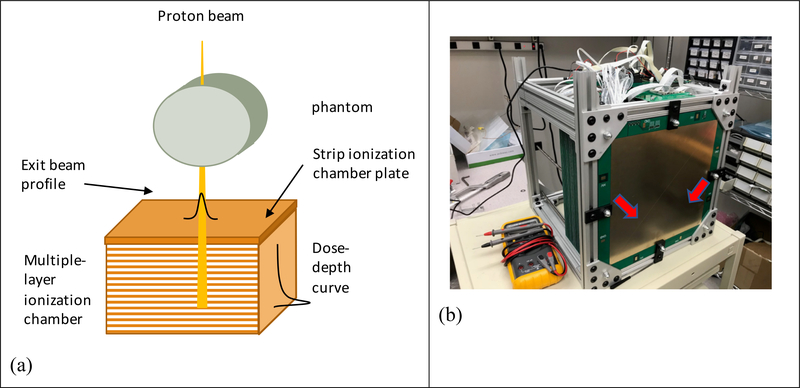
After the scanning pencil proton beam passing through the imaging object, the residual energy of the proton beam can be detected by a multiple-layer ionization chamber. The residual energies at different depths were indicated by the readings of the ionization chambers at the corresponding depths, so that the complete Bragg peak was captured. In addition, two strip ionization chamber plates perpendicular to each other were placed in front of the multiple-layer ionization chamber to determine the lateral displacement (perpendicular to the beam direction) of the proton beam. A diagram of the detector design currently under development in our facility and a photo of the detector prototype were shown in Figure 1.
Figure 1.
(a) The detector design. The profile of the exiting beam was detected by the strip ionization chambers, while the residual energies at different depths were measured by the multiple-layer ionization chamber; (b) Photo of the prototype detector. Each lionization chamber plates were divided into four segments in order to reduce capacitance. The separation lines were indicated by the red arrows.
The prototype MLIC was made of 64 layers of 1.0 mm FR-4 printed circuit boards. The effective measurement area was 25.6 × 25.6 cm2. In order to reduce the detector capacitance, each range detection layer was further divided into four segments. The bias voltage was provided by a 300 V power supply. The ionization currents were sampled and measured by a total of 256 channels analog-to-digital converters at a frequency as high as 2 kHz. The data were read out by field-programming gate array (FPGA) and transferred to computer memory. The A/D converter (DDC 264, Texas Instrument) used in the prototype detector was selected to be sensitive and robust to weak signals with low capacitor and noise level. The detector also comprised two x-y strip boards that were positioned in front of depth layers. Each strip board had 128 strip channels in 2 mm width. Figure 1 showed the diagram and the actual prototype of the detector.
Design of the simulation study
The simulation was run with TOPAS Toolkit,27 an extension of Monte Carlo simulation package Geant4, which has been used and verified for proton therapy at Massachusetts General Hospital for over 10 years.28, 29 TOPAS 3.1, which was the version used in our simulation, shared the same physics models, processes and interaction cross-section with Geant4 10.03.
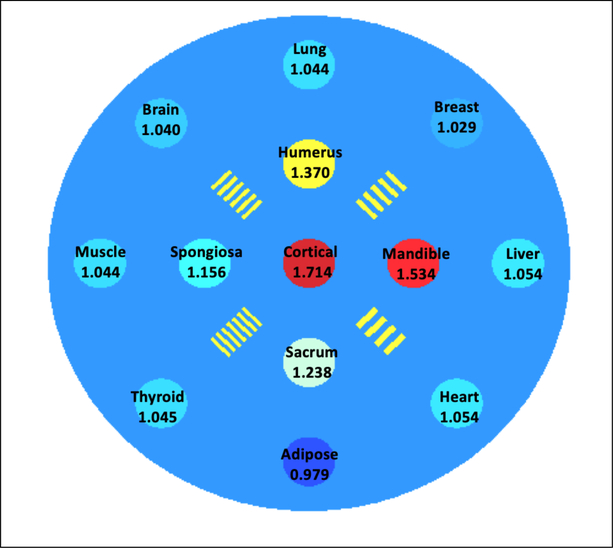
A cylindrical water phantom of 10 cm in diameter and 20 cm in length was created as the imaging object. The phantom contained 13 inserts of 1 cm in diameter and arranged in three concentric circles largely grouped based on the insert’s tissue type. Group 1 contained only one insert made of cortical bone located at the center of the phantom. Group 2 contained the rest of the bony inserts, including mandible, sacrum, humerus and spongiosa, distributed equally on a circle with a radius of 2 cm from the center of the phantom. Group 3 contained all the soft tissue inserts, including liver, heart, adipose, thyroid, muscle, brain, lung and breast, placed equally on a circle with a radius of 4cm from the center of the phantom. The locations of the 13 inserts were illustrated in Figure 2. The materials and reference SPR values were listed on corresponding inserts as well. Four sets of resolution bars with spatial frequency ranging from 4 line pairs per cm (lp/cm) to 7 lp/cm were also added between inserts in the second group.
Figure 2.
Distribution of all 13 inserts and four resolution bars in the phantom used in the simulation for this study. Materials and corresponding reference SPR values were annotated accordingly.
Mono-energetic protons with kinetic energy of 150 ± 0.6 MeV were employed for each scanning beamlet in this simulation. Phase space file was generated for protons passing through the slit. The range cutoff in our simulation was set to 0.05 mm, which was also default in TOPAS 3.1. This cutoff was deemed sufficient as it posed negligible uncertainty in the determination of proton range in this study. Multiple layers of ionization chamber were constructed with 100 layers of ionization chambers, each of which contained a 2 mm air gap sandwiched by two FR-4 plates in 1 mm water-equivalent thickness. Doses were scored in the 100 air gaps.
The simulation was run with five settings on the number of particles (5×10², 103, 5×10³, 2×10⁴ and 105) for comparison of SPR fidelity, image quality and imaging dose at various dose levels. The lateral scanning range was set from −5 cm to 5 cm relative to the isocenter in 1 mm step size for full coverage of the imaging object. The gantry rotated from 0 to 180 degrees in 1 degree increments.
Reconstruction
Water equivalent thickness along each beam path was determined by the displacement of longitudinal dose profile in the detector with and without the imaging object in place. The displacement is a Radon transform of relative proton SPR following the path L at distance t from the origin, which was defined at the center of the phantom in this study, with gantry at angle θ
| (1) |
In our simulation, proton beamlets scanned through the central transverse section of the cylindrical phantom from left to right at 1 mm spatial step from gantry angle 0 to 180. Denoting the longitudinal coordinate of the central slice as z = 0, the SPR on the central slice can be recovered through
| (2) |
where the convolution kernel h is a ramp filter. As doses in the detector were collected in air gaps of 2 mm, the resolution in the depth dose curve in our simulation was 2mm. To mitigate the uncertainty in our simulation caused by coarse resolution in the detector, we took the advantage of sharp dose gradient at the distal fall-off segment on the percentage dose profile by using the location of 90% of the pristine peak as a surrogate for the peak location. It was implemented by interpolating the distal fall-off segment of the depth dose curve, where 90% of the Bragg peak was located. The dose gradient at 90% of the pristine peak on distal fall-off was estimated to be 10%/mm. Even with 5% uncertainty in the magnitude of the Bragg peak, the accuracy in the displacement of the Bragg peaks would be achieved within 0.5 mm if 90% of pristine peak at distal fall-off was used as a surrogate for the peak location.
Imaging Quality and Imaging Dose
In the reconstructed SPR images, the background region of the phantom was selected by masking out all the insert region and resolution bars. Noise was calculated as the standard deviation of the values within the background region, based on which signal to noise ratio (SNR) of each insert was calculated.
Resolution of the reconstructed image was studied by calculating the line spread function (LSF) at the edge of mandible insert, which is the insert with highest SPR located on the second concentric group with all the resolution bars. Full width at half maximum (FWHM) and modulation transform function (MTF) were calculated from the LSF.
The dose distribution map of the central slice of the phantom was generated using Monte Carlo simulation in TOPAS with 103 protons per beamlet, 101 beamlets per gantry angle, and 180 gantry angles in total. The dose map was calculated via the following equation where the image was acquired with slice thickness Δz,
| (3) |
where D(x, y, z + nΔz) denoted the scatter contribution to the total dose from slice n and M is the total number of slices. Due to the symmetry of our imaging phantom along the longitudinal direction, our simulation was only run at the central slice for the sake of computational efficiency. The map of image dose on the central slice was simplified into
| (4) |
if M ≫ 1. The dose grid was set to 1mm laterally and 2 mm longitudinally in consistency with the specifications of the prototype detector. Mean imaging dose of the central slice of the imaging phantom was calculated via the following equation
| (5) |
, where was the initial energy of a proton beamlet indexed by i and j, was the energy deposited in the detector by the same proton beamlet, mslice was the mass of the central slice, Nbeam and Nproj were the number of proton beamlets and gantry angles respectively.
Effects of scanning step size and electronic noise
To investigate the effects of scanning step size on the accuracy and quality of SPR images, 2mm scanning step size, which was twice as large as the one used in the previous simulation, were used to reconstruct SPR images with 5×10³, 103, 5×10² histories per beamlet, the deviations of reconstructed SPR from the ground truths were calculated as well.
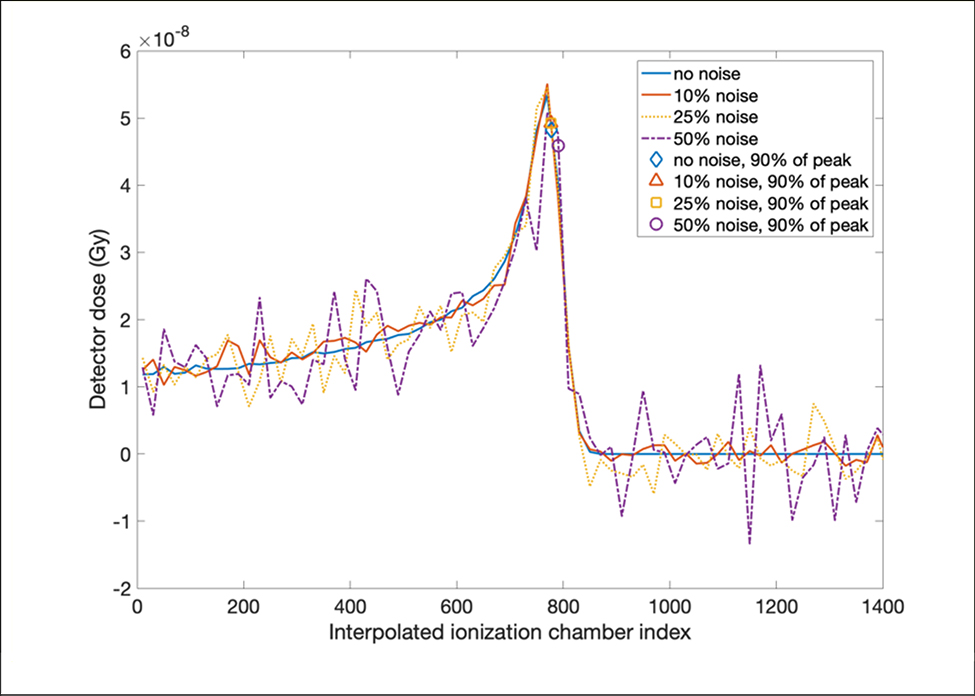
Three levels of Gaussian noise were added artificially to the simulation with 5×10³ proton histories per beamlet, in order to evaluate the effect of electronic noise. The standard deviations of the additional Gaussian noise were 10%, 25%, and 50% of the entrance signal.
Results
Energy spectrum in collimated protons
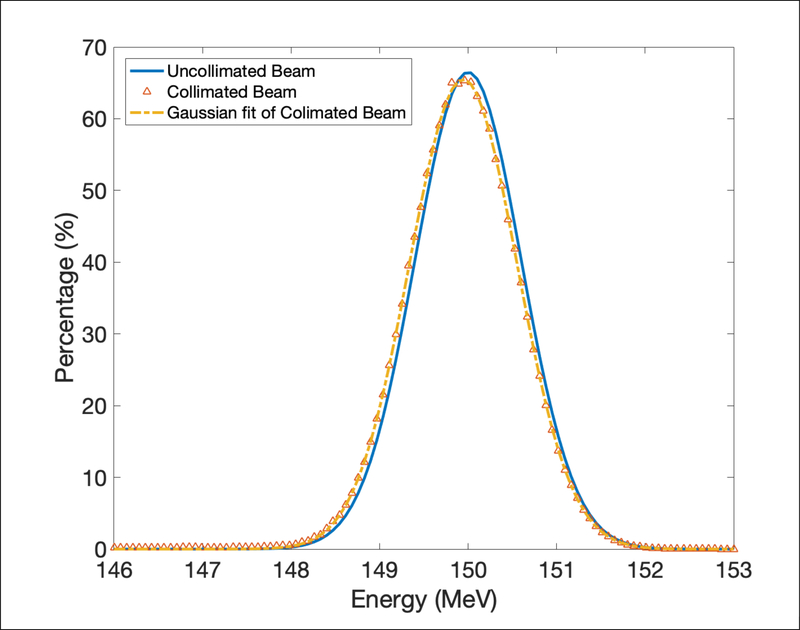
Energy spectrum of uncollimated and collimated beamlet with 106 protons passing through the collimator were plotted in Figure 3. The collimated beam was fitted by a Gaussian function to better compare with the uncollimated beam. The mean energy changed from 150 MeV ± 0.6 MeV to 149.9 MeV ± 0.86 MeV after going through the slit due to the effect of scattering. The energy spectrum was similar before and after the collimator, therefore the spatial resolution was almost the same as using proton beamlet with 1 mm diameter directly.
Figure 3.
Energy spectrum uncollimated and collimated proton beamlet with 106 protons passing through the collimator.
Reconstructed proton stopping power ratio
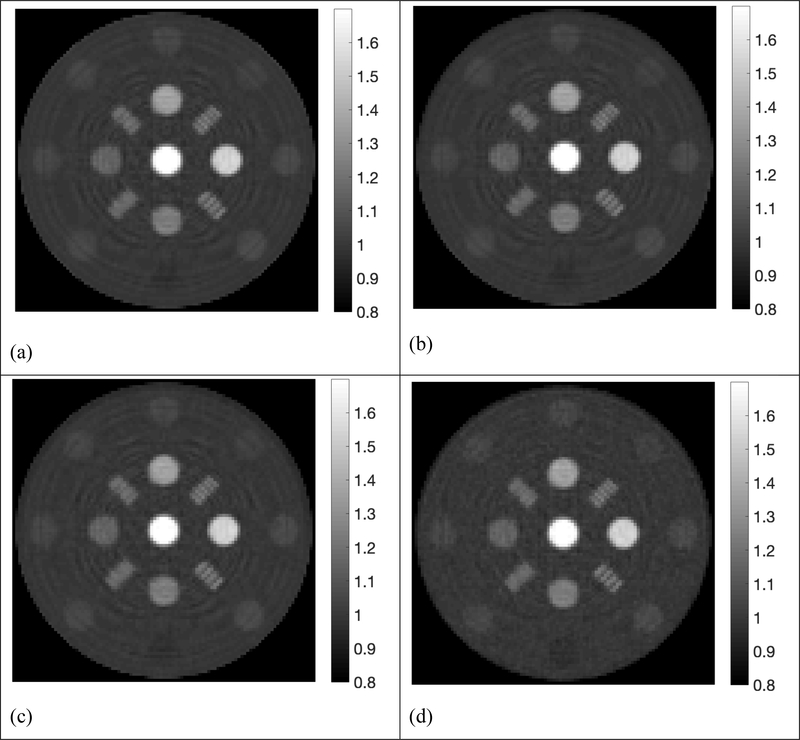
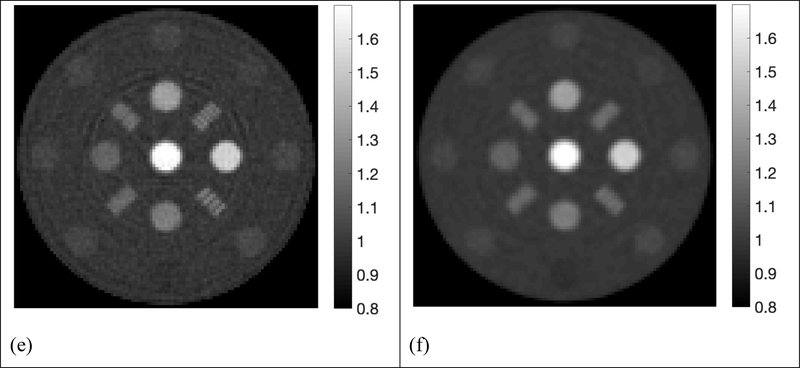
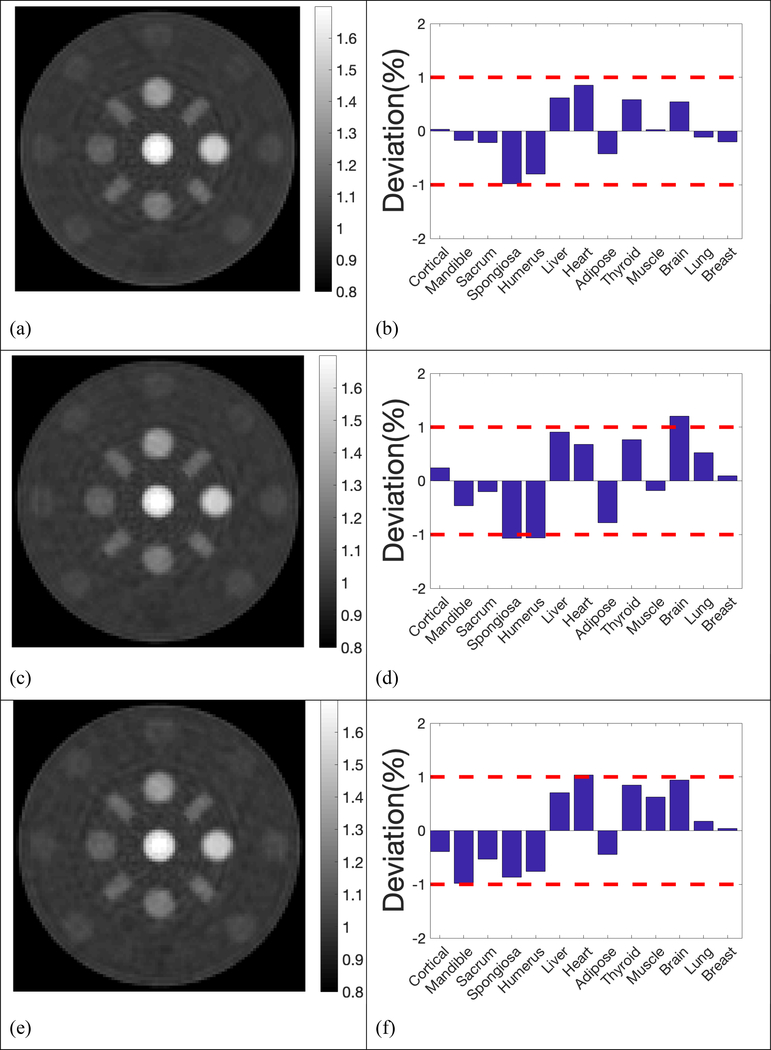
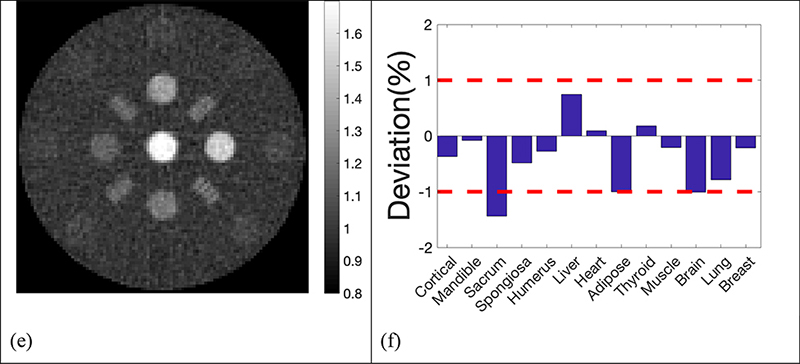
The reconstructed SPR maps using 105, 2×10⁴, 5×10³, 103, 5×10² histories per beamlet taken from the phase space file of collimated protons were displayed in Figure 4. For simplification purpose, all histories used in our simulation referred to collimated protons that passed through the collimator per beamlet. In the five sub-figures labeled from Figure 4a to Figure 4e, locations and shapes of all the 13 inserts were detected with high fidelity. The resolution bars were distinguishable up to 5 lp/cm. Ring artifacts were present in all reconstructed SPR maps due to high frequencies passing the simple ramp filter used in the reconstruction. The ring artifacts can be suppressed by applying a low-pass filter. Reconstruction of proton SPR map using a low-pass filter was shown in Figure 4(f) for data acquired with 103 histories per beamlet.
Figure 4.
Proton SPR maps with five levels of proton histories per beamlet. a) 105 histories per beamlet; b) 2×10⁴ histories per beamlet; c) 5×10³ histories per beamlet; d) 103 histories per beamlet; e) 5×10² histories per beamlet; f) 103 histories per beamlet with a low-pass filter on sinograms.
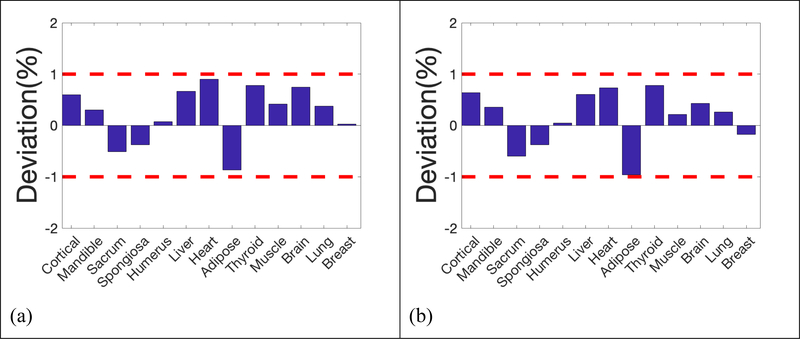
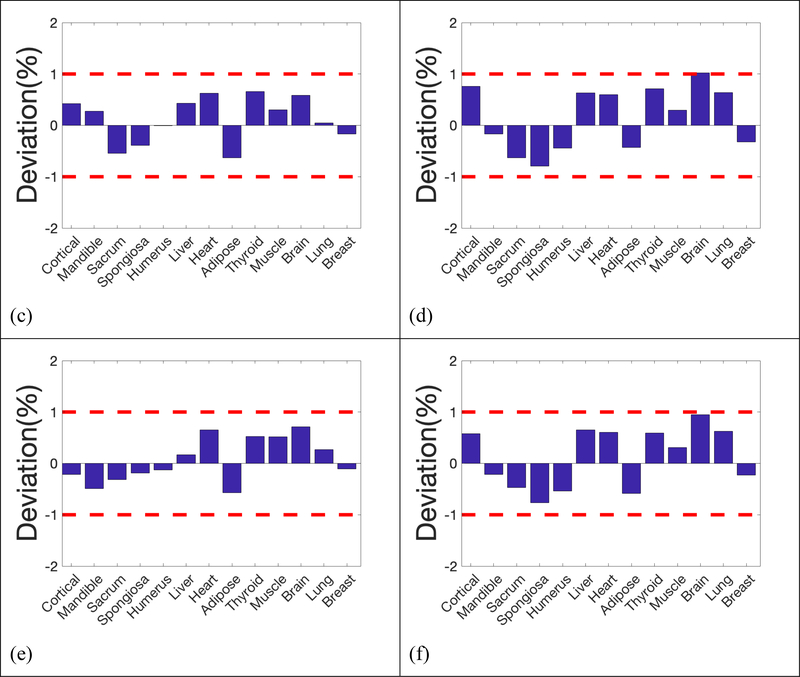
Deviation of reconstructed SPR in the 13 inserts from reference values was summarized in Figure 5, where 2 red dash lines highlighted the 1% error boundaries, which were the target uncertainty one would expect in proton CT. Deviations of all inserts were within 1% from the ground truths in simulations using 105, 2×10⁴, 5×10³, 103 and 5×10² histories per beamlet, only except for brain equivalent insert when using 103 histories per beamlet, of which the deviation was 1.02%. The deviation of inserts followed a similar pattern until histories per beamlet decreased to 103 protons. After applying a low pass filter to the reconstruction with 103 histories per beamlet, the deviation of brain tissue dropped to 0.95%, which brought the deviation of all inserts into the 1% error range. Figure 4(f) and 5(f) showed that accuracy in proton SPR improved by sacrificing imaging resolution after applying a low pass filter.
Figure 5.
Deviation of reconstructed SPR in the 13 inserts compared to reference values. a) 105 histories per beamlet; b) 2×10⁴ histories per beamlet; c) 5×10³ histories per beamlet; d) 103 histories per beamlet; e) 5×10² histories per beamlet; f) 103 histories per beamlet with a low-pass filter on sinograms.
Imaging resolution
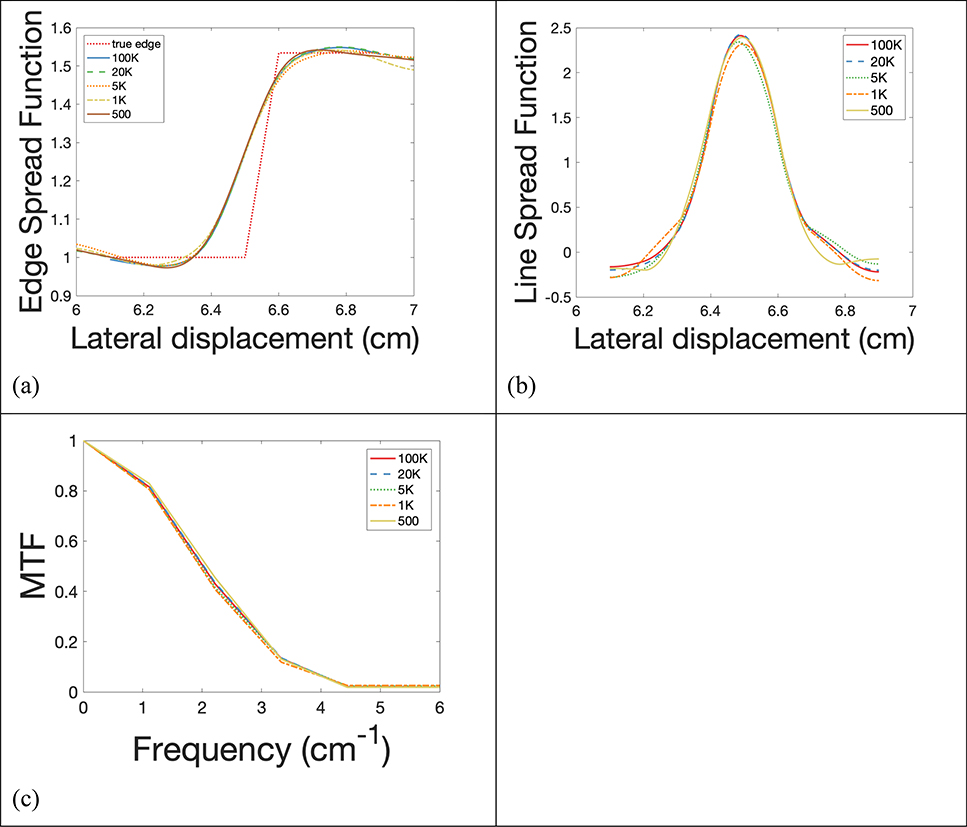
Edge spread functions of the imaging system were fitted and plotted in Figure 6(a) at the edge of the mandible insert on the reconstructed proton SPR map at 5 levels of proton histories per beamlet. The corresponding line spread functions (LSF) were displayed in Figure 6(b), from which full widths at half maximum (FWHM) were measured and summarized in Table 1. Furthermore, modulation transform functions (MTF) were calculated form the LSF and displayed in Figure 6(c). Frequencies where MTF dropped to 10% of maximum were listed in Table 1 as well.
Figure 6.
(a) Edge spread function, (b) line spread function, and (c) modulation transform function (MTF) of insert mandible with 5 different proton numbers.
Table 1.
Mean deviation, noise, FWHM, and MTF dropped to 10% of maximum for 5 simulations with different levels of histories per beamlet.
| Mean deviation (%) | FWHM (cm) | MTF 10% (cm−1) | Noise | Dose (cGy) | |
|---|---|---|---|---|---|
| 100K | 0.51 | 0.22 | 3.66 | 0.47 | 100.37 |
| 20K | 0.48 | 0.22 | 3.67 | 0.48 | 21.21 |
| 5K | 0.39 | 0.22 | 3.66 | 0.47 | 5.31 |
| 1K | 0.57 | 0.22 | 3.56 | 0.47 | 1.06 |
| 500 | 0.37 | 0.23 | 3.63 | 0.47 | 0.53 |
| 1K(smoothed) | 0.55 | 0.28 | 2.99 | 0.47 | 1.06 |
Imaging dose
The reconstructed dose map of the imaging phantom was shown in Figure 7. The proton beamlets came from the left of the dose map at gantry angle 0 and rotated clockwise to cover a total of 180 degrees gantry angle. Mean imaging doses deposited inside the central slice of phantom assuming 2 mm slice thickness with 105, 2×10⁴, 5×10³, 103, 5×10² histories per beamlet were shown in Table 1.
Figure 7.
Distribution of imaging dose in the imaging phantom when 103 protons per beamlet was used. (Unit: cGy)
Imaging noise
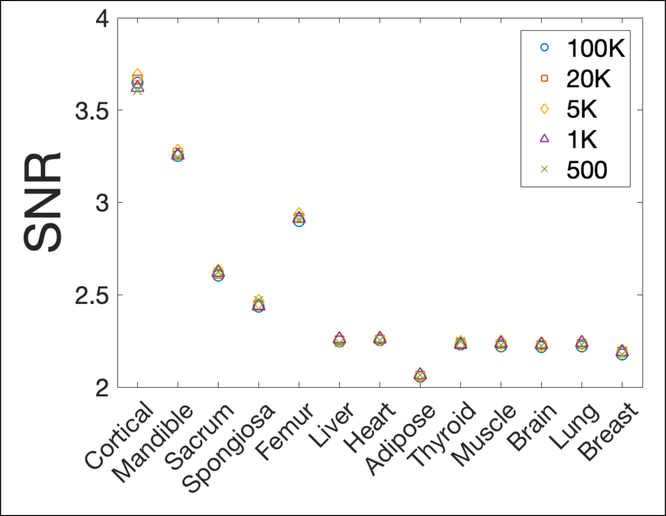
Noise measurements of the reconstructed phantom background with 5 levels of proton histories per beamlet were included in Table 1. SNRs were similar in all 5 scenarios as shown in Figure 8, indicating a similar noise level regardless of imaging dose if the additional electronic noise was not considered.
Figure 8.
Signal to noise ratio (SNR) of 13 inserts against background noise with 5 different proton numbers.
Scanning step size
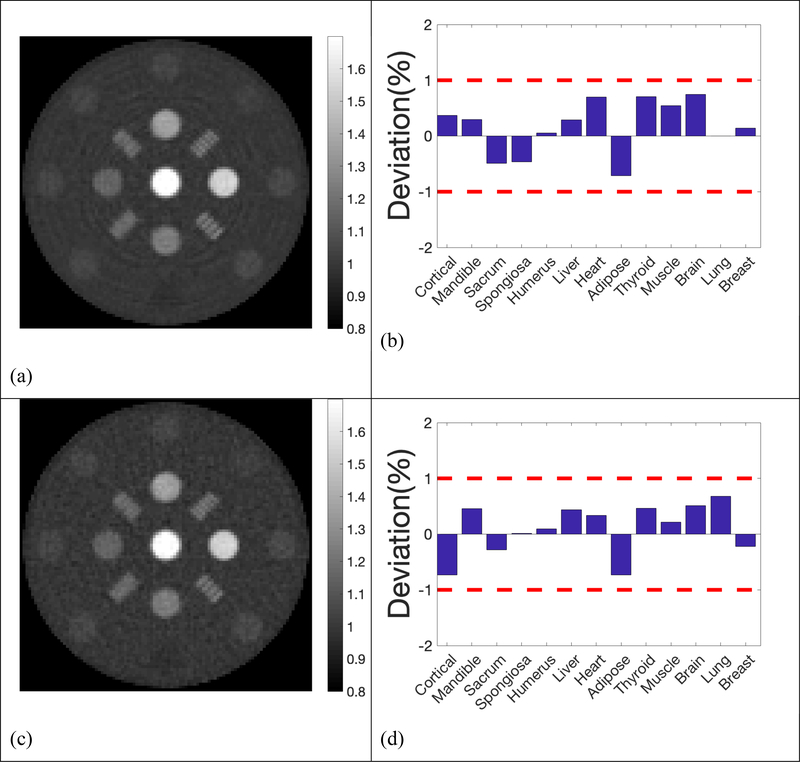
The reconstructed SPR maps and the deviation from the ground truths using larger step size (2 mm), twice as large as the one used in the previous simulation with 5×10³, 103, 5×10² histories per beamlet, were demonstrated in Figure 9. Our results showed that the increase of scanning step size degraded the imaging quality moderately, together with the accuracy in SPR. 10% MTF frequency was 3.62 lp/cm with step size of 1 mm, and reduced to 3.00 lp/cm with step size increased to 2 mm. With 5×10³ histories per beamlet, the mean deviation of all 13 inserts was 0.39% with step size of 1 mm. The mean deviation increased to 0.43% with step size increased to 2 mm.
Figure 9.
Reconstructed SPR and deviations in the 13 inserts compared to reference values with 2mm step size. a)& b) 5×10³ histories per beamlet; c) & d) 1×10³ histories per beamlet; e) & f) 5×10² histories per beamlet;
Electronic noise
The reconstructed SPR maps and the deviation from the ground truths of the simulation with three levels of noise were displaced in Figure 10. As the noise level increased from 10% to 25%, and to 50%, the mean deviation changed from 0.42% to 0.40%, and to 0.53%. The image quality degraded noticeably when noise level increased to 50% of the entrance signal, while the SPR deviations of most inserts were still within 1%.
Figure 10.
Reconstructed SPR and deviations in the 13 inserts compared to reference values with 5×10³ histories per beamlet at 3 levels of additional electronic noise; a) & b) Standard deviation of additional Gaussian noise was 10% of the entrance signal; c) & d) Standard deviation of additional Gaussian noise was 25% of the entrance signal; e) & f) Standard deviation of additional Gaussian noise was 50% of the entrance signal;
In addition, a demonstration of how three levels of noise were added to the doses in the ionization chambers was shown in Figure 11. The original dose curve was measured in the ionization chambers after a proton beamlet with 5 × 10s histories passing through the phantom. Both the original dose curve and the dose curves with three levels of additional noise were interpolated. The location of 90% of the Bragg peak which was used to calculate the shift of the longitudinal dose profile was marked on each interpolated dose curve. The markers were close to each other, except for the dose curve with noise of 50% of the entrance dose, which explained why the noise in the detector didn’t affect the quality of reconstruction images until it reached 50% of the entrance signal.
Figure 11.
A demonstration of how three levels of noise were added to the raw measurements from ionization chamber layers in 2 mm air gap. The raw data with and without noise were interpolated for higher spatial resolution, and the locations of 90% of the Bragg peak which were used to calculate the shift of the longitudinal dose profile were marked in all four scenarios. All markers overlapped well, except for the noise of 50% of the entrance dose.
Discussion
In this study, we proposed a new design of proton computed tomography for accurate calculation of proton range in treatment planning. The imaging system consists of a multiple-layer parallel ionization chamber (MLIC) to measure the proton residual dose profile in the longitudinal direction. Furthermore, two perpendicular strip ionization chambers were mounted at the surface of MLIC for measuring the lateral displacement and profiles of proton beamlets after exiting the imaging object. Compare with other detection methods, MLIC has high sensitivity in the range detection and very high speed that can capture a fast-moving beam spot.
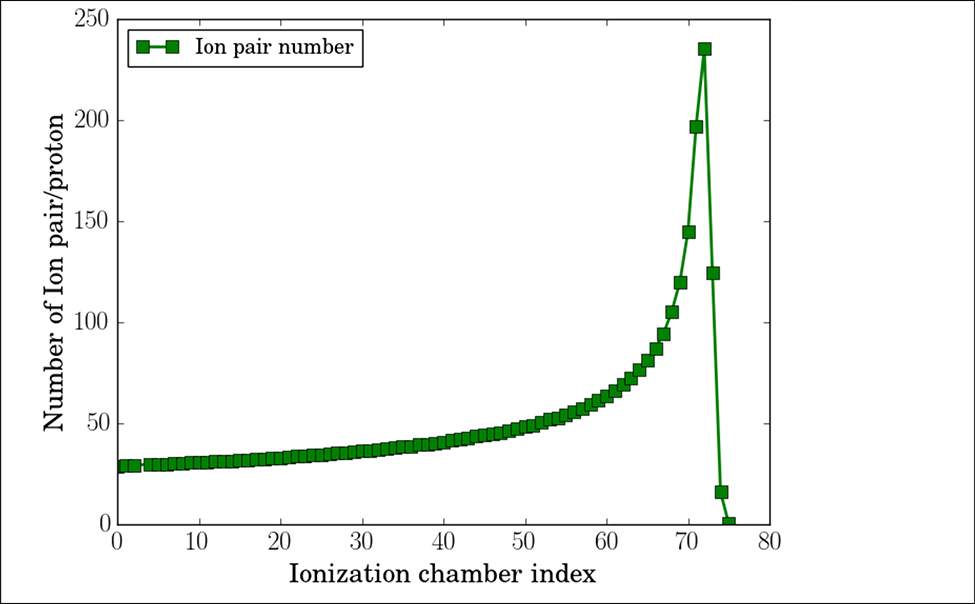
In our simulation, the dose deposited in each ionization chamber was scored by the number of ion pairs ionized in the 2 mm thick air cavity. According to our simulation, 37 and 236 pairs of ions per proton, as illustrated in figure 12, were produced in the ionization chamber at the entrance and Bragg peak location for proton beams with initial energy of 150 MeV, same energy as used in this study. The total ionization charge generated by 500 protons was between 2.9 fC and 18.8 fC, about 232 ppm and 1504 ppm of the most sensitive range of DDC264 (12.5 pC and 4.096 V). The capacitance of 25×25 cm2 parallel plate capacitor with 2 mm air gap is about 300 pf. Each plate was further divided into four segments, so the detector capacitance is reduced to 80pf. Based on the datasheet of DDC264, the noises level would be about 60 ppm and thus 25.86% (60 ppm/232 ppm) of the entrance signal generated by 500 protons. The electronic noise level can be suppressed by increasing imaging dose. With 105 protons per beamlet, the estimated electronic level would be as low as 0.13% (60 ppm/46400 ppm) of the entrance signal. Although the individual layer signals are noisy with low imaging dose, the range data can still be extracted with high precision. As presented in Figure 10, the additional Gaussian noise had little effects on the SPR accuracy and spatial resolution when the noise level was within 25%, but can degrade image quality and range prediction accuracy by more than 1% when noise level reached 50% of the entrance signal. Note that, additional sources of noise exist in the system, such as thermal noise and noise caused by Electromagnetic Field (EMF). The noise caused by EMF can be alleviated by shielding, the shielding technique used in MLIC is currently under development. The actual noise level and detection sensitivity will be studied experimentally.
Figure 12.
Number of ion-pair per proton in the multiple-layer ionization chamber with air gaps of 2 mm in thickness.
The goal of our design is not to develop a proton CT system that competes with other proton CT systems that track individual protons in aspects of proton SPR accuracy, imaging resolution and imaging dose, but a clinically feasible system that reduces uncertainty in proton SPR while retaining some benefits in lowering imaging dose when compared to conventional CT. Based on our simulation, proton SPR of the 13 tissue-equivalent inserts deviated less than 1% from the ground truths with more than 103 proton histories per beamlet, 1 mm scanning step size and half-circle gantry rotation. Proton SPR uncertainty stayed within the 1% error boundary for the majority of the 13 inserts even when the histories per beamlet were reduced to 103 or less. The determined imaging dose correlated linearly with proton histories per beamlet. The fact that reduction in imaging dose doesn’t sacrifice the accuracy significantly in proton SPR and imaging quality provides a strong justification for further research into the data acquisition, imaging reconstruction, and clinical application of the approach proposed in this study in order to further reduce the imaging dose. Notice that the current SPR accuracy and spatial resolution were achieved with a simulated collimator which induced minimum discrepancies in proton spectra before and after the collimation. Future experimental validation of the collimator effects on proton spectra should be conducted prior to imaging in order to ensure the pCT performance.
Accuracy of SPR could be compromised by the lack of correction for multiple-coulomb scattering in imaging reconstruction. One source that affects the accuracy of SPR is the shape of the imaging object. As protons experienced stronger scattering along their path through the thicker part of the imaging object in our study; the measured range, which was averaged over all protons in the beamlet, was slightly deeper than what would have been reached by an unscattered beamlet as scattered protons took a shorter path through the cylindrical intersection. Shifting average proton range away from the proton source underestimated the proton SPR. This effect depends on the shape of the imaged object, e.g. it would manifest oppositely in a cubic object as scattered protons now travel a longer path before they reach the detector. Correction for scattering should be considered in future research.
Another adversary source that affects proton range is heterogeneity in the imaging object. As one beamlet goes through various tissues due to scattering, e.g. some deviate through bone and others go through muscle, large uncertainties are expected in the determined average proton range due to the destruction of the pronounced Bragg peak from mixing paths. Further development with iterative algorithm for reconstruction would be necessary to reduce the impact of heterogeneity if higher accuracy in the reconstructed proton SPR is desired.
Maximum proton energy from a typical clinical cyclotron ranges from 235 MeV to 250 MeV, which translates to water-equivalent residual ranges between 34 cm and 38 cm. For adults of average size, currently available clinical cyclotrons have a high enough energy for proton CT imaging in body parts above the liver. For body parts that are too thick to penetrate even with highest proton energy, a conventional xCT scan is inevitable. However, the technique proposed in this study is still useful in this scheme. A personalized calibration from CT HU to proton SPR could be built by imaging thinner body parts with proton CT and conventional xCT, adding negligible imaging dose on top of the conventional xCT scan. Hence, proton SPR of the thicker body parts can be acquired with better accuracy by applying the personalized calibration of thinner portions of the body. Further research is needed to quantify the uncertainty in this scheme.
Conclusion
A new design of proton computed tomography utilizing a multiple-layer ionization chamber with a strip detector on the surface was proposed in this study. Unlike other designs utilizing a proton tracking system, our design takes pulses of protons for imaging. A prototype detector has been developed. The feasibility and performance of our design were examined with Monte Carlo simulation. Preliminary results showed that our design is capable of acquiring proton stopping power ratio within 1% accuracy by employing generic filtered back projection reconstruction without scatter correction. Our future research plans, encouraged by the promising preliminary results, will focus on experimental study with the prototype detector, iterative reconstruction and scatter correction.
Reference
- 1.International Commission on Radiological Protection. Task Group on Reference Man., “Report of the Task Group on Reference Man: A Report,” Pergamon Press; 23, (1975). [Google Scholar]
- 2.Minohara S, Kanai T, Endo M, Noda K, and Kanazawa M, “Respiratory gated irradiation system for heavy-ion radiotherapy,” Int. J. Radiat. Oncol. Biol. Phys 47(4), 1097–1103 (2000). [DOI] [PubMed] [Google Scholar]
- 3.Minohara S, Endo M, Kanai T, Kato H, and Tsujii H, “Estimating uncertainties of the geometrical range of particle radiotherapy during respiration,” Int. J. Radiat. Oncol. Biol. Phys 56(1), 121–125 (2003). [DOI] [PubMed] [Google Scholar]
- 4.Engelsman M et al. , “Intra-and interfractional patient motion for a variety of immobilization devices,” Med. Phys 32(11), 3468–3474 (2005). [DOI] [PubMed] [Google Scholar]
- 5.Paganetti H, “Range uncertainties in proton therapy and the role of Monte Carlo simulations,” Phys. Med. Biol. 57(11), R99 (2012). [DOI] [PMC free article] [PubMed] [Google Scholar]
- 6.M.Y. and X.R.Z. and P.C.P. and U.T. and R.M. and G.V. and J.E.C. and Dong L, “Comprehensive analysis of proton range uncertainties related to patient stopping-power-ratio estimation using the stoichiometric calibration,” Phys. Med. Biol 57(13), 4095 (2012). [DOI] [PMC free article] [PubMed] [Google Scholar]
- 7.Schneider U, Pedroni E, and Lomax A, “The calibration of CT Hounsfield units for radiotherapy treatment planning,” Phys. Med. Biol 41(1), 111 (1996). [DOI] [PubMed] [Google Scholar]
- 8.Hanson K, Bradbury J, Cannon T, and Hutson R, “Application of protons to computer tomography,” (1977). [Google Scholar]
- 9.Schneider U and Pedroni E, “Proton radiography as a tool for quality control in proton therapy,” Med. Phys 22(4), 353–363 (1995). [DOI] [PubMed] [Google Scholar]
- 10.Pemler P, Besserer J, and De Boer J, “A detector system for proton radiography on the gantry of the Paul-Scherrer-Institute,” Nucl. Instrum. Methods Phys. Res 432, 483 (1999). [Google Scholar]
- 11.Hurley RF, Schulte RW, and Bashkirov VA, “Water-equivalent path length calibration of a prototype proton CT scanner,” Med. Phys 39, 2438 (2012). [DOI] [PMC free article] [PubMed] [Google Scholar]
- 12.Johnson RP et al. , “Results from a pre-clinical head scanner for proton CT,” in 2014 IEEE Nucl. Sci. Symp. Med. Imaging Conf.(2014), pp. 1–5. [Google Scholar]
- 13.Penfold SN, Schulte RW, Censor Y, and Rosenfeld AB, “Total variation superiorization schemes in proton computed tomography image reconstruction,” Med. Phys 37(11), 5887–5895 (2010). [DOI] [PMC free article] [PubMed] [Google Scholar]
- 14.Poludniowski G, Allinson NM, and Evans PM, “Proton radiography and tomography with application to proton therapy,” Br. J. Radiol 88(1053), 20150134 (2015). [DOI] [PMC free article] [PubMed] [Google Scholar]
- 15.Zygmanski P, Gall KP, Rabin MS, and Rosenthal SJ, “The measurement of proton stopping power using proton-cone-beam computed tomography,” Phys. Med. Biol 45(2), 511 (2000). [DOI] [PubMed] [Google Scholar]
- 16.Bentefour EH, Shikui T, Prieels D, and Lu HM, “Effect of tissue heterogeneity on an in vivo range verification technique for proton therapy,” Phys. Med. Biol 57(17), 5473 (2012). [DOI] [PubMed] [Google Scholar]
- 17.Lu H-M, “A point dose method for in vivo range verification in proton therapy,” Phys. Med. Biol 53(23), N415 (2008). [DOI] [PubMed] [Google Scholar]
- 18.Gottschalk B, Tang S, Bentefour EH, Cascio EW, Prieels D, and Lu H, “Water equivalent path length measurement in proton radiotherapy using time resolved diode dosimetry,” Med. Phys 38, 2282 (2011). [DOI] [PMC free article] [PubMed] [Google Scholar]
- 19.Poludniowski G et al. , “Proton-counting radiography for proton therapy: a proof of principle using CMOS APS technology,” Phys. Med. Biol 59(11), 2569–2581 (2014). [DOI] [PMC free article] [PubMed] [Google Scholar]
- 20.Telsemeyer J, Jäkel O, and Martišíková M, “Quantitative carbon ion beam radiography and tomography with a flat-panel detector,” Phys. Med. Biol 57(23), 7957–7971 (2012). [DOI] [PubMed] [Google Scholar]
- 21.Jee K-W et al. , “Investigation of time-resolved proton radiography using x-ray flat-panel imaging system,” Phys. Med. Biol 62(5), 1905–1919 (2017). [DOI] [PubMed] [Google Scholar]
- 22.Testa M et al. , “Proton radiography and proton computed tomography based on time-resolved dose measurements,” Phys. Med. Biol 58(22), 8215–8233 (2013). [DOI] [PubMed] [Google Scholar]
- 23.Zhang R, Jee K-W, Cascio E, Sharp GC, Flanz JB, and Lu H-M, “Improvement of single detector proton radiography by incorporating intensity of time-resolved dose rate functions,” Phys. Med. Biol 63(1), 015030 (2017). [DOI] [PubMed] [Google Scholar]
- 24.Langner UW, Eley JG, Dong L, and Langen K, “Comparison of multi-institutional Varian ProBeam pencil beam scanning proton beam commissioning data,” J. Appl. Clin. Med. Phys 18(3), 96–107 (2017). [DOI] [PMC free article] [PubMed] [Google Scholar]
- 25.Pidikiti R et al. , “Commissioning of the world’s first compact pencil-beam scanning proton therapy system,” J. Appl. Clin. Med. Phys 19(1), 94–105 (2018). [DOI] [PMC free article] [PubMed] [Google Scholar]
- 26.Gillin MT et al. , “Commissioning of the discrete spot scanning proton beam delivery system at the University of Texas M.D. Anderson Cancer Center, Proton Therapy Center, Houston,” Med. Phys. 37(1), 154–163 (2010). [DOI] [PMC free article] [PubMed] [Google Scholar]
- 27.Perl J, Shin J, Schümann J, Faddegon B, and Paganetti H, “TOPAS: An innovative proton Monte Carlo platform for research and clinical applications,” Med. Phys. 39(11), 6818–6837 (2012). [DOI] [PMC free article] [PubMed] [Google Scholar]
- 28.Agostinelli S et al. , “GEANT4—a simulation toolkit,” Nucl. instruments methods Phys. Res. Sect. A Accel. Spectrometers, Detect. Assoc. Equip 506(3), 250–303 (2003). [Google Scholar]
- 29.Allison J et al. , “Geant4 developments and applications,” IEEE Trans. Nucl. Sci 53(1), 270–278 (2006). [Google Scholar]


