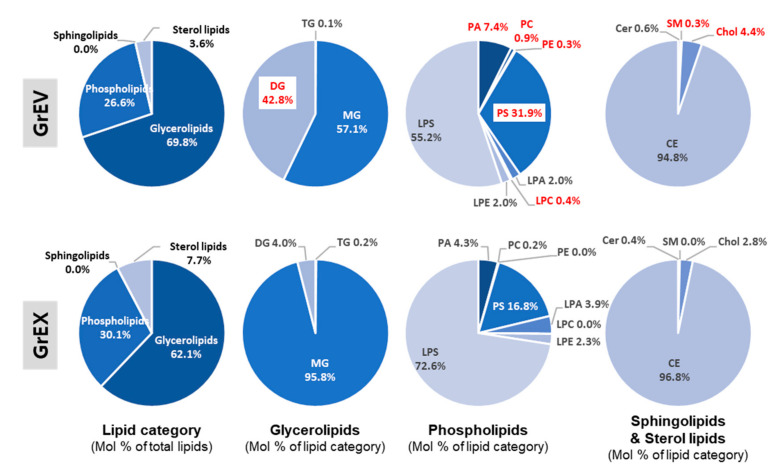
Figure 8.
Pie diagrams for lipidomic compositions and relative proportions in GrEVs (upper) and GrEXs. The composition of each lipid category or lipid class (glycerolipids, phospholipids, and sphingolipids/sterol lipids) is expressed as the mol% of total lipids or the mol% of each lipid category. Lipid classes with considerable changes in GrEVs compared to GrEXs are indicated with red colored fonts; 100% by lipid class in GrEVs or GrEXs corresponds to the percentage of each lipid in lipid category.

