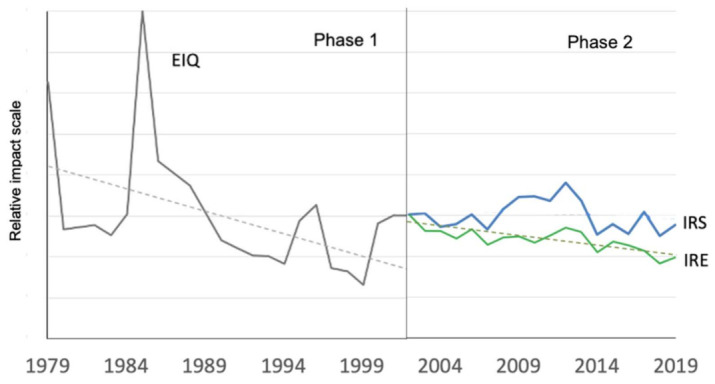
Figure 12.

Summarized view of pesticide impacts based on annual treatments applied in commercial orchards from 1979 to 2019. Full lines: mean values; dotted lines: significant (p 0.05) linear trends. Orchards located at Franklin, Hemmingford and Oka (phase 1) and at Compton, Dunham, Franklin, Hemmingford, Oka, Sainte-Famille and Saint-Joseph (phase 2). Vertical bars represent standard error. The starting point of the IRS/IRE curves (2002) has been appended to the endpoint of the EIQ curve (2001). All lines and curves are isoscaled.
