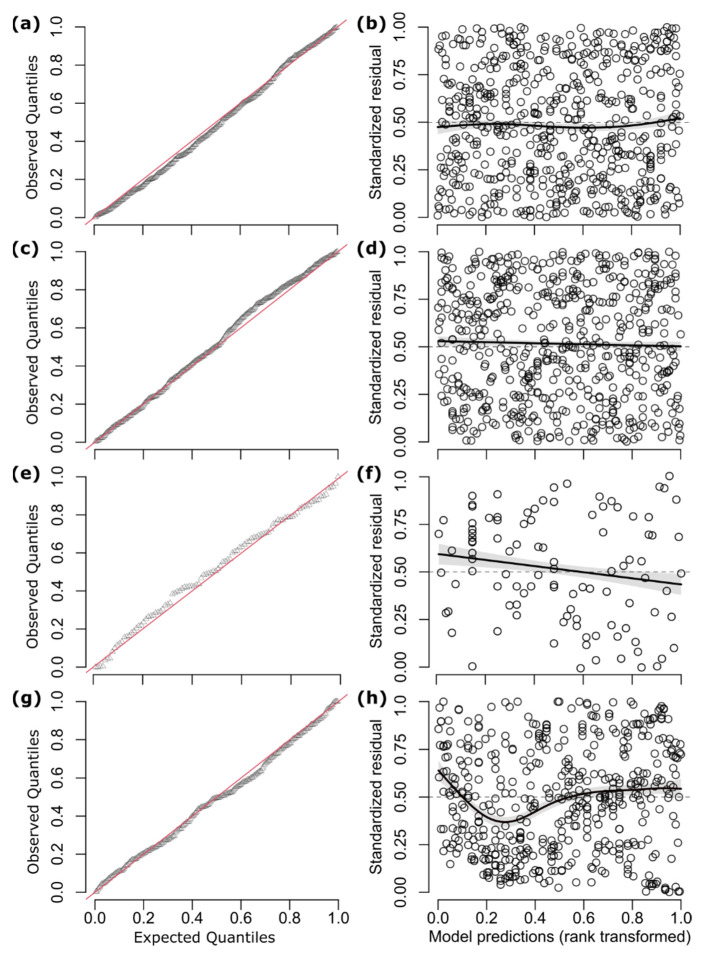
Figure A2.
Residual diagnostic plots for glmms of trait variations over the year in both habitats and on both plants, as presented in Figure 2A: (a,b) glmm of the proportions of individuals belonging to eusocial species; (c,d) glmm of the proportion of individuals belonging to ground-nesting species; (e,f) glmm of ITD (mm) of Bombus specimens; (g,h) glmm of ITD (mm) of other wild bee specimens. The qq-plots (left panels) detect no overall deviations from the expected residual distribution, while the residuals vs. predicted values plots (right panels) detect no clear deviation from uniformity (the black curve represents the median of standardized residuals estimated by quantile regression).

