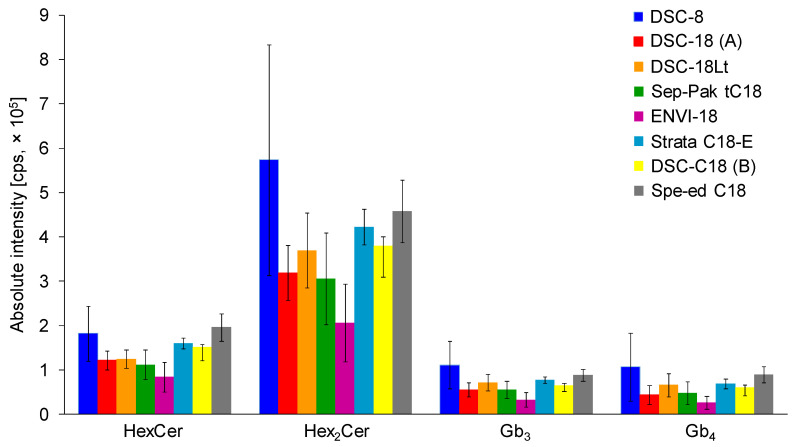
Figure 2.
Comparison of C18-based solid-phase extraction (SPE) columns from different vendors using the same extraction protocol (see details in Experimental section). Bar graphs display means of absolute peak intensities of the most abundant species within particular GSL subclasses, and error bars illustrate standard deviations for 9 analyses (each SPE extraction was performed in triplicate and 3 measurements were performed for each sample).

