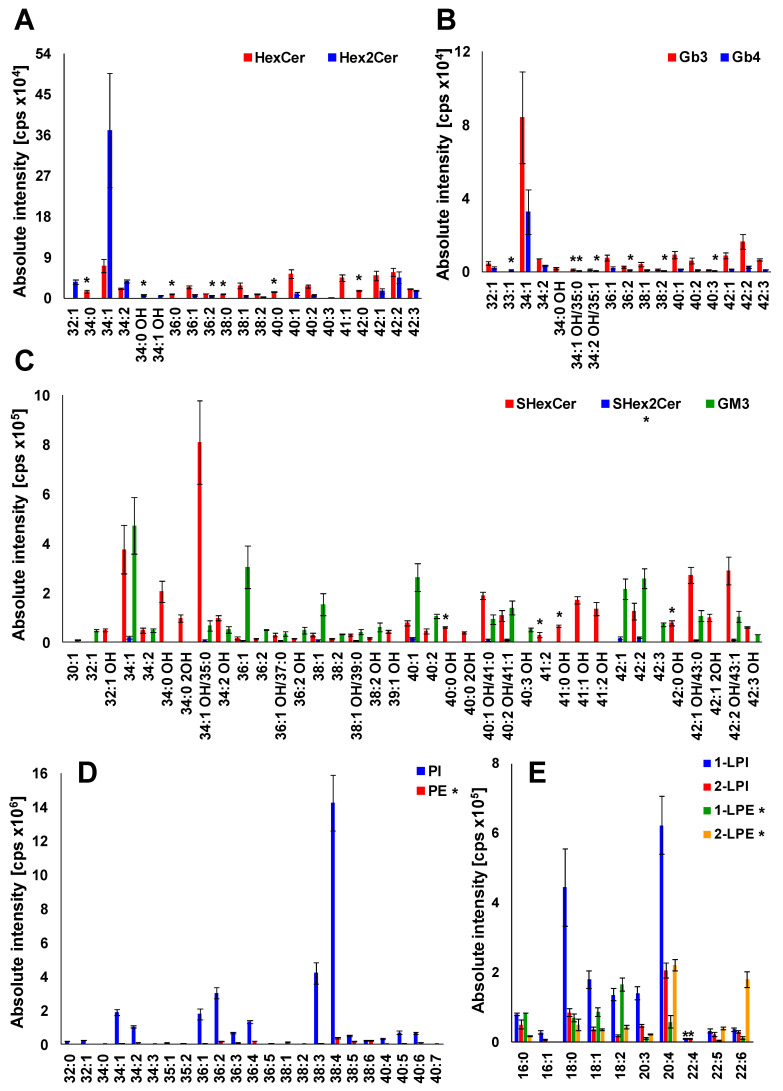
Figure 8.
Profile of human plasma lipids. (A) mono- and dihexosylceramides, (B) globotriaosyl- and globotetraosylceramides, (C) sulfatides and gangliosides, (D) phospholipids, and (E) lysophospholipids. The individual lipid species within particular lipid subclass were identified and structurally characterized by the interpretation of MS/MS spectra (see Figure 5, Figure 6 and Figures S4–S131). Bar graphs represent the mean intensities (based on 3 replicates) as a function of sum composition with error bars corresponding to relative standard deviation (RSD). Lipid species labeled by an asterisk were not confirmed by MS/MS experiments.

