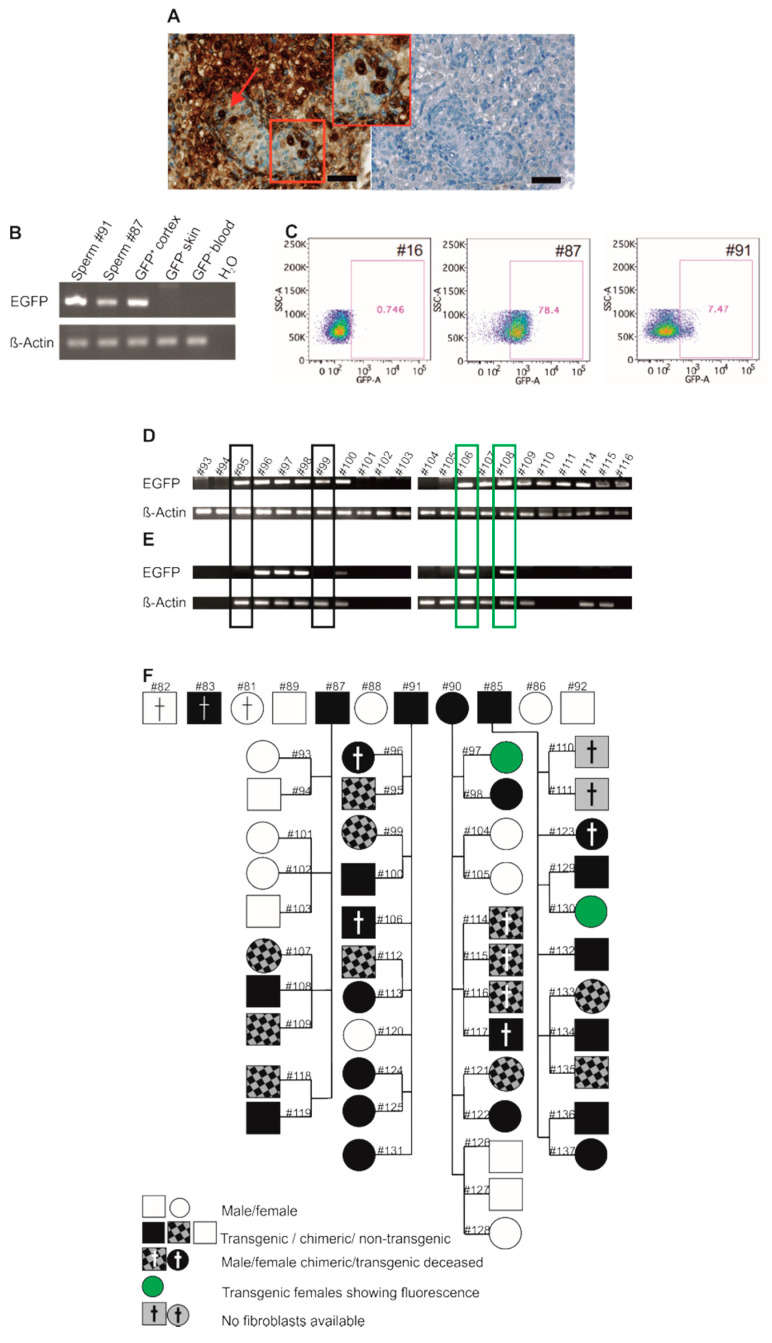
Figure 5.
Germline transmission of the transgene. (A) Immunohistochemical detection of EGFP in the neonatal testis of #83. All germ cells show an intense EGFP signal, while intra-tubular somatic cells show only little EGFP signals. Interstitial somatic cells are strongly stained. The boxed area is shown at higher magnification (middle image in (A)). Right image: corresponding negative (wt) control. Scale bars: 50 µm. (B) EGFP PCR on genomic DNA isolated from ejaculated sperm from transgenic founders #87 and #91. Both samples show EGFP amplicons. (C) Flow-cytometric analysis of semen samples from transgenic founders #87 and #91 and a wt control (#16). The transgenic samples show fluorescence above background levels. (D) Genotyping of an exemplary subset of F1 progeny using DNA directly isolated from skin. β-Actin was used as positive control. The genotyping results for all F1 animals are shown in Figure S1. (E) Genotyping of F1 progeny using DNA isolated from frozen-thawed and re-cultured skin fibroblasts. Only a subpopulation of the animals being positive in (D) remained EGFP-positive using selected fibroblasts (two animals exemplarily highlighted by green boxes), while chimeric littermates of transgenic animals switched from “positive” to “negative” (two animals exemplarily highlighted by black boxes). β-Actin was used as a positive control. Those animals that show no β-Actin band in (E) (#110 and #111) were not tested using hematopoietic cell-depleted cell cultures. (F) Pedigree showing the founders and 45 F1 animals obtained from natural mating of animals #87, #91, #90, and #85 with wt partners (latter not depicted). All founders were fertile and transmitted the transgene to progeny.

