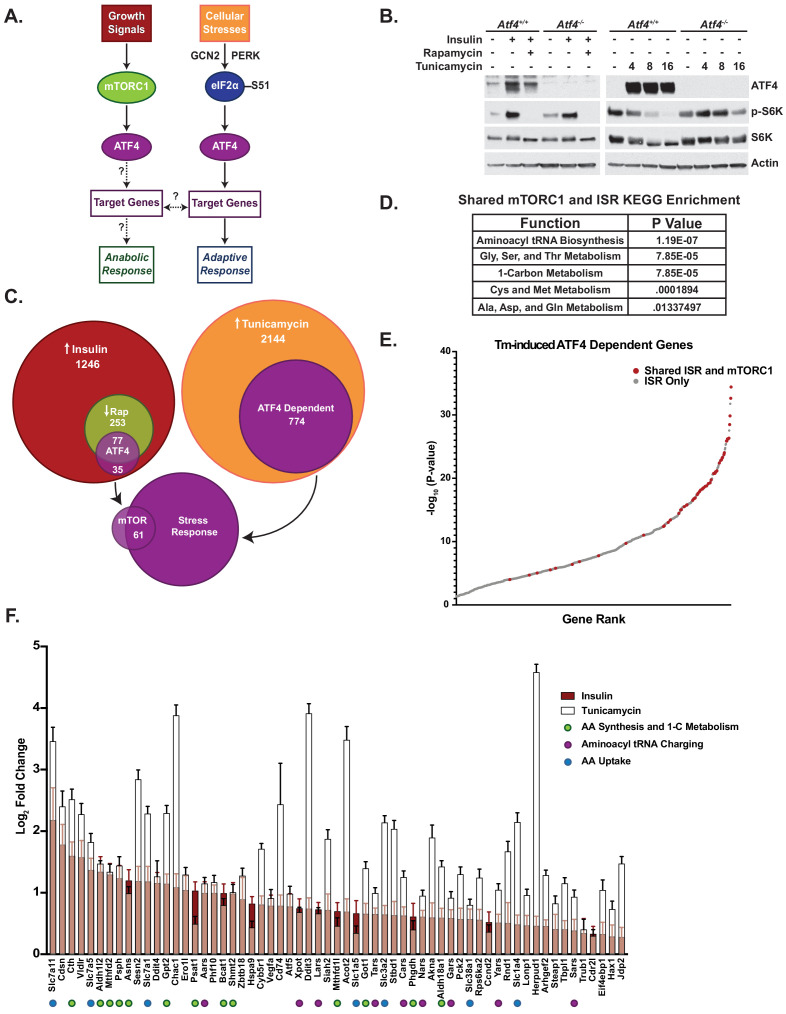
Figure 1. Mechanistic target of rapamycin complex 1 (mTORC1) signaling activates a subset of activating transcription factor 4 (ATF4)-dependent genes also activated by the integrated stress response (ISR).
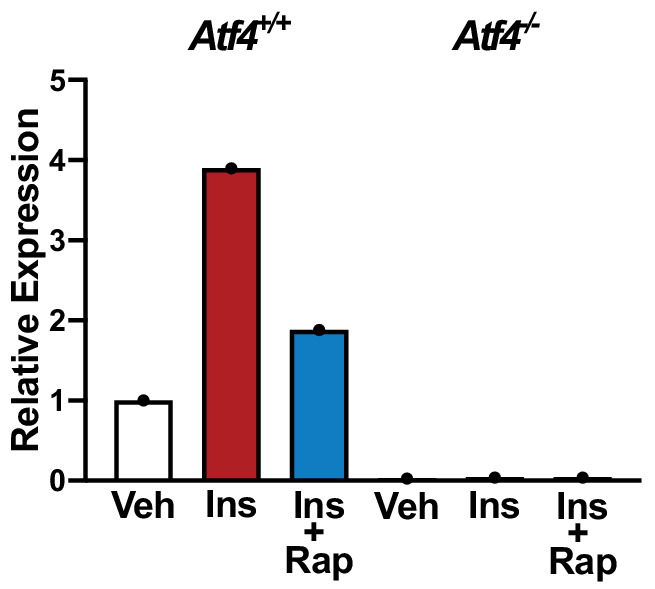
(A) Schematic of the dual regulation of ATF4 and the unknowns addressed in this study. (B) Immunoblots of parallel lysates from RNA-seq experiment. Atf4+/+ and Atf4-/- mouse embryo fibroblasts were treated, as indicated, with insulin (500 nM, 16 hr) or rapamycin (20 nM, 30 min) prior to insulin (left) or with tunicamycin (2 μg/mL) for 4, 8, or 16 hr (right). Insulin response is quantified in Figure 1—figure supplement 1. (C) Venn diagram depicting number and overlap of mTORC1- and ISR-induced transcripts, including those increased with insulin (red), decreased relative to insulin with rapamycin (green), and increased with 4 hr tunicamycin (orange), and those dependent on ATF4 within these categories (purple), all with p-values <0.05. Only 61 ATF4-dependent genes overlap between those significantly induced by insulin in a rapamycin-sensitive manner and those induced by tunicamycin. Gene lists per category are provided in Figure 1—source data 1. (D) KEGG enrichment of the shared mTORC1- and ISR-induced ATF4 target genes. p-Values provided were false discovery rate corrected. (E) Plot of -log10p-values of 774 ATF4-dependent tunicamycin-induced genes. ATF4-dependent genes induced by both mTORC1 signaling and tunicamycin treatment (shared ISR and mTORC1) are shown in red. (F) The 61 ATF4-dependent genes induced by both mTORC1 (i.e., rapamycin-sensitive insulin stimulation) and tunicamycin treatment are shown ranked from left to right in order of greatest log2-fold change with insulin (red bars), with the corresponding tunicamycin-induced changes superimposed (white bars) (n = 4). Error bars depict 95% confidence intervals.
Figure 1—figure supplement 1. Quantification of immunoblot shown in Figure 1B.


