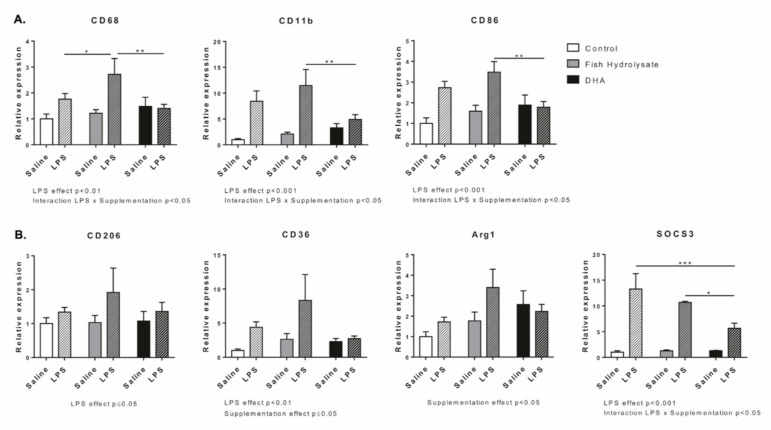
Figure 4.
Expression of M1 (A) (CD68, CD11b and CD86) and M2 (B) (CD206, CD36, Arg1 and SOCS3) microglial markers in the hippocampus of mice fed orally with control solution (in white), fish hydrolysate (in grey) or DHA (in black) by daily gavage for 18 days, 2 h following LPS injection (125 µg/kg) (hatched bars) (* p < 0.05, ** p < 0.01, *** p < 0.001 by 2-way ANOVA and Fisher’s LSD post hoc test; n = 4–6 per group). Data are presented as mean ± SEM. DHA: docosahexaenoic acid; LPS: lipopolysaccharide.

