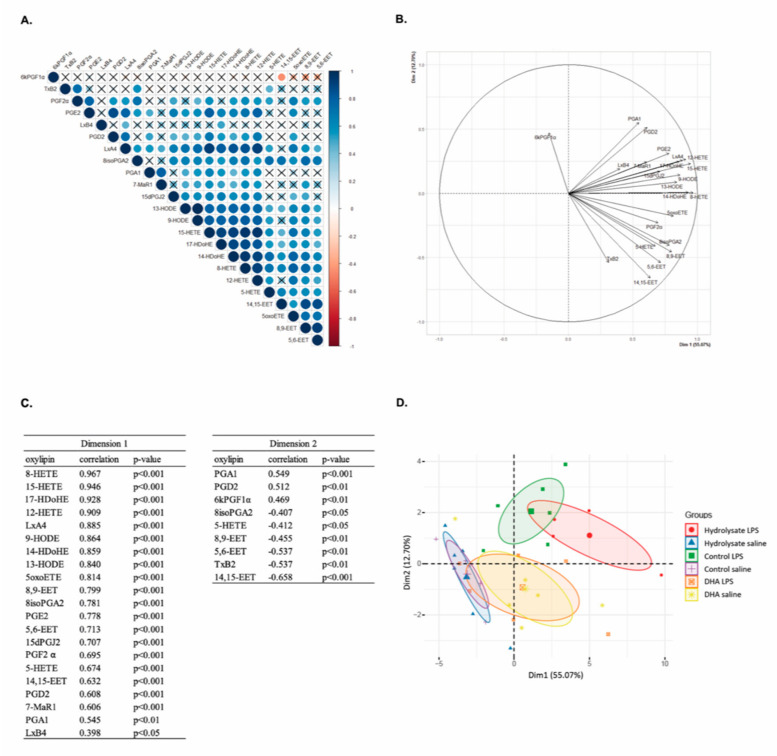
Figure 6.
Multivariate analysis of oxylipins in the hippocampus of mice fed orally with control solution, fish hydrolysate or DHA by daily gavage for 18 days, 2 h following LPS injection (125 µg/kg). (A) Correlation matrix of the 23 oxylipins (blue: positive correlation, red: negative correlation, X: no significant correlation). (B) Correlation circle from PCA. (C) Correlation between each variable and the principal component score from PCA (dimension 1 or dimension 2). (D) Individual map of PCA. 5-oxoETE: 5-oxo-eicosatetraenoic; 7-MaR1: 7(S)-maresin; EET: epoxy-eicosatrienoic acid; HDoHE: hydroxy-docosahexaenoic acid; HETE: hydroxy-eicosatetraenoic acid; HODE: hydroxy-octadecadienoic acid; Lx: lipoxin; PCA: principal component analysis; PG: prostaglandin; TxB2: thromboxane B2.

