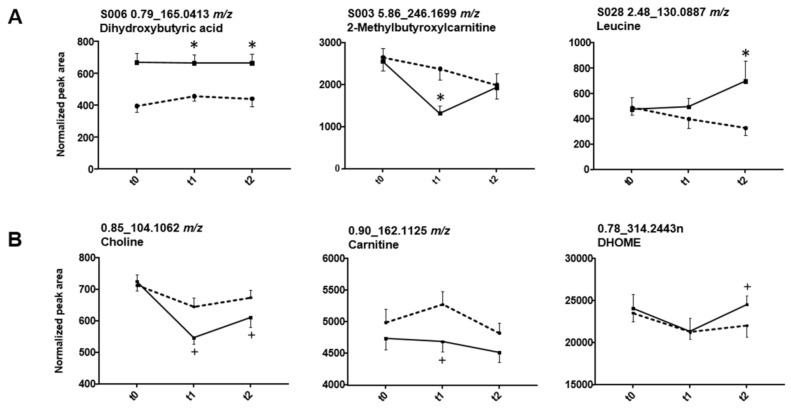
Figure 5.
Influence of GHB on selected compounds detected using univariate statistics (volcano plot) (A) and mixed-effect model statistics (B). Solid lines indicate drug, broken lines placebo intake, respectively. Data points represent mean and standard error of mean (SEM) of 19 replicates. Detection using univariate volcano plot analysis (p < 0.05 and fc > 1.5 in at least 70% of the samples, (A) is indicated by an asterisk. Significant changes (p < 0.05) observed by mixed-effect model calculations (B) are highlighted with +.

