Abstract
Background and objectives:
Electroporation is the phenomenon by which cell membrane permeability to ions and macromolecules is increased when the cell is briefly exposed to high electric fields. In electroporation-based treatments, such exposure is typically performed by delivering high voltage pulses across needle electrodes in tissue. For a given tissue and pulsing protocol, an electric field magnitude threshold exists that must be overreached for treatment efficacy. However, it is hard to preoperatively infer the treatment volume because the electric field distribution intricately depends on the electrodes’ positioning and length, the applied voltage, and the electric conductivity of the treated tissues. For illustrating such dependencies, we have created EView (https://eview.upf.edu), a web platform that estimates the electric field distribution for arbitrary needle electrode locations and orientations and overlays it on 3D medical images.
Methods:
A client-server approach has been implemented to let the user set the electrode configuration easily on the web browser, whereas the simulation is computed on a dedicated server. By means of the finite element method, the electric field is solved in a 3D volume. For the sake of simplicity, only a homogeneous tissue is modeled, assuming the same properties for healthy and pathologic tissues. The non-linear dependence of tissue conductivity on the electric field due to the electroporation effect is modeled. The implemented model has been validated against a state of the art finite element solver, and the server has undergone a heavy load test to ensure reliability and to report execution times.
Results:
The electric field is rapidly computed for any electrode and tissue configuration, and alternative setups can be easily compared. The platform provides the same results as the state of the art finite element solver (Dice = 98.3 ± 0.4%). During the high load test, the server remained responsive. Simulations are computed in less than 2 min for simple cases consisting of two electrodes and take up to 40 min for complex scenarios consisting of 6 electrodes.
Conclusions:
With this free platform we provide expert and non-expert electroporation users a way to rapidly model the electric field distribution for arbitrary electrode configurations.
Keywords: Electroporation, Web platform, Electric field visualization, Modeling, Simulation, Treatment planning, Electrochemotherapy, Irreversible electroporation
1. Introduction
Electroporation is the phenomenon by which cell membrane permeability to ions and macromolecules is artificially increased by exposing the cell to high electric fields. Typically, such exposure consists in the delivery across electrode pairs of high voltage pulses with a duration ranging from tens of microseconds to a few milliseconds. This induces electric field magnitudes in the order of hundreds of volts per centimeter [1,2]. Electroporation is the basis of a number of clinical treatments applied to human tissues. It is used, for instance, to enhance the uptake of cytotoxic drugs in an oncological therapy known as electrochemotherapy (ECT) [3,4] or to non-thermally ablate malignant tissues in a treatment known as irreversible electroporation (IRE) [5,6].
In recent years, computational treatment planning has greatly improved prognosis in all branches of medicine. It is already a common practice in radiotherapy [7–9], and it is starting to be implemented in other therapies such as radiofrequency ablation [10,11] and electroporation based treatments [12,13].
Planning for electroporation procedures relies on defining the electrode setup (number of electrodes and voltage pairs) and simulating the electric field distribution in the corresponding tissue [14,15]. It is generally accepted that, for a given tissue and a given pulsing protocol, electroporation is effective where the electric field magnitude caused by the pulses is above a certain threshold. Tissue electric conductivity cannot be considered constant in electroporation treatments; because of the permeability increase to ions during electroporation, conductivity rises, an effect which is approximated by modeling the conductivity as a function of the electric field magnitude [16–18]. Additionally, the electric field distribution is very susceptible to electrode setup. Thus, if the conductivity is incorrectly modeled, or the electrodes fail to be positioned according to the planning, the tumor will not be fully treated during the intervention. Being able to model and to account for multiple, plausible, scenarios (considering these uncertainties) will help in predicting the outcome even when the intervention setup differs from the planned one.
COMSOL Multiphysics (COMSOL AB, Stockholm, Sweden) and other general purpose simulation tools based on the finite element method (FEM) or the finite difference method (FDM) are widely used for electroporation modeling in scientific studies [19–22]. However, the use of this sort of tool requires significant expertise in physics and in numerical modeling. Thus, they are not adequate for clinical users.
There are a few precedents of specific software tools for estimating the electric field distribution in electroporation based therapies which have been developed aiming at clinical users.
For instance, the NanoKnife (AngioDynamics, Queensbury, NY, USA) system for irreversible electroporation includes a simulation tool to approximate the electric field distribution once the electrodes are implanted. However, this tool simply assumes that the electrodes are placed in parallel and displays an approximation of the volume that will be treated in planes perpendicular and/or coplanar to the electrodes. Another example is the educational tool developed by Mahnič-Kalamiza et al. [23], both desktop and web based, to visualize the electric field distribution using up to twelve electrodes on a 2D domain representing an anatomical tissue. A more advanced example is the platform VISIFIELD (www.visifield.com) developed by a team of the University of Ljubljana, Slovenia. VISIFIELD is an electroporation planning web platform that allows a patient specific modeling based on patient medical images [24,25]. It provides tools to manually and automatically perform image segmentation, to manually insert the electrodes, to compute the electric field distribution and visualize it. It has already been used in studies focusing on liver tumors, and on canine brain tumors [26,27]. The use of VISIFIELD implies the execution of multiple semi automatic processes with lots of steps. Its authors report that only the segmentation process takes between 6 min and an hour.
VISIFIELD is a powerful tool that can be used for realistic patient specific treatment planning. COMSOL and other FEM/FDM solvers can also be used for that same purpose if coupled with external segmentation tools [22,28]. However, to account for different scenarios (e.g. electrodes positioning and length of exposure, applied voltage and electric conductivity of the treated tissues) that can differ between planning and intervention, these tools lack adaptability as they are too complex and computationally expensive. That is, these tools are too cumbersome to use when a rapid estimation is desired. On the other hand, the built-in modeling of NanoKnife and the educational tool provided by Mahnič-Kalamiza et al. [23] are much more adaptable as they provide a near real time simulation of the electric field for any electrode configuration, but they perform too simplistic modeling, considering only a 2D tissue with a constant electric conductivity. We have created the tool presented here, EView, trying to fill the gap between the two approaches for electroporation modeling. That is, with EView we try to provide a new balance between ease of use and accuracy. On one hand, compared to the more simple tools, EView adds 3D modeling in homogeneous tissues with non-linear electric conductivity, which provides a much realistic simulation. On the other hand, it does not evaluate the interaction between different conducting tissues, such as tumor and healthy organ, that the patient-specific tools provide, but EView improves user-friendliness and drastically reduces computation time. Thus, the goal is to provide a good initial estimate of the electric field distribution and to illustrate the dependencies on electrodes’ positioning, orientation and length, on the applied voltage, and on the electric conductivity of the treated tissues. EView aims to be the first step for students, researchers and clinicians that want to enter the electroporation field or that want to understand better how the electric field behaves in electroporation therapies.
We have validated our implementation comparing, for different scenarios, the computed electric field distribution by EView with that computed with COMSOL Multiphysics. In addition, we have performed a load test to ensure a reliable operation and we report the simulation times as a function of the number of electrodes used.
EView is available at https://eview.upf.edu.
2. Methods
2.1. User experience
EView has been developed with the aim of facilitating the understanding of how the electric field distribution depends on the geometry of the electrode setup and the applied voltage. The user simply needs to: (1) specify tissue conductivity (which for the cases of hepatic and pancreatic tissue is pre-specified), (2) insert the electrodes and (3) specify the voltage that will be applied across electrode pairs. The electric field is simulated according to the specified configuration and the electric field is displayed.
This platform is free to use, but it is required to register before-hand in order to be able to execute a simulation. Non-registered users can visualize an example and interact with the electric field distribution, as well as experience with electrode configurations. A tutorial is also provided to aid new users getting started, and clear explanations are available for all the steps.
2.1.1. User workflow
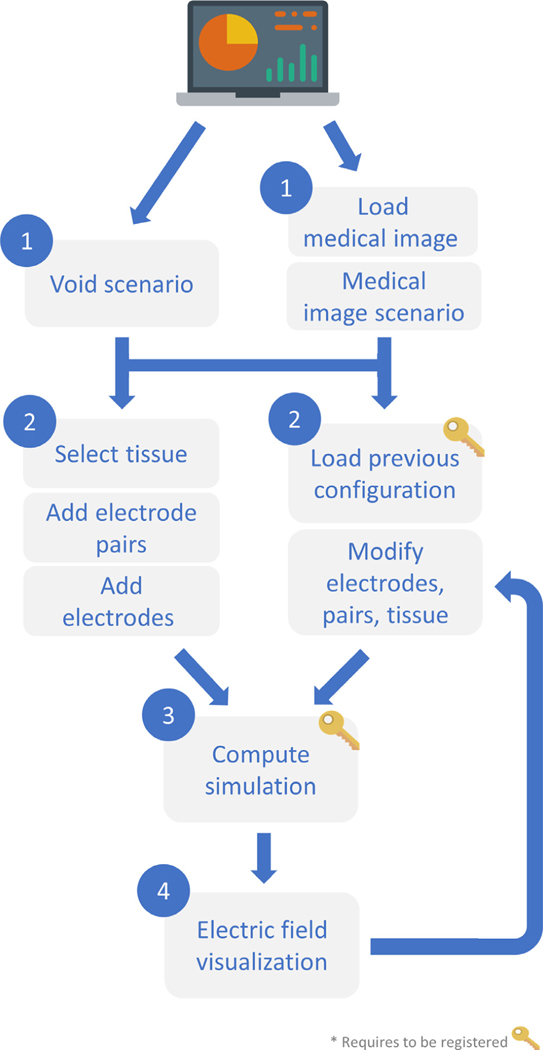
Fig. 1 displays the workflow to obtain the simulated electric field distribution. Upon web page loading, a void scenario is presented, representing a homogeneous volume. The background is simply black. The user can select a tissue, place the electrodes in this scenario and define the voltages that will be applied between the electrode pairs. Additionally, previous simulation configurations can be loaded and modified. This way, the electric field distribution can be compared between slightly modified setups. By just defining these three parameters (electrodes positioning, voltage pairs and tissue) the simulation can be computed. The modeled electric field is displayed on the current scenario, and the electric field is projected around the electrodes. Alternatively, a medical image can be loaded. Thus, the electrodes can be placed according to anatomical landmarks and a tissue can be selected according to the region of interest of the image. The simulated electric field is visualized as an overlay on the medical image.
Fig. 1.
Workflow diagram of EView for the simulation and visualization of the electric field.
2.1.2. Graphical user interface
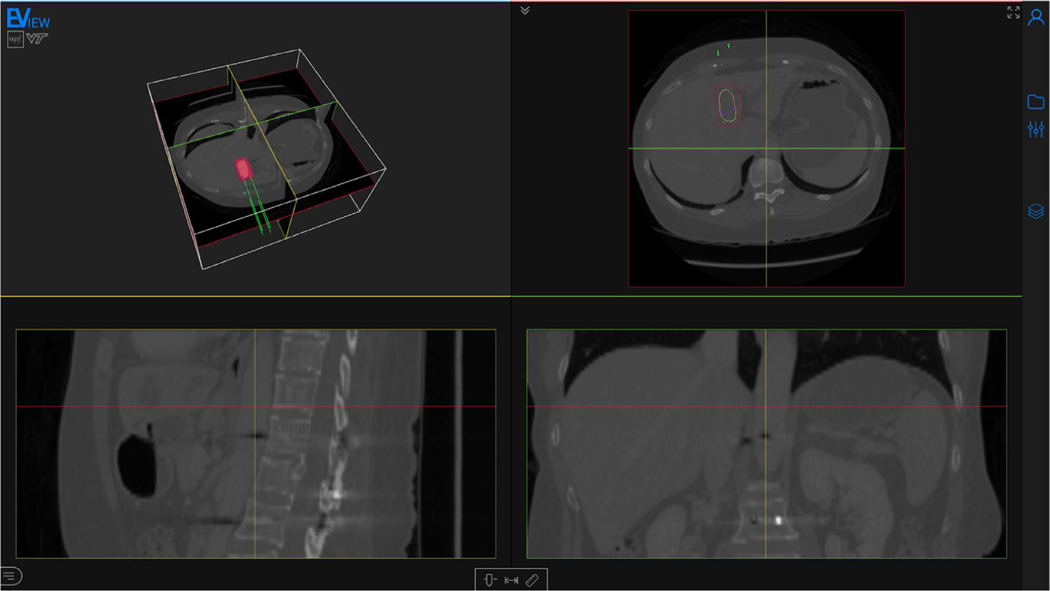
The main content of the web page is a viewer. A thin sidebar can be found at the right of the screen, containing the necessary menus and tools for setting up the electrode configuration, running the simulation and visualizing the electric field. The viewer is composed of four different views: a 3D window, and axial, sagittal and coronal views (Fig. 2).
Fig. 2.
Screenshot of the webpage with a computed electric field distribution. The page is composed mainly of the viewer, and a toolbar (right) containing all the tools for preparing the model and for the visualization. The displayed medical image is an abdominal CT with a hepatocellular carcinoma (yellow). Four electrodes (green) are inserted and the isosurface corresponding to an electric field of 600 V/cm is visualized (red). Medical image from 3D-IRCADb-01 database from IRCAD, France.
The accepted image formats are Neuroimaging Informatics Technology Initiative (NIfTI), Nearly Raw Raster Data (Nrrd), and Digital Imaging and Communications in Medicine (DICOM). Brightness and contrast can be adjusted in the bottom toolbar of the viewer. The images are never uploaded to the server, they are only displayed on the client web browser, and are erased from the browser upon reloading/closing the session.
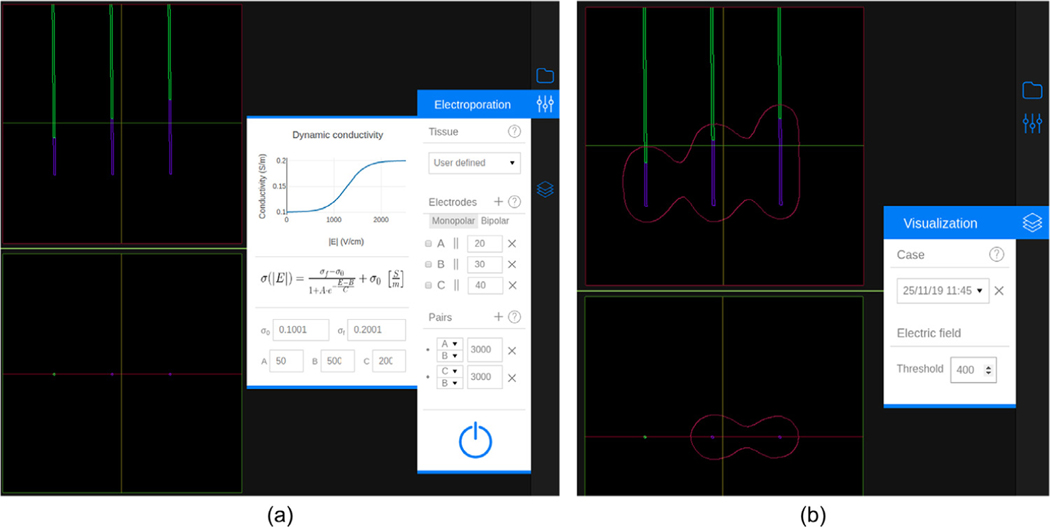
The configuration of the setup (tissue selection, electrode insertion and voltage pairs definition) is performed through the “Electroporation” menu (Fig. 3 (a)). A tissue can be selected from the prespecified ones (liver or pancreas) or manually specified by modifying the parameters of the sigmoid function (Eq. (2)) that defines the dependence of the conductivity on the electric field magnitude. Up to six monopolar electrodes can be inserted, with independent exposure lengths between 5 and 40 mm. Electrodes separation can be measured and all electrodes can be automatically oriented in parallel to a specific one. The voltage has to be indicated for each electrode pair within the range from 50 V to 3000 V at 50 V steps. There can be a maximum of N (N −1)/2 pairs for monopolar electrodes, where N is the number of inserted electrodes. Alternatively, a single bipolar electrode can also be defined. The length of both exposed parts and the insulator in between can be set independently between 5 and 20 mm.
Fig. 3.
An electrode configuration with three electrodes and two pairs. (a) Inserted electrodes and the “Electroporation” menu. The menu contains three sections: Tissue, Electrodes and Pairs. The dynamic (non-linear) conductivity plot is displayed when the selected tissue is “User defined”. The “Electrodes” section shows a list of all the defined electrodes. Each element has, from left to right, the distance combobox (to measure separation between electrodes), the electrode label, the parallel button, the exposed length, and the delete button. The “Pairs” section shows a list of the specified pairs, showing the labels of the two electrodes selected and their voltage. At the bottom of the menu there is a button to execute the simulation. (b) Visualization of the electric field distribution at 400 V/cm and the “Visualization” menu. In this menu a simulation (case) can be selected and the electric field threshold can be specified.
The electric field magnitude distribution is simulated considering the specified setup. The result is represented as a field magnitude isosurface (isoline in the 2D views) whose value (i.e. threshold) can be selected from 50 V/cm to 2000 V/cm at 50 V/cm steps (Fig. 3 (b)). If multiple electrode pairs are specified, the resulting isosurface corresponds to the union of the isosurfaces computed for each electrode pair.
2.2. Implementation
2.2.1. Electric field simulation
The electric field is simulated using Elmer (https://www.csc.fi/web/elmer), an open access finite element method software for multiphysical problems, by solving the governing equations for electric currents
| (1) |
| (2) |
where, ϕ is the electric potential, σ is the electric conductivity and E is the electric field. Electric conductivity is known to increase during electroporation; non-linear models have been widely studied and they provide quite a good estimation of the electric field distribution [16–20,22,24–29]. We adopt the symmetric sigmoid function model used in Sel et al. [18]:
| (3) |
where |E| is the magnitude of the electric field, σ0 is the static conductivity (i.e. conductivity for field 0 V/cm), σf is the maximum conductivity that can be reached during the electroporation pulse, and A, B and C are the parameters that define the shape of the sigmoid. This sigmoid was fitted to ex vivo data for liver and pancreatic tissue found in [30] (Table 1).
Table 1.
Parameters for the non-linear electric conductivity on liver and pancreas.
| Tissue | σ0 (S/m) | σf (S/m) | A | B (V/cm) | C (V/cm) |
|---|---|---|---|---|---|
| Liver | 0.188 | 0.289 | 80.03 | 613.1 | 252.2 |
| Pancreas | 0.214 | 0.307 | 0.007 | 978.1 | 150.3 |
Due to the strong non-linear behavior of electric conductivity, the solution to Eq. (1) is obtained iteratively, with an initial electric conductivity σ0 = σ0. However, this is not sufficient for the algorithm to converge and would lead to oscillations. Thus, a relaxation mechanism is included to the update of the new electric potential:
| (4) |
where λ is the relaxation factor and will be the new approximation of the voltage, given the computed potential ϕk and the previous iteration potential. Convergence is reached when the L2 norm of change of both the electric potential and the electric field are smaller than 10−5. The relaxation factor for liver and pancreas has been set to λ = 0.875 and λ = 0.972, respectively, to boost convergence while avoiding oscillations.
The electric conductivity can also be manually defined by the user. For constant conductivities (i.e. σ0 = σf), the relaxation mechanism is not required. For non constant conductivities (i.e. σ0 < σf), C is the parameter which has the greatest influence on the non-linear behavior of the conductivity because it characterizes the sharpness of the transition from σ0 to σf (see Eq. (3)). Thus, a very non-linear case (C = 50 V/cm) has been used to determine the relaxation factor for user defined conductivities.
| (5) |
With these relaxation values we ensure convergence for all scenarios, although cases with a weaker non-linear nature are slightly penalized with extra iterations and, thus, computation time. Notice that a rise in conductivity above 3 and sharper transitions (C < 50 V/cm) are not expected in biological tissues. Therefore, these parameters have been limited at 4 and at 50 V/cm, respectively.
Prior to executing the FEM solver, a mesh is built with VTK [31] and CGAL (Computational Geometry Algorithms Library, https://www.cgal.org) according to the setup specified by the user. A 3D mesh containing up to six monopolar electrodes, or a single bipolar electrode, is generated with linear tetrahedra. We performed a mesh convergence study by initially simulating the electric field on a coarse mesh and then doubling the mesh density iteratively until the change in the solution was less than 1%. Only the active parts of the electrodes are considered. Monopolar electrode length can be set from 5 to 40 mm. With a bipolar electrode, the length of both exposed segments and the insulator in between can be set independently between 5 and 20 mm. Both electrode types have a diameter of 1 mm.
The electrodes are meshed in a spherical domain. The size of the outer sphere was determined by computing the same simulation on a domain 10 times larger and verified that the Dice score on the extracted isosurfaces was higher than 95%. The size is set according to the bounding box containing the electrodes:
| (6) |
| (7) |
where rsphere is the radius of the spherical domain, and dbb is the maximum size of the bounding cube containing all the electrodes, with dx, dy and dz as its three orthogonal sizes. However, the product 3dbb is limited to a minimum of 30 mm and a maximum of 120 mm, which allows to have enough space between electrodes and the boundary when using short electrodes, and limits the creation of meshes that are unnecessarily big when longer electrodes are used.
A constrained Delaunay triangulation is computed to generate the tetrahedral mesh [32]. An adaptive criteria is followed to define tetrahedron size, using a Weibull distribution to place finer elements around the electrodes and coarser ones near the outer boundary:
| (8) |
where r is the upper bound of the tetrahedron circumradius of the Delaunay triangulation, rmax and rmin are the maximum and minimum radii, respectively, λ is the scale parameter, k is the shape parameter, and Δx is the distance between a point in the mesh and the closest electrode. The minimum and maximum circumradii are set to 1 mm and 15 mm, respectively, to allow fine elements in the regions of interest and coarser ones near the outer boundary. The shape and scale parameters, λ = 50 mm and k = 2, are established to keep a high density of tetrahedra near the electrodes and to provide a good transition towards the end of the boundary. Using this approach, the mesh contains around 80k–220k tetrahedra depending on the quantity of electrodes, their position, and the length of exposure.
A simulation is computed for every electrode pair with the specified voltage. The outer boundary of the mesh is set as insulating. In multiple pair scenarios (more than two electrodes), the inactivated electrodes are modeled with a floating potential boundary condition, which is that the boundary has an unknown constant potential but the net current through it is zero, defined by
| (9) |
where n is the normal vector, J is the current, and it is integrated over the boundary surface dS. This boundary condition is solved in Elmer using the virtual homogeneous boundary condition method [33]. It is implemented on the discrete level (i.e. directly on the matrix). Let us define the problem Ax = b, with x = ϕF (unknown floating potential) at the boundary ΩF nodes. First, identify all the nodes i in ΩF. Second, choose a representative node j from ΩF. Third, sum up all the rows i to row j. This step can be motivated if we think that the basis function is composite of all nodes (with the same unknown potential). Fourth, all the rows i are replaced with identity (i.e. aii = 1) and aij is set to −1, thus xi = xj = ϕF.
Once all the simulations have been computed, electric field isosurfaces are extracted from 50 to 2000 V/cm in 50 V/cm steps. If more than one electrode pair is simulated, the isosurfaces are obtained by computing the union between simulations.
2.2.2. Framework
The platform has been designed as a client-server application. On one hand, the client contains the tools needed for creating the electrode configuration and to render the electric field distribution. On the other hand, the simulation is executed on the server. By using this approach, the most computationally expensive task is left to the server, freeing the client from a computational burden.
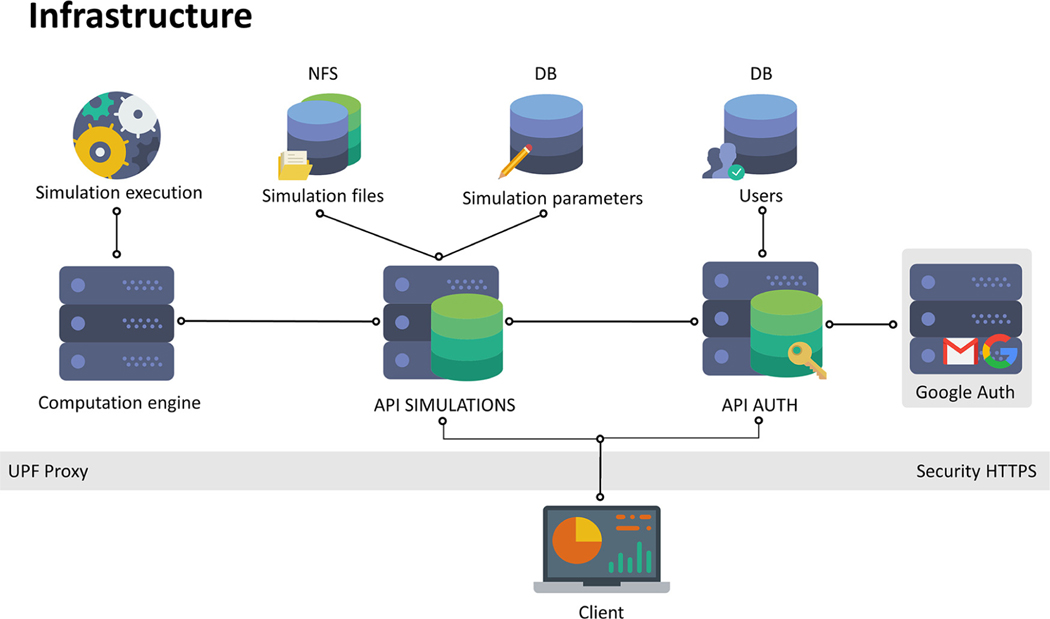
Fig. 4 depicts the framework contained in the server. It contains two application programming interfaces (API) for communication between the client and the server, a database (DB), a network file system (NFS), and a computation engine. The client can only communicate via HTTPS to the APIs: API AUTH and API SIMULATIONS. The former is used for user registration (sign up) and login. The latter receives the electrode setup parameters from the client, interacts with the server to store the parameters in the DB and executes the simulation in the computation engine. The result of the simulation is stored in the NFS. API SIMULATIONS also notifies the client when a simulation is finished, and the simulation is downloaded from the NFS into the client.
Fig. 4.
Framework diagram of EView. The client communicates to the server via HTTPS to two APIs, AUTH for authentication of the user (sign up and log in), and SIMULATIONS to execute a simulation on the server. A DB stores electrode configuration and the NFS stores the simulation output. The simulation is executed in a computation engine.
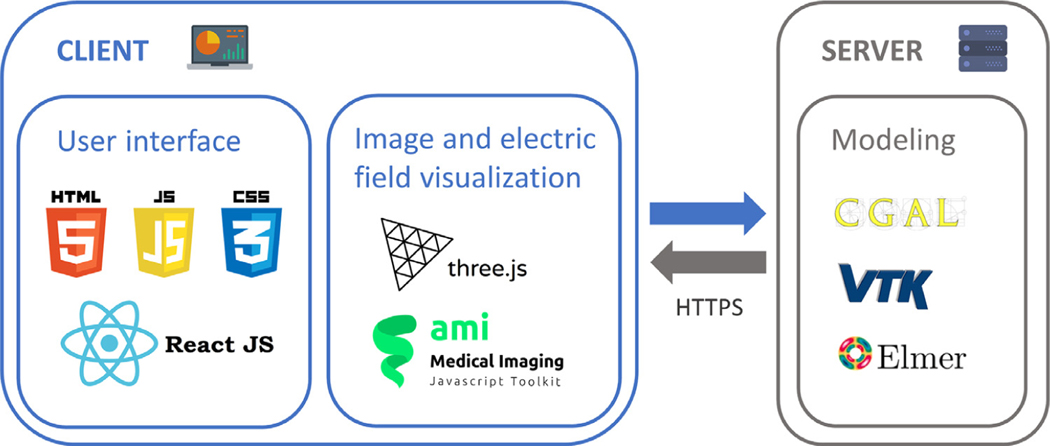
Only open access software has been used for the development of EView. Fig. 5 shows all the technologies used for the client and for the server. The web (i.e. client) has been developed with html, css and Javascript. Additionally, React (https://reactjs.org) was used as the main graphical interface framework. Three.js (https://threejs.org) is a 3D library and ami.js (AMI, Medical Imaging Javascript Toolkit, https://github.com/FNNDSC/ami) is a toolkit for medical image web rendering based on Three.js. Both were used for the visualization of images and the rendering of the electric field. The electric field distribution is computed in the server using Elmer. The mesh is created using VTK and CGAL.
Fig. 5.
Technological stack diagram used in the development of the client (electrode and tissue setup) and the server (modeling).
2.3. Validation
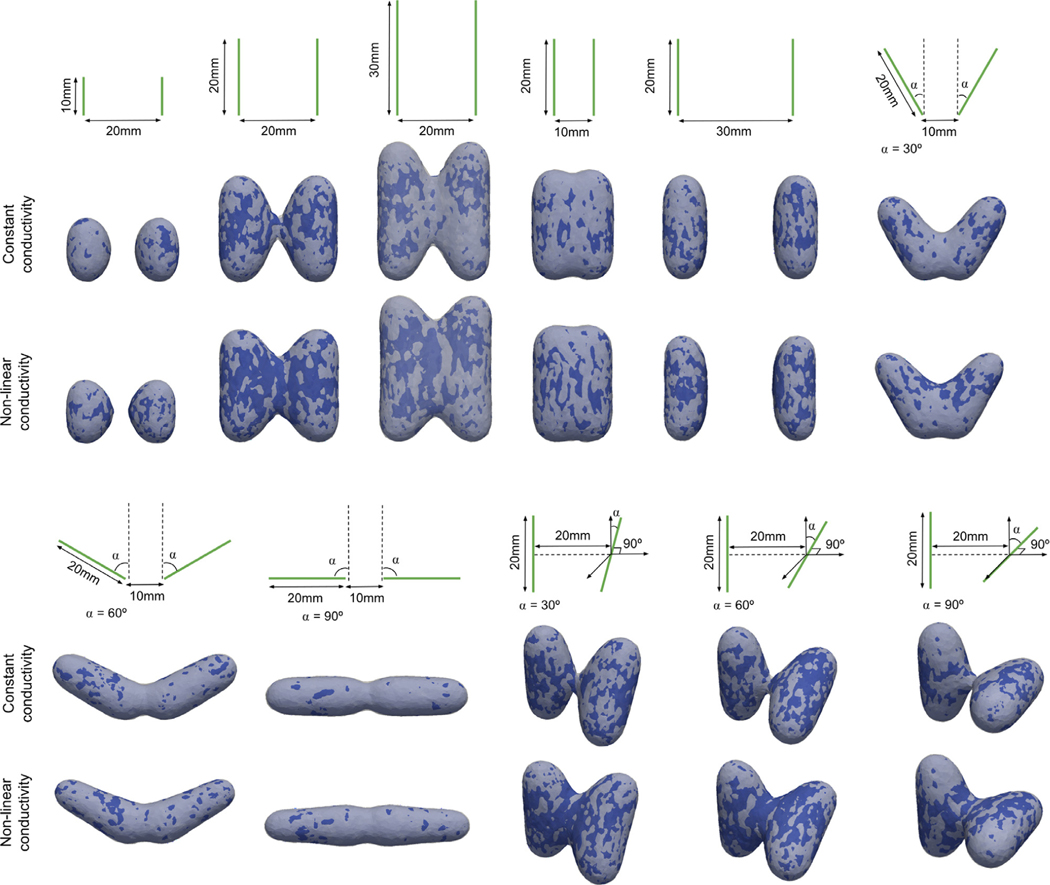
To validate the accuracy of our implementation for multiple setups, we compared the electric field obtained with EView to the one computed with COMSOL Multiphysics, a generic FEM software platform frequently used in treatment planning of electroporation-based treatments [19–21]. Eleven different configurations using two electrodes with variable lengths, separation and angles (Fig. 6) were analyzed using constant (σ = 0.1 S/m) and non-linear (σ0 = 0.1 S/m, σf = 0.3 S/m, A = 100, B = 100 V/cm, C = 50 V/cm) electric conductivities, computing a total of 22 simulations. A voltage of 3 kV was applied in all the cases. We extracted electric field isosurfaces at 700 V/cm and compared both implementations by computing the Dice coefficient, Jaccard index and volume similarity coefficient (VS).
| (9) |
| (11) |
| (12) |
where X and Y are the volume contained inside each surface.
Fig. 6.
Schematic representation of the eleven different configurations used in the validation process.
In order to evaluate workflow performance, a stress test was conducted, requesting the server to run a new simulation every minute for over 18 h, which were also used to analyze and report simulation time. Each simulation was configured randomly with constraints to mimic plausible scenarios. The following criteria was used:
Electrodes: between 2 and 6, with lengths from 5 to 40 mm and placed in a sphere with a radius of 30 mm.
Pairs: between N − 1 and N (N − 1)/2 protocols (N being the number of electrodes), with voltages from 1000 to 3000 V.
Tissue: σ0 from 0.01 to 0.6 S/m and σf between σ0 and 3σ0. A between 10 and 1000 and B and C from 10 to 1000 V/cm.
3. Results and discussion
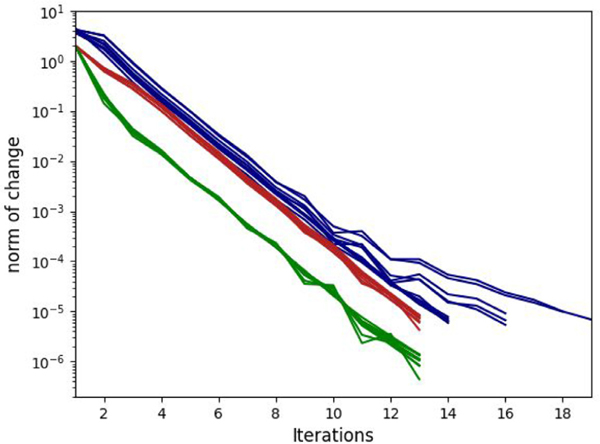
We compared the electric field obtained with EView to the one computed with COMSOL. With eleven different configurations with constant and non-linear electric conductivities, we obtained a Dice coefficient, Jaccard index and VS of 98.3 ± 0.4%, 96.7 ± 0.7%, and 99.0 ± 0.6%, respectively. These results show that the two implementations yield the same results. The small differences arise from different meshing methods and slightly different solver convergence criteria. In addition, the graphic representation of the results (Fig. 7) clearly illustrates the importance of including the non-linear behavior of electric conductivity. In all cases it can be observed that the electric field between the electrodes is higher with the non-linear model. Additionally, Fig. 8 shows a smooth convergence of the non-linear problem for all 11 cases, and that the proposed stopping criterion for both the electric potential and the electric field is necessary because they do not converge at the same iteration (green and red lines). The proposed iterative method (Eq. (4)), prevents the appearance of oscillations and proves to be consistent even for the most non-linear cases (C = 50 V/cm).
Fig. 7.
Configurations of the electrodes used for comparing the results provided by EView and those provided by COMSOL. Each configuration is represented schematically, and the simulation is shown under each scheme. An isosurface at 700 V/cm is represented (EView in white and COMSOL in blue).
Fig. 8.
Convergence (L2-norm) of the non-linear system for all 11 configurations for EView (green is the electric potential and red is the electric field) and COMSOL (blue).
The resulting isosurface for multiple electrode pairs corresponds to the union of the isosurfaces computed for each pair. The union is an approximation of the treated volume, as each electrode will experience a different pulse sequence depending on the generator, and the electric field distribution can be also affected due to Joule heating.
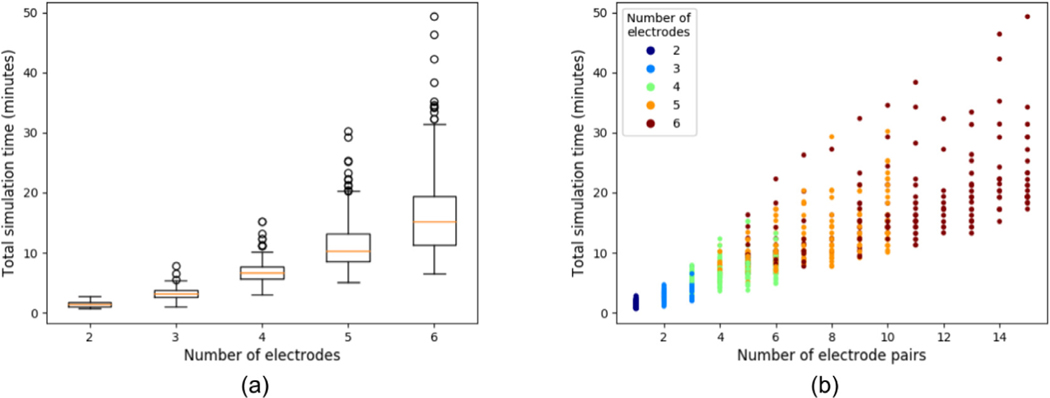
A stress test was conducted to evaluate workflow performance. A total of 1092 simulations were executed over 18 h, with only 6 simulations (0.5%) failing (due to server overload). However, load prediction for normal circumstances is expected to be much lower than during the performed test. Thus, we do not expect server overload during normal use. The remaining 1086 simulations were used to analyze simulation time. From Fig. 9 (a) it is observed that the median time and the variability increase with the number of electrodes. This is an obvious consequence of the fact that more electrodes allow more pairs. It is explained considering that for N electrodes, the minimum number of pairs is N − 1 and the maximum is N (N − 1)/2 (e.g. three electrodes can have between 2 and 3 pairs, whereas six electrodes can have between 5 and 15 pairs). From Fig. 9 (b), a large dispersion in computation times for any electrode pair number is observed. We mentioned earlier that the mesh is built adaptively, with the finest elements around the electrodes. Therefore, more electrodes and longer exposures require more elements in the mesh, leading to a more expensive computation.
Fig. 9.
(a) is a boxplot of the total simulation time as a function of the number of electrodes and (b) shows the total execution time as a function of quantity of electrode pairs, and colored according to the number of electrodes.
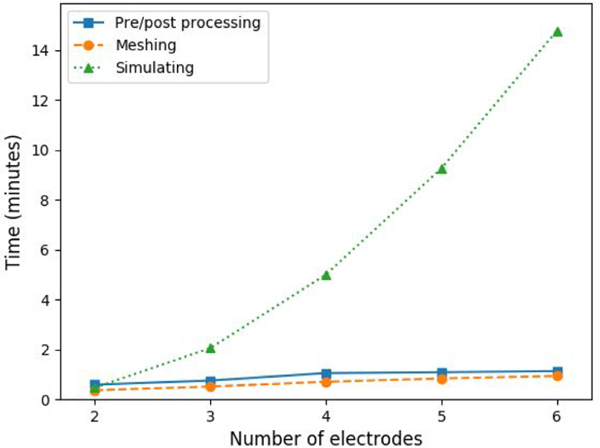
The overall simulation process (i.e. since the user sends the simulation to the server until the result files are stored in the NFS) can be divided in three parts: meshing, simulating and pre/post-processing tasks. One one hand, pre/post-processing takes an average of 0.59 min with 2 electrodes and rises linearly up to 1.13 min with 6 electrodes, and meshing rises similarly from 0.37 min on 2 electrodes to 0.93 min on 6 electrodes. On the other hand, simulation follows an exponential fashion, with an average of 0.47 min on 2 electrodes up to 14.78 min on 6 electrodes. From Fig. 10 it is observed that on low number of electrodes (2 and 3), pre/post processing and meshing occupy around half of the total time, but using more electrodes (hence requiring more pairs) increases the overall weight of the simulation, up to an 85% with 6 electrodes.
Fig. 10.
Average computation time of the different steps of the simulation pipeline, pre/post processing, meshing and simulating as a function of the number of electrodes.
Although the computation times to obtain the electric field for two electrodes (around 2 min) are acceptable, it is clear that with four or more electrodes the waiting time increases (more than 5 min). Current hardware and FEM software are capable of multithreaded and even GPU computation. At present, EView does not take advantage of parallel processing yet and the whole workflow is executed sequentially on a single thread.
To prioritize a user friendly system that rapidly computes an estimation of the electric field, the mesh in EView is generated with linear tetrahedra. Although to model non-linear problems, such as conductivity changes due to electroporation, quadratic elements should be preferred, we verified that the error is minimal. When comparing the results of both methods, we obtained an average Dice coefficient of 97.4 ± 1.5% for all the extracted isosurfaces, with a minimum value of 94.8%. This error is negligible if we consider that EView scope is to provide an initial estimate. In contrast, the computation time was heavily penalized when using quadratic elements; the simplest cases took more than five minutes and the longest more than two hours.
EView computes the electric field given some arbitrarily positioned electrodes and non-linear tissue properties on a homogeneous 3D domain. Moreover, the electrodes can be positioned according to anatomical landmarks of a loaded medical image. This image is only used for visualization purposes and is not considered during the simulation. Although this is an improvement over the educational tool [23], it does not evaluate the effect of the presence of tissues with different conductivities (e.g. tumor, healthy organ, vessels) that is known to be the cause of failure in some IRE treatments [34]. However, the goal of EView is to provide a good initial estimate of the electric field distribution, and multiple tissue scenarios, which require of accurate image segmentation, are out of the current scope. We plan, however, to provide a dual domain model (e.g. organ and tumor) in future releases.
Lately, IRE is being investigated as a promising cardiac ablation procedure [35–37]. However, with EView it is not possible to model cardiac IRE scenarios because a reliable simulation should at least consider myocardium and blood due to the high difference in conductivities. Nonetheless, with the inclusion of dual tissue modeling on future releases, we will analyze the feasibility of adapting EView to cardiac ablation.
4. Conclusion
We have developed a web-based platform with the aim of illustrating the dependence of the electric field distribution on the geometry of the electrode configuration and the applied voltage in a given tissue. Currently available platforms for simulating the electric field in electroporation-based therapies either require much more sophisticated models, both computationally and in terms of the required user expertise (e.g. patient specific planning), or they provide approximate results based on too simplistic models. With EView we provide the end user with a simple electroporation simulation workflow that is powerful enough to analyze complex geometries. We intentionally excluded the possibility of modeling heterogeneous tissues because that requires image segmentation and a more complex meshing process, both of which require expert user interaction and validation.
The approach of implementing EView as a web-server platform allows expert and non-expert electroporation users to rapidly obtain the electric field distribution in a computationally inexpensive manner. The implemented model has been validated against similar software. Execution times and server reliability have been reported, ensuring that the end user can obtain the electric field distribution in just 2 min (in the most simple cases).
Future versions of the platform will include a wider list of pre specified tissues, as well as typical electrode configurations in clinical practice. Because, IRE produces considerable heat due to the Joule effect, tissue conductivity rises and leads to a slight increase of the treatment volume. We are planning on computing this margin and displaying it alongside the threshold isosurface. The possibility of including a two domain scenario (e.g. organ and tumor) to form a heterogeneous model will be explored. However, let us remark that this is supposed to be a platform with a straightforward workflow. Thus, simplicity will be prioritized. In addition, parallel computation will be assessed to reduce computation time.
Acknowledgments
EView has been developed in Universitat Pompeu Fabra, Barcelona, Spain, in collaboration with VirginiaTech, VA, USA.
This work was supported by the Ministry of Economy and Competitiveness of Spain (grant number TEC2014-52383-C3-2-R), the María de Maeztu Units of Excellence Programme (grant number MDM-2015-0502) and by the Spanish Ministry of Economy and Competitiveness under the Programme for the Formation of Doctors (grant number BES-2017-081164). Antoni Ivorra gratefully acknowledges the financial support by ICREA under the ICREA Academia program.
Virginia Tech would like to acknowledge the Cures Within Reach foundation for their support of this work. Dr. Davalos would like to acknowledge the National Institutes of Health (grant number R01CA213423).
We would like to acknowledge the development team of Elmer for providing very fast support and useful information about implementation details.
The icons used in Figs. 1, 4 and 5 are made by Smashicons from www.flaticon.com.
Declaration of Competing Interest
Dr. Davalos has patents in the area of electroporation and may receive royalties. He is also a co-founder of a startup company developing electroporation-based therapies for neurological disorders. Natalie Beitel-White has a pending patent in electroporation and may receive royalties.
Footnotes
Disclaimer
EView is not intended for clinical treatment planning. It must only be used for research or educational purposes (or similar informative uses), and not for clinical use.
References
- [1].Weaver JC, Chizmadzhev YA, Theory of electroporation: a review, Bioelectrochem. Bioenerg 41 (2) (1996) 135–160. [Google Scholar]
- [2].Miklavcic D, Semrov D, Mekid H, Mir LM, In vivo electroporation threshold determination, in: Proceedings of the Annual International Conference of the IEEE Engineering in Medicine and Biology, 4, 2000, p. 28151.–2818. [Google Scholar]
- [3].Mir LM, Glass LF, Sersa G, Teissié J, Domenge C, Miklavcic D, Jaroszeski MJ, Orlowski S, Reintgen DS, Rudolf Z, Belehradek M, Gilbert R, Rols MP, Belehradek J, Bachaud JM, DeConti R, Stabuc B, Cemazar M, Coninx P, Heller R, Effective treatment of cutaneous and subcutaneous malignant tumours by electrochemotherapy, Br. J. Cancer 77 (12) (1998) 2336–2342. [DOI] [PMC free article] [PubMed] [Google Scholar]
- [4].Sersa G, Miklavcic D, Cemazar M, Rudolf Z, Pucihar G, Snoj M, Electrochemotherapy in treatment of tumours, Eur. J. Surg. Oncol 34 (2) (2008) 232–240. [DOI] [PubMed] [Google Scholar]
- [5].Davalos RV, Mir LM, Rubinsky B, Tissue ablation with irreversible electroporation, Ann. Biomed. Eng 33 (2) (2005) 223–231. [DOI] [PubMed] [Google Scholar]
- [6].Rubinsky B, Irreversible electroporation in medicine, Technol. Cancer Res. Treat 6 (4) (2007) 255–259. [DOI] [PubMed] [Google Scholar]
- [7].Malicki J, The importance of accurate treatment planning, delivery, and dose verification, Rep. Pract. Oncol. Radiother 14 (2012) 63–65. [DOI] [PMC free article] [PubMed] [Google Scholar]
- [8].Zhang L, Hub M, Mang S, Thieke C, Nix O, Karger CP, Floca RO, Software for quantitative analysis of radiotherapy: overview, requirement analysis and design solutions, Comput. Methods Programs Biomed 110 (3) (2013) 528–537. [DOI] [PubMed] [Google Scholar]
- [9].Thorwarth D, Geets X, Paiusco M, Physical radiotherapy treatment planning based on functional PET/CT data, Radiother. Oncol 96 (3) (2010) 317–324. [DOI] [PubMed] [Google Scholar]
- [10].Ren H, Campos-Nanez E, Yaniv Z, Banovac F, Abeledo H, Hata N, Cleary K, Treatment planning and image guidance for radiofrequency ablation of large tumors, IEEE J. Biomed. Health Inform 18 (3) (2014) 920–928. [DOI] [PMC free article] [PubMed] [Google Scholar]
- [11].Jin C, He Z, Liu J, MRI-based finite element simulation on radiofrequency ablation of thyroid cancer, Comput. Methods Programs Biomed 113 (2) (2014) 529–538. [DOI] [PubMed] [Google Scholar]
- [12].Beyer LP, Wiggermann P, Treatment planning, needle insertion, image guidance, and endpoint assessment, in: Irreversible Electroporation in Clinical Practice, Springer International Publishing, 2018, pp. 115–120. [Google Scholar]
- [13].Zupanic A, Kos B, Miklavcic D, Treatment planning of electroporation-based medical interventions: electrochemotherapy, gene electrotransfer and irreversible electroporation, Phys. Med. Biol 57 (17) (2012) 5425–5440. [DOI] [PubMed] [Google Scholar]
- [14].Edd JF, Davalos RV, Mathematical modeling of irreversible electroporation for treatment planning, Technol. Cancer Res. Treat 6 (4) (2007) 275–286. [DOI] [PubMed] [Google Scholar]
- [15].Polak A, Bonhenry D, Dehez F, Kramar P, Miklavčič D, Tarek M, On the electroporation thresholds of lipid bilayers: molecular dynamics simulation investigations, J. Membr. Biol 246 (11) (2013) 843–850. [DOI] [PubMed] [Google Scholar]
- [16].Ivorra A, Mir LM, Rubinsky B, Electric field redistribution due to conductivity changes during tissue electroporation: experiments with a simple vegetal model, IFMBE Proc. 25 (13) (2009) 29–62. [Google Scholar]
- [17].Cima LF, Mir LM, Macroscopic characterization of cell electroporation in biological tissue based on electrical measurements, Appl. Phys. Lett 85 (19) (2004) 4520–4522. [Google Scholar]
- [18].Šel D, Cukjati D, Batiuskaite D, Slivnik T, Mir LM, Miklavčič D, Sequential finite element model of tissue electropermeabilization, IEEE Trans. Biomed. Eng 52 (5) (2005) 816–827. [DOI] [PubMed] [Google Scholar]
- [19].Garcia PA, Davalos RV, Miklavcic D, A numerical investigation of the electric and thermal cell kill distributions in electroporation-based therapies in tissue, PLoS One 9 (8) (2014) e103083. [DOI] [PMC free article] [PubMed] [Google Scholar]
- [20].Garcia PA, Rossmeisl JH, Neal RE, Ellis TL, Davalos RV, A parametric study delineating irreversible electroporation from thermal damage based on a minimally invasive intracranial procedure, Biomed. Eng. Online 10 (1) (2011) 34. [DOI] [PMC free article] [PubMed] [Google Scholar]
- [21].Wimmer T, Srimathveeravalli G, Gutta N, Ezell PC, Monette S, Kingham TP, Maybody M, Durack JC, Fong Y, Solomon SB, Comparison of simulation-based treatment planning with imaging and pathology outcomes for percutaneous ct-guided irreversible electroporation of the porcine pancreas: a pilot study, J. Vasc. Interv. Radiol 24 (11) (2013) 1709–1718. [DOI] [PubMed] [Google Scholar]
- [22].Gallinato O, de Senneville BD, Seror O, Poignard C, Numerical workflow of irreversible electroporation for deep-seated tumor, Phys. Med. Biol 64 (5) (2019) 055016. [DOI] [PubMed] [Google Scholar]
- [23].Mahnič-Kalamiza S, Kotnik T, Miklavčič D, Educational application for visualization and analysis of electric field strength in multiple electrode electroporation, BMC Med. Educ 12 (1) (2012) 102. [DOI] [PMC free article] [PubMed] [Google Scholar]
- [24].Marčan M, Pavliha D, Kos B, Forjanič T, Miklavčič D, Web-based tool for visualization of electric field distribution in deep-seated body structures and planning of electroporation-based treatments, Biomed. Eng. Online 14 (S3) (2015) S4. [DOI] [PMC free article] [PubMed] [Google Scholar]
- [25].Pavliha D, Kos B, Marčan M, Županič A, Serša G, Miklavčič D, Planning of electroporation-based treatments using web-based treatment-planning software, J. Membr. Biol 246 (11) (2013) 833–842. [DOI] [PubMed] [Google Scholar]
- [26].Kos B, Voigt P, Miklavčič D, Moche M, Careful treatment planning enables safe ablation of liver tumors adjacent to major blood vessels by percutaneous irreversible electroporation (IRE), Radiol. Oncol 49 (3) (2015) 234–241. [DOI] [PMC free article] [PubMed] [Google Scholar]
- [27].Garcia PA, Kos B, Rossmeisl JH, Pavliha D, Miklavčič D, Davalos RV, Predictive therapeutic planning for irreversible electroporation treatment of spontaneous malignant glioma, Med. Phys 44 (9) (2017) 4968–4980. [DOI] [PubMed] [Google Scholar]
- [28].Latouche EL, Sano MB, Lorenzo MF, Davalos RV, Martin RCG, Irreversible electroporation for the ablation of pancreatic malignancies: a patient-specific methodology, J. Surg. Oncol 115 (6) (2017) 711–717. [DOI] [PubMed] [Google Scholar]
- [29].Neal RE, Garcia PA, Robertson JL, Davalos RV, Experimental characterization and numerical modeling of tissue electrical conductivity during pulsed electric fields for irreversible electroporation treatment planning, IEEE Trans. Biomed. Eng 59 (4) (2012) 1076–1085. [DOI] [PubMed] [Google Scholar]
- [30].Beitel-White N, Bhonsle S, Martin RCG, Davalos RV, Electrical characterization of human biological tissue for irreversible electroporation treatments, in: Proceedings of the Annual International Conference of the IEEE Engineering in Medicine and Biology Society, EMBS, 2018, pp. 4170–4173. [DOI] [PubMed] [Google Scholar]
- [31].Schroeder W, Martin K, Lorensen B, The Visualization Toolkit, 4th ed., 2006. Kitware, ISBN 978-1-930934-19-1. [Google Scholar]
- [32].Chew LP, Constrained delaunay triangulations, Algorithmica 4 (1) (1989) 97–108. [Google Scholar]
- [33].Dong W, Jiangjun R, Zhiye D, Shoubao L, Yujiao Z, Parallel numerical computing of finite element model of conductors and floating potentials, in: Proceedings of International Symposium on Parallel and Distributed Processing with Applications, ISPA, 2010, pp. 57–61. [Google Scholar]
- [34].Gallinato O, De Senneville BD, Seror O, Poignard C, Numerical modelling challenges for clinical electroporation ablation technique of liver tumors, Math. Model. Nat. Phenom 15 (2020) 11. [Google Scholar]
- [35].Sugrue A, Maor E, Ivorra A, Vaidya V, Witt C, Kapa S, Asirvatham SJ, Irreversible electroporation for the treatment of cardiac arrhythmias, Exp. Rev. Cardiovasc. Ther 16 (5) (2018) 349–360. [DOI] [PubMed] [Google Scholar]
- [36].Sugrue A, Vaidya V, Witt C, DeSimone CV, Yasin O, Maor E, Killu AM, Kapa S, McLeod CJ, Miklavčič D, Asirvatham SJ, Irreversible electroporation for catheter-based cardiac ablation: a systematic review of the preclinical experience, J. Interv. Card. Electrophysiol 55 (2019) 251–265. [DOI] [PubMed] [Google Scholar]
- [37].van Es R, Konings MK, Du Pré BC, Neven K, van Wessel H, van Driel VJHM, Westra AH, Doevendans PAF, Wittkampf FHM, High-frequency irreversible electroporation for cardiac ablation using an asymmetrical waveform, BioMed. Eng. OnLine 18 (2019) 75. [DOI] [PMC free article] [PubMed] [Google Scholar]


