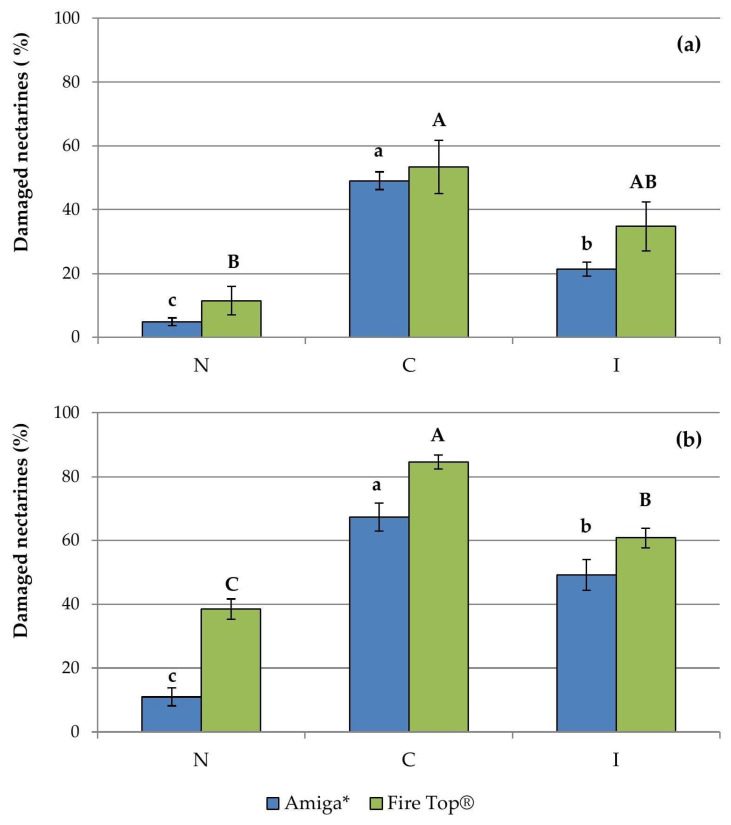
Figure 2.
Percentages of nectarines damaged by Halyomorpha halys (mean ± SE) on fruits sampled at harvest in 2016 (a) and in 2017 (b) (no. = 1140 fruits per treatment per year) (N = netted plots, C = un-netted control plots, I = un-netted plots treated with insecticides). For each cultivar, histograms with different letters are significantly different by the GLMM analysis (Bonferroni correction, p < 0.05).

