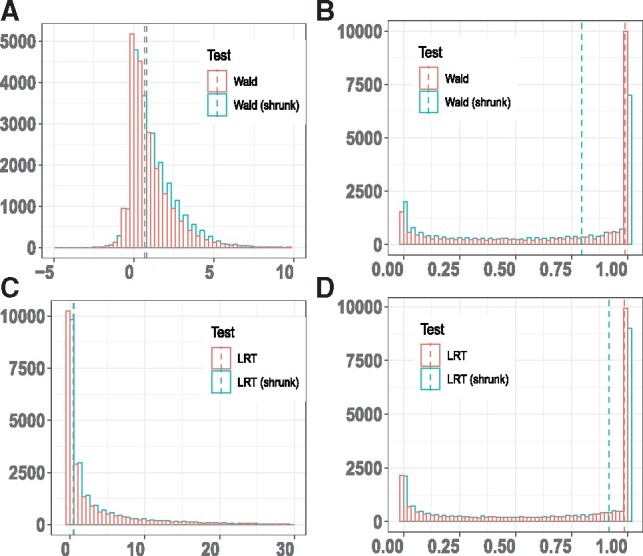
Fig. 4.

Differential expressed circRNA analysis between frontal cortex and cerebellum. (A, B) Comparison of statistics distribution and FDR distribution between Wald test versus Wald test (shrunk); (C, D) Comparison of statistics distribution and FDR distribution between LRT versus LRT (shrunk). The median of test statistics or FDR is indicated by a dashed vertical line
