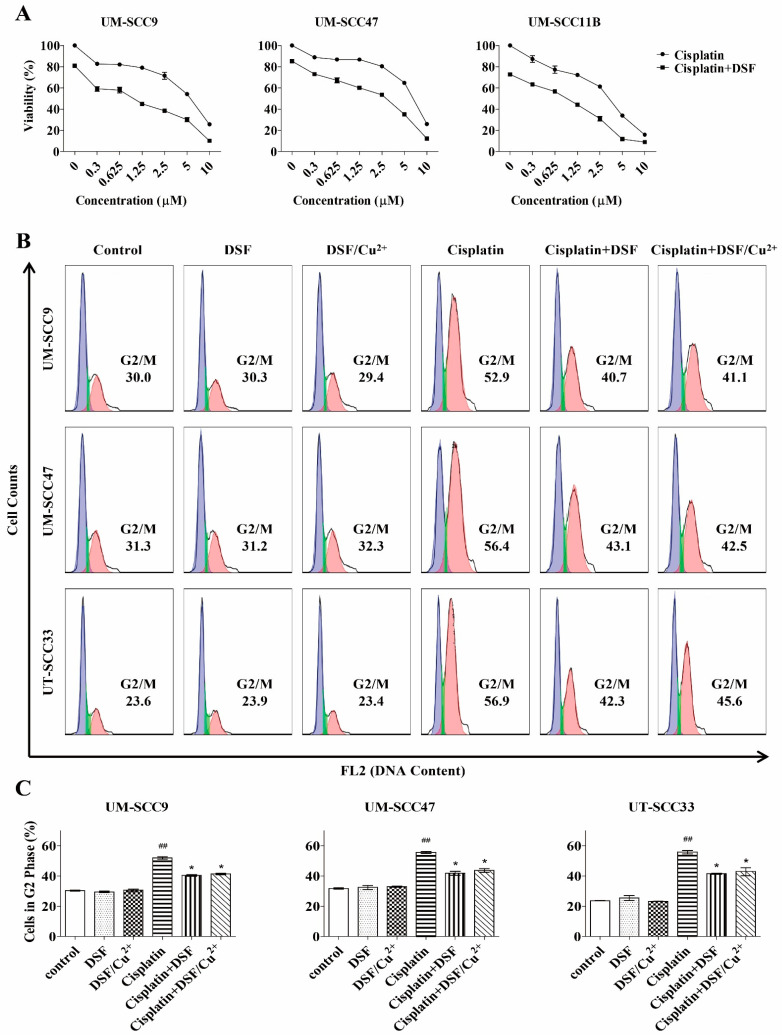
Figure 2.
Combination treatment with DSF or DSF/Cu2+ and cisplatin. (A) Cells were exposed to different concentrations of cisplatin with DSF (5 µM) for 72 h, and the cytotoxicity was measured by the MTT assay, n = 3. (B) Cells were exposed to DSF (5 µM), DSF/Cu2+ (0.1 µM), cisplatin (UM-SCC9 and UM-SCC47: 0.3 µM and UT-SCC33: 0.6 µM), or a combination of both for 48 h. (C) The percentage distribution of cells in the G2/M phase is compared. ## p < 0.01: cisplatin vs. control and * p < 0.05: cisplatin vs. cisplatin + DSF or cisplatin + DSF/Cu2+, n = 2, one-way ANOVA.

