Abstract
We validated 3 distinct hiPSC-CM cell lines—each of different purity and a voltage sensitive dye (VSD)-based high-throughput proarrhythmia screening assay as a noncore site in the recently completed CiPA Myocyte Phase II Validation Study. Blinded validation was performed using 12 drugs linked to low, intermediate, or high risk for causing Torsades de Pointes (TdP). Commercially sourced hiPSC-CMs were obtained either from Cellular Dynamics International (CDI, Madison, Wisconsin, iCell Cardiomyoyctes2) or Takara Bio (CLS, Cellartis Cardiomyocytes). A third hiPSC-CM cell line (MCH, Michigan) was generated in house. Each cell type had distinct baseline electrophysiological function (spontaneous beat rate, action potential duration, and conduction velocity) and drug responsiveness. Use of VSD and optical mapping enabled the detection of conduction slowing of sodium channel blockers (quinidine, disopyramide, and mexiletine) and drug-induced TdP-like activation patterns (rotors) for some high- and intermediate-risk compounds. Low-risk compounds did not induce rotors in any cell type tested. These results further validate the utility of hiPSC-CMs for predictive proarrhythmia screening and the utility of VSD technology to detect drug-induced APD prolongation, arrhythmias (rotors), and conduction slowing. Importantly, results indicate that different ratios of cardiomyocytes and noncardiomyocytes have important impact on drug response that may be considered during risk assessment of new drugs. Finally, we present the first blinded CiPA hiPSC-CM validation results to simultaneously detect drug-induced conduction slowing, action potential duration prolongation, action potential triangulation, and drug-induced rotors in a proarrhythmia assay.
Keywords: comprehensive in vitro proarrhythmia assay, cardiotoxicity, cardiomyocytes, toxicology, TdP, induced pluripotent stem cells
Drug attrition due to cardiotoxicity and proarrhythmia is a major problem for drug discovery and the pharmaceutical industry (Stockbridge et al., 2013). Current regulatory guidelines of the International Council on Harmonisation (ICH) assess the risk of a drug to cause a rare but fatal arrhythmia (Torsades de Pointes, TdP) include testing a drug’s ability to block the human ether-a-go-go potassium channel (hERG) in vitro. The commonly utilized hERG in vitro assay has been effective to prevent the release of new drugs with TdP risk into the market (Gintant, 2008). However, the hERG assay is a surrogate indicator for TdP and lacks specificity because not every drug that blocks the hERG ion channel also carries a risk for fatal TdP arrhythmias (Gintant, 2008). The hERG assay utilizes heterologous cells (not contractile cardiomyocytes) that are genetically engineered to over express the hERG ion channel. This simplistic model system does not represent the complex physiological and electrophysiological mechanisms at play in human cardiomyocytes. The human cardiac action potential is shaped by the coordinated activity of many ion channels that balance each other to produce efficient electrical activation of the heart. In the case of some drugs, hERG ion channel blocking effects may be counterbalanced by concomitant actions on other ion channels that actually confer low risk for development of fatal TdP. An example of this type of drug is the antidepressant fluoxetine (Prozac), which is a potent hERG ion channel blocker in vitro, but carries little to no risk to cause TdP in patients. Fluoxetine was developed and used clinically prior to implementation of the hERG assay. In the current regulatory climate, fluoxetine would be discontinued from development because of its potent hERG ion channel blocking features in vitro and this would have resulted in missed opportunities for Pharma and patients. In a move to improve the accuracy of preclinical cardiotoxicity screening new assays utilizing human cardiac myocytes isolated from human hearts or derived from pluripotent stem cells are actively being validated and are proving to be predictive of adverse drug exposure outcomes (Blinova et al., 2017, 2018; Nguyen et al., 2017).
The apparent limitations of the current preclinical testing assays have resulted in the development and validation of a new regulatory paradigm referred to as the Comprehensive In Vitro Proarrhythmia Assay (CiPA). The goal of CiPA is to improve the specificity of preclinical proarrhythmia screening (Fermini et al., 2016). CiPA will include assessment of drug effects in human-induced pluripotent stem cell-derived cardiomyocytes (hiPSC-CMs) to determine any electrophysiological effects missed in other in vitro or in silico screening assays (Colatsky et al., 2016; Gintant et al., 2016, 2017). hiPSC-CMs express the myriad of currents that make up the cardiac action potential and have the added benefit of being contractile, human cardiomyocytes (da Rocha et al., 2017; Herron et al., 2016). The use of hiPSC-CMs in the drug discovery space for derisking candidate drugs for proarrhythmia and cardiotoxicity is continuously gaining ground (Authier et al., 2017; Sharma et al., 2017).
The FDA recently reported the results of an international multisite blinded validation study of hiPSC-CMs for drug-induced proarrhythmia risk assessment (Blinova et al., 2018). Validation results indicate that hiPSC-CMs have very good predictive power for preclinical proarrhythmia risk assessment. The validation study included core sites and noncore sites and assays were performed using 2 commercially available iPSC-CM cell lines interrogated using either multielectrode array (MEA) technology or voltage sensitive dye (VSD) technology. However, the results published in the 2018 FDA report (Blinova et al., 2018) included only core site data which primarily utilized MEA technology for electrophysiological measurements (9 sites), whereas data collected using VSD was only included from a single (1 site) site. The previous validation also only included the use of highly purified hiPSC-CMs and did not include quantification or inclusion of action potential conduction velocity (CV) changes as a parameter for assessing a compounds risk.
We participated in the blinded CiPA myocyte phase II validation study as a noncore site using VSD technology for electrophysiology measurements. Here we validated 3 distinct hiPSC-CM cell lines (2 commercial sources and 1 in house generated cell line). Our VSD assay platform is unique in that we utilize a high speed CCD camera to enable quantification of action potential propagation velocity and visualization of activation patterns. Also, our assay utilized hiPSC-CM cultured over soft substrate that has maturation effects and yields action potential amplitudes of approximately 120 mV, dV/dt max of approximately 150 V/s, increase in sodium and potassium currents, and decreases cardiomyocytes response to hERG channel blocking, which indicates a significant participation of other potassium currents in cardiomyocytes repolarization, similar to those present in mature cardiomyocytes; additionally, syncytial hiPSCM monolayers cultured with this method show rapid impulse CV as recently described (da Rocha et al., 2017; Herron et al., 2016). We screened a total of 12 CiPA validation compounds, 4 from each risk category—low, intermediate, or high for TdP risk based on clinical data (Fermini et al., 2016). The objective of our study was to determine if VSD technology in our 96-well plates of mature hiPSC-CMs can detect drug-induced TdP-like activation patterns and conduction slowing, endpoints not reported in the recent validation report from the FDA (Blinova et al., 2018) and determine how these parameter can be used to compose proarrhythmia risk assessment models.
MATERIALS AND METHODS
hiPSC-CMs and functionally mature syncytial monolayer plating procedure
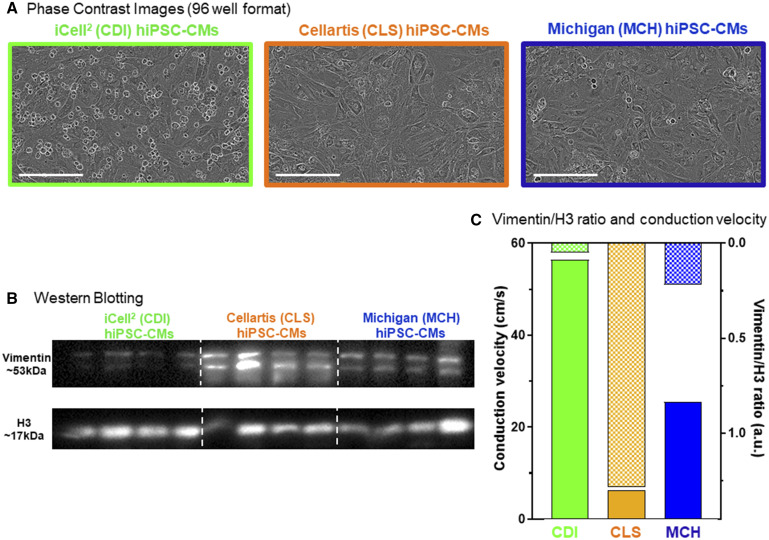
A total of 3 distinct hiPSC-CM cell lines were used in this validation study. Two commercially available hiPSC-CM cell lines were used: iCell2 (Cellular Dynamics International, CDI) and Cellartis (Cellartis Cardiomyocytes, Takara Bio, CLS). The CDI iCell2 cardiomyocytes arrived cryopreserved and are genetically purified to approximately 98% cTnT+ cells (da Rocha et al., 2017; Lee et al., 2012; Ma et al., 2011). The CLS cardiomyocytes are not purified and contain approximately 80% cTnT+ cells. One in house generated hiPSC-CM cell line was also used: MCH-made in Michigan. The MCH cardiomyocytes were generated from BJ-iPSCs (Bizy et al., 2013) using the highly efficient small molecule-based approach (Lian et al., 2013). The MCH cardiomyocytes were purified using magnetic-activated cell sorting (MACS) targeting the nonmyocytes for depletion and consequent enrichment of the cardiomyocytes (Miltenyi Biotec, PSC-Derived Cardiomyocyte Isolation Kit, Human). The MCH hiPSC-CMs were not cryopreserved, but used fresh at day 30 of the cardiac directed differentiation process. In each case cardiomyocytes were plated in MATURA96 (CARTOX, LLC, Ann Arbor, Michigan) multiwell plates to form 100% confluent functional mature syncytia as described recently (da Rocha et al., 2017). A total of 50 000 cells were plated per well of each 96-well plate used (5× 10⁶ CMs per plate). Figure 1A shows phase contrast images of syncytial monolayers representative of each cell type (Incucyte Zoom High Content Live Cell Imaging). For each cell line, cardiomyocyte purity was confirmed by Western blotting for the nonmyocyte protein, vimentin (Figure 1B) relative to H3 protein expression.
Figure 1.
Three distinct hiPSC-CM cell lines. We used 3 individual hiPSC-CM cell types for the CiPA myocyte phase II validation study, 2 commercial sources: Cellular Dynamics International (CDI, green, iCell2), Cellartis (CLS, orange), and hiPSC-CMs differentiated in our own laboratory (Michigan, MCH, blue). A, Phase contrast images of each hiPSC-CM cell type functional mature syncytia formation in 96-well plates. Scale bar = 200 µm. B, Western blotting for the noncardiomyocyte marker vimentin in each cell source. Quantification of vimentin expression is normalized to H3 protein expression. The CLS cells contained the greatest amount vimentin (18.67 ± 8.59 au, n = 4); MCH cells contained an intermediate level of vimentin (6.98 ± 2.53 au, n = 4); CDI cells had the lowest levels of vimentin expression (1.00 ± 0.38). C, hiPSC-CM functional mature syncytia conduction velocity (CV) is different for each cell type and is inversely related to the level of vimentin expression in each condition. The CDI hiPSC-CM CV is the fastest at baseline (56.8 ± 0.80 cm/s; n = 72), MCH hiPSC-CM functional mature syncytia CV was intermediate (26.6 ± 1.18 cm/s; n = 71), and CLS hiPSC-CM functional mature syncytia had the slowest CV (5.92 ± 0.30 cm/s; n = 62). Data expressed as mean±standard error of the mean (SEM); 1-way ANOVA; #significant difference of means p < .001.
Drugs screened, dosing, and application to hiPSC-CM functionally mature monolayers
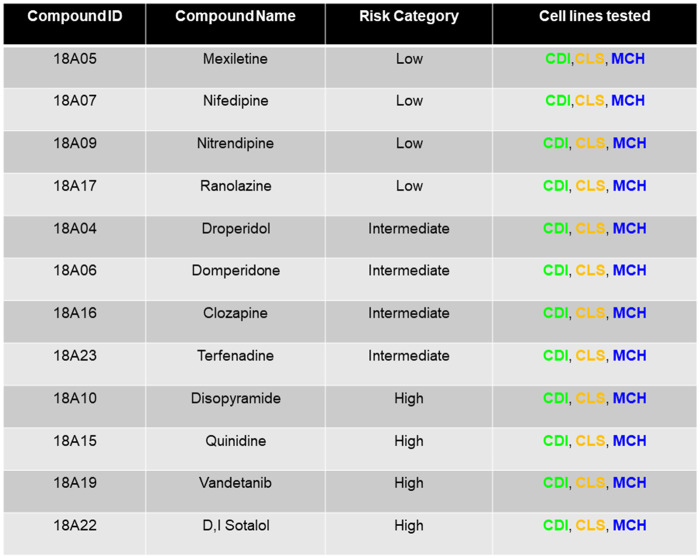
Blinded drug powder was received from the Chemotherapeutic Agents Repository of the National Cancer Institute and stored in the −20°C freezer until the time of testing. Stocks were prepared as instructed by NCI, and test concentrations were as directed and published recently and included in Figures 3–7 (Blinova et al., 2018). The 12 drugs sent to this noncore test site are listed in Table 1 and the layout for drug testing of each 96-well plate used for electrophysiological screening is shown in Supplementary Figure 1. On each plate, dofetilide was included (3 nM as directed, n = 6 per plate) as a positive control for hERG blockade (APD prolongation), and DMSO vehicle controls were also included.
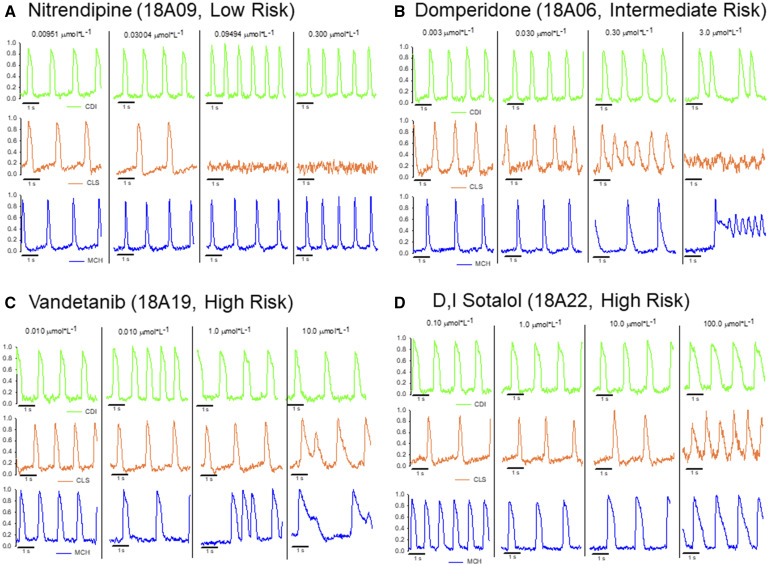
Figure 3.
Original optical action potential recordings showing each hiPSC-CM cell type electrophysiological responses to a subset of compounds from each risk category of CiPA compounds. A, hiPSC-CM cell-type specific responses to the low-risk compound nitrendipine (18A09, calcium channel blocker). Nitrendipine shortened the APD in the CDI and MCH hiPSC-CMs, whereas the CLS cells were completely quiescent at the 2 highest doses (100% of CLS functional mature syncytia were quiescent at each concentration). B, The hiPSC-CM cell-type specific responses to the intermediate-risk compound domperidone (18A06, antiemetic). Drug-induced reentry (rotors) was observed in the CLS and MCH hiPSC-CMs at high concentration, CDI hiPSC-CMs responded with early after depolarizations at the highest concentration. C, hiPSC-CM cell-type specific responses to the high-risk compound vandetanib (18A19, anticancer kinase inhibitor). All cell types showed APD prolongation and the MCH and CLS cells responded to high concentration with EADs. D, The hiPSC-CM cell-type specific response to the high-risk compound sotalol (18A22, β blocker). All cell types responded with APD prolongation.
Table 1.
List of Compounds Obtained From the Chemotherapeutic Agents Repository of the National Cancer Institute
|
Compound identity was blinded during screening experiments and data analysis. Blinded data analysis was submitted to the Health and Environmental Sciences Institute prior to unblinding.
VSD recordings of drug-induced effects in hiPSC-CM mature syncytial monolayers
Following 7 days of maturation post-thaw and replating, hiPSC-CM syncytial monolayers were loaded with the VSD fluovolt as described recently (da Rocha et al., 2017). After the 30 min VSD loading time solution was switched to Hanks Balanced Salt Solution (HBSS) and drug compounds, DMSO control or dofetilide were added as directed for an incubation period of 30 min prior to functional recordings. Action potentials were recorded for 30 s duration using the appropriate emission filter (535 nm). Each syncytial monolayer comprised of nodal cells (which spontaneously depolarize), atrial, and ventricular cardiomyocytes. All recordings were made at physiological temperature in serum free salt solution (37°C, HBSS). Single concentrations of each drug were tested per well. For each recording, a 6×6 array of wells was recorded simultaneously and the entire 96 well plate was recorded by manual translation of the plate under the CCD detector. Supplementary Movie 1 shows the typical readout of the hiPSC-CM monolayer electrophysiology assay used here. Supplementary Movie 1 shows spontaneous action potentials recorded using fluovolt VSD for each cell type tested.
Data analysis
Syncytial monolayers with baseline function outside of the CiPA committee recommended quality standards for spontaneous beat rate were excluded from analysis as reported (Blinova et al., 2018). Syncytial monolayer spontaneous beat rate had to be within the 0.3–1.5 Hz range. Using this criteria, less than 1% of monolayers were excluded from analysis. Optical action potentials were analyzed post acquisition using custom software (Scroll) designed for automated peak detection, repolarization phase detection, action potential duration (30, 50, and 90), action potential triangulation, and CV measurements as recently described (da Rocha et al., 2017; Herron et al., 2016). Compound identity was blinded to our site during experimentation and data analysis. Unblinding of compound identity by the CiPA committee occurred only after all analyzed data were returned to the committee. During experimentation and data analysis, compound identity was only known by the compound ID numbers shown in Table 1. Statistical comparison of electrophysiological and protein expression between the 3 hiPSC-CM cell types or concentrations of drugs was done by analysis of variance (ANOVA) with appropriate multiple comparisons. After compound identities were revealed electrophysiology parameters at different concentrations of each drug (APD30%, APD50%, APD90%, triangulation [APD90%–APD30%], CV, relative[r] APD30%, rAPD50%, rAPD90%, rCV, and number of wells with arrhythmias) were submitted to multiple linear regression analysis for determination of risk prediction models. Relative APDs and CV were calculated by dividing APD or CV values of hiPSCM functional syncytia after drug treatment by the mean of APD or CV values of control samples. The number of wells with arrhythmias followed the guidelines suggested by CiPA and published in Blinova et al. (2017).
Subsequently, APD30%, APD50%, and APD90% were submitted to Fridericia correction for cycle length and relative APD30%, APD50%, APD90%, and triangulation were recalculated and computed into multiple linear regression analysis for the determination of risk prediction models.
Prediction models were used to calculate the risk score for each value and to generate ROC curves comprising the following groups. Comparison of area under the curve of different models was performed with ANOVA followed by Tukey’s test for means. Comparison between models using Fridericia corrected and uncorrected data were performed with Student’s t test.
RESULTS
Baseline Characterization of Each hiPSC-CM Cell Type
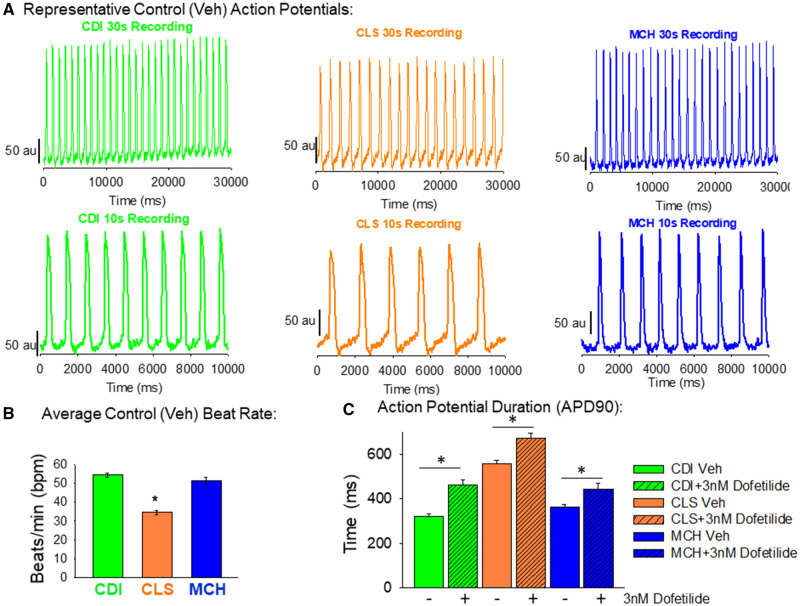
Human-induced pluripotent stem cell-derived cardiomyocytes (hiPSC-CMs) obtained from 2 different commercial vendors (iCell2 cardiomyocytes from Cellular Dynamics International referred as CDI throughout the manuscript; and Cellartis Cardiomyocytes, TakaraBio and referred to as CLS from now on) or produced in house with a highly efficient small molecule cardiomyocyte directed differentiation of BJ hiPSCs (assigned as MCH) were plated to form functional syncytia of electrophysiologically mature hiPSC-CMs. Each cell type formed 100% confluent functional syncytia using the plating protocol described here (Figure 1A). Western blotting for the noncardiomyocyte specific protein, vimentin, confirmed the relative purity of each cell type (Figure 1B). The CDI cardiomyocytes are highly pure and do not express significant amounts of vimentin. The CLS cardiomyocytes are unpurified and contain a significant amount of noncardiomyocytes determined by expression of the protein vimentin. The MCH cardiomyocytes were purified using magnetic-beads assisted cell sorting-based approach and express lower levels of vimentin than CLS cells, but more than CDI cells. Thus, each cell type is prepared to a distinct percentage of cardiomyocytes. Differences of hiPSC-CM purity translate to distinct baseline electrophysiological function, characterized by different action potential, and conduction velocities (Figure 1C). Expression of vimentin and CV had a very strong negative correlation (r = 0.83, p = .001). Original movie files showing the baseline activations of each cell type are in Supplementary Movie 1 (CDI = green, CLS = orange and MCH = blue). Furthermore, Figure 2 shows control recordings of each cell type’s spontaneous contractions. The CDI and the MCH cardiomyocytes have similar beating rate and action potential duration. On the other hand, CLS cardiomyocytes have slower spontaneous beating rate and longer action potential duration (APD90) than the other 2 cell types. The CLS cardiomyocytes also display a more prominent phase 4 depolarization than the other 2 cell types. All 3 cell types respond to hERG blockade by dofetilide (3 nM; Figure 2C).
Figure 2.
Baseline action potential characterization of each hiPSC-CM cell type. A, Representative original recordings of optical action potentials in each cell type. In this study, 30 s recordings were made for each compound tested. Shown in the top row of (A) are 30 s action potential recordings of each cell type. The bottom row of (A) shows a shorter time scale (10 s) of these original recordings. B, Quantification of the spontaneous beat rate shows similarity between CDI and MCH hiPSC-CMs (54.3 ± 5.2 bpm; n = 18 vs 51.3 ± 6.9 bpm; n = 18). The CLS hiPSC-CM functional mature syncytia, on the other hand, had significantly slower spontaneous beat rate (34.5 ± 4.8 bpm; n = 18) than the other groups. Data mean±standard deviation (SD); *significant difference, p < .001, 1-way ANOVA. C, Quantification of action potential duration 90 (APD90) also shows similarities between CDI and MCH functional mature syncytia (322.2 ± 36.3 ms; n = 18 and 363.2 ± 47.1 ms; n = 18). The CLS hiPSC-CM functional mature syncytia, however, had significantly longer APD90 than the other 2 cell types (554.4 ± 71.8 ms; n = 18); *significant difference, 1-Way ANOVA; p < .001. Also, 3 nM dofetilide was used as a positive control for APD90 prolongation for each cell type, and each cell type responded with longer APD90 values (CDI + 3 nM dofetilide = 461 ± 100.9 ms; n = 23/MCH + 3 nM dofetilide = 444.1 ± 121.7 ms; n = 23 and CLS + 3nM Dofetilide = 672.2 ± 103.3 ms; n = 23). *Significant difference from baseline values (vehicle control) in each cell type, t-test.
hiPSC-CM Drug Responsiveness
Each compound tested was applied for 30 min prior to electrophysiological recordings. Drug compound dosing was as directed by the NCI and CiPA Steering Committee. Single wells received a single dose of compound. There were no complications with drug solubilization at any of the concentrations indicated. Figure 3 shows representative traces for each cell type tested using the indicated drug compound from each risk category. Figure 3A shows example traces from each cell type screened for responsiveness to the calcium channel blocker, nitrendipine. Nitrendipine is classified as a low-risk compound for causing TdP and action potential prolongation. An APD shortening is apparent in the CDI (green) and MCH (blue) syncytial monolayers, whereas CLS monolayers responded with quiescence of spontaneous beating at the 2 highest concentrations of nitrendipine. Figure 3B shows example traces for each cell type screened for responsiveness to domperidone. Domperidone is a dopamine D2 antagonist classified as intermediate risk for causing TdP. The APD prolongation is apparent for all 3 cell types in response to domperidone, however, the arrhythmia response was distinct for each cell type. The CDI cells responded to the highest concentration of domperidone with early after depolarizations (EADs), whereas CLS cells responded with tachyarrhythmia and quiescence at the highest concentration. The MCH cells responded to domperidone with APD prolongation and EADs that transformed to tachyarrhythmia at the highest concentration. The unique responses of each cell type to domperidone are also presented in Supplementary Movie 2. Figure 3C displays sample recordings from each cell type response to the high-risk compound, vandetanib. Each cell type responded to vandetanib with APD prolongation and in the case of CLS and MCH cells, EADs. Finally, Figure 3D shows each cell type response to the high-risk compound, D, I sotalol. Each cell type responded to D, I sotalol with APD prolongation, as expected.
Low TdP Risk Category
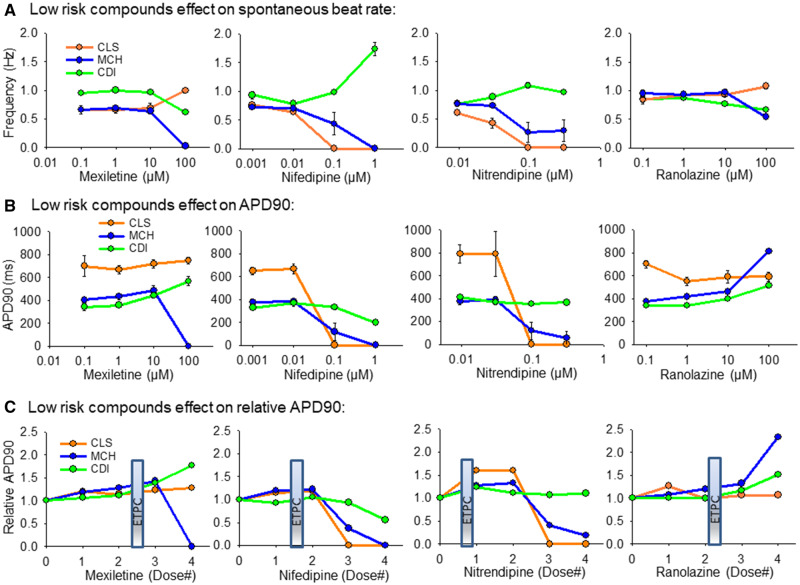
The 4 low-risk compounds tested here were mexiletine, nifedipine, nitrendipine, and ranolazine (Table 1). Figure 4 summarizes the response of each cell type to these compounds. Figure 4A shows the effect of each compound on the spontaneous beat rate for each cell type. Figure 4B is plotted the effect of each compound on the absolute APD90 for each cell type. Figure 4C shows the relative effect of each compound on APD90-relative to vehicle control values. Figure 4C also indicates the effective therapeutic plasma concentration (ETPC) for each drug to provide clinical context for the dosing.
Figure 4.
Summary of hiPSC-CM cell type responses to low-risk compounds. A, Low-risk compounds effect on spontaneous beat rate, Hz. B, Low-risk compound effects on APD90 values. C, Low-risk compound effects on the APD90 relative to vehicle control values. The clinical effective therapeutic plasma concentration (ETPC) is positioned on each plot in (C) to provide context for the drug concentration relative to therapeutic levels. All data expressed as mean±SEM.
Mexiletine is a sodium channel blocker that caused slowing of the spontaneous beat rate in CDI and MCH cells at 100 µM, but increased beat rate of the CLS cells. In MCH cells 100 µM mexiletine caused quiescence in 6/6 functional mature syncytia tested. Mexiletine did not significantly change the APD90 of CLS cells. An APD90 prolongation was detected in CDI cells at the 2 highest doses of mexiletine tested. Nifedipine sped spontaneous beat rate of CDI cells at the highest concentration (1 µM) and caused quiescence of beating in CLS and MCH cells at the same concentration. Nifedipine shortened APD90 in CDI cells and MCH cells. Nitrendipine is another calcium channel blocker classified as low risk for causing TdP. These CDI cells were relatively insensitive to nitrendipine, whereas CLS and MCH cells responded with slowing of spontaneous beat rate and action potential duration shortening. Ranolazine is an inhibitor of the late inward sodium current in heart muscle and although it can prolong the action potential duration it is classified as a low risk TdP compound. Ranolzine slowed the spontaneous beat rate in CDI and MCH cells, but had relatively little effect in CLS cells. Ranolazine APD prolongation was apparent at high concentrations in CDI and to a larger extent in MCH cells. No TdP arrhythmias were detected for any of the low-risk compounds.
Intermediate TdP Risk Category
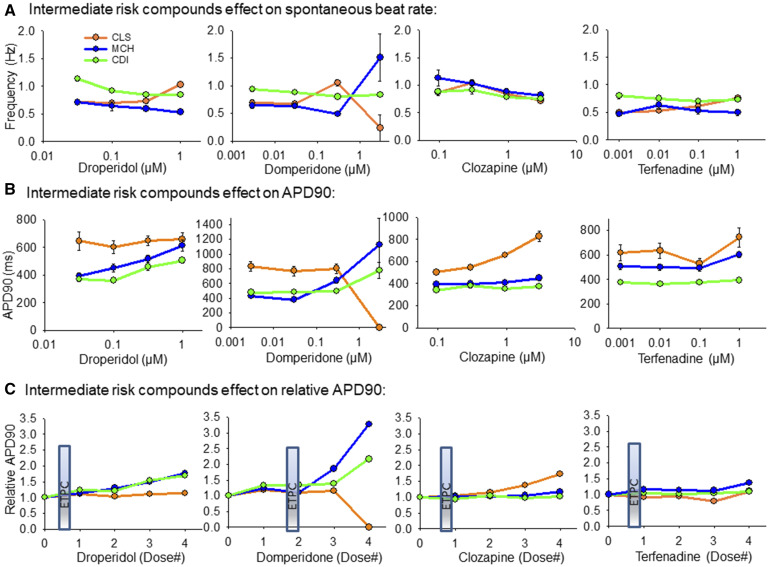
The 4 intermediate compounds screened at our site were droperidol, domperidone, clozapine, and terfenadine, as listed in Table 1. Figure 5 outlines the effect of these compounds screened in each cell line. Figure 5A shows the effect of these compounds on spontaneous beat rate of each cell type; Figure 5B shows the effect of these compounds on APD90 for each cell type; and Figure 5C shows the relative effect of each compound to prolong the APD90 (relative to vehicle control at each concentration). Droperidol prolonged APD90 in CDI and MCH cells, but had little effect in the unpurified CLS cells. Domperidone prolonged the APD90 at high concentrations in CDI and MCH cells and caused quiescence in all CLS functional mature syncytia at the highest concentration. Interestingly, although domperidone prolonged APD90 in MCH cells the spontaneous beat rate was faster. Clozapine significantly prolonged APD90 only in the CLS cells, indicating that proarrhythmia effects of clozapine may require the presence of nonmyocytes to be coupled with the cardiomyocytes. Finally, terfenadine had little to moderate effects to prolong APD90 in all 3 cell types.
Figure 5.
Summary of hiPSC-CM cell type responses to intermediate-risk compounds. A, Intermediate-risk compounds effects on spontaneous beat rate, Hz. B, Intermediate-risk compound effects on APD90 values. C, Intermediate-risk compound effects on the APD90 relative to vehicle control values. The ETPC is positioned on each plot in (C) to provide context for the drug concentration relative to documented therapeutic levels. All data expressed as mean±SEM.
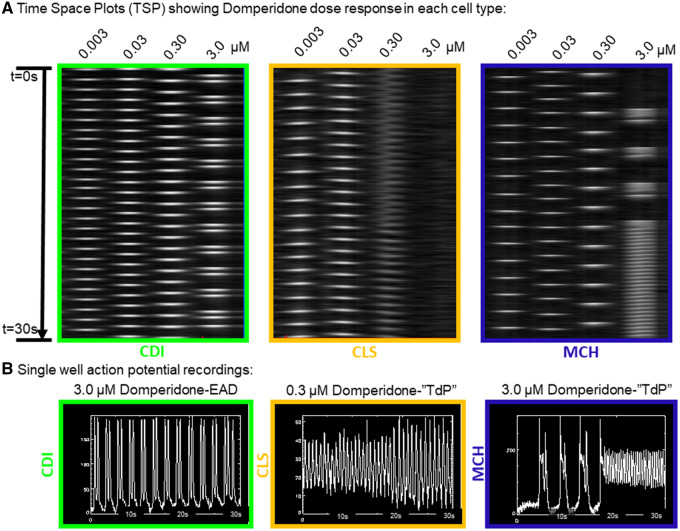
The paradoxical result of domperidone to prolong APD and speed the beat rate of MCH cells can be explained by the induction of TdP-like activation patterns induced by domperidone in the MCH cells. Figure 6 shows the activation patterns of each cell type as a function of domperidone concentration. Although CDI cells showed EADs at the highest dose of domperidone, rotors were detected in the other 2 cell types. In the time-space plots of Figure 6A, rotors are apparent by the zig-zag activation pattern indicating a rotating wave of activation. These CLS cells responded with rotor (reentry) activation patterns at 0.30 µM and quiescence (6/6 functional mature syncytia) at 3.0 µM. Similarly, rotors were detected (4/6 functional mature syncytia) at the highest dose of domperidone tested in the MCH cells. Interestingly, drug-induced EAD transition to TdP arrhythmia activations were observed in the MCH cells (Figure 6B). Supplementary Movie 2 presents the different arrhythmia phenotypes observed for each cell type over the dose ranges of domperidone tested here.
Figure 6.
Cell type specific responses to the antiemetic intermediate-risk compound domperidone. A, Time space plots of a single row of a 96-well plate showing action potential responses to exposure with domperidone over a log range of concentrations from 0.003 to 3.0 µM. The green box is for CDI hiPSC-CMs where EADs were observed at the highest concentration. The center orange box is for CLS hiPSC-CMs where reentrant, TdP activation patterns were observed at 0.30 µM. The blue box is for MCH hiPSC-CMs where APD prolongation was apparent at 0.30 µM and reentrant, TdP activation patterns were observed at the highest concentration (3.0 µM). B, Single well action potential recordings for each cell type treated with the indicated concentration of Domperidone.
High TdP Risk Category
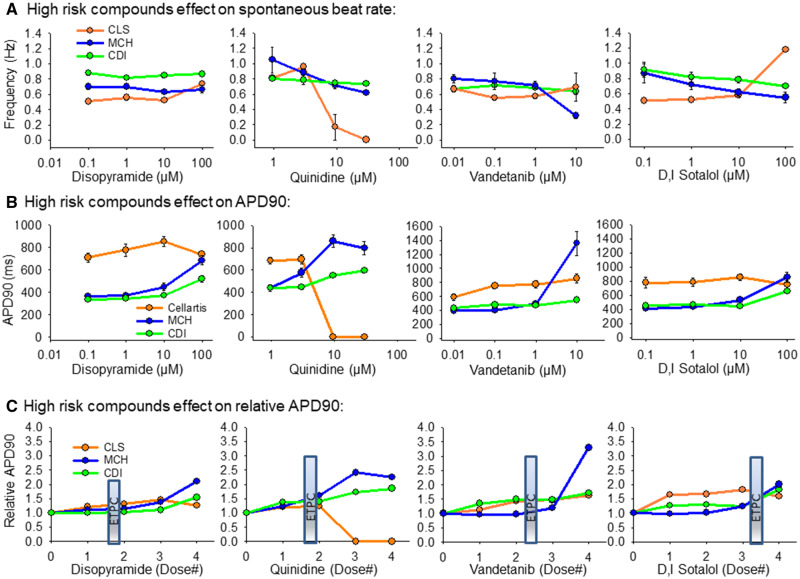
The 4 high-risk TdP drugs screened were disopyramide, quinidine, vandetanib, and D, I sotalol as listed in Table 1. Figure 7 outlines the effects of these compounds on each cell type. Disopyramide had minimal effect on spontaneous beat rate and APD90 prolongation was detected at doses higher than the ETPC. Quinidine slowed the spontaneous beat rate in all 3 cell types and significant APD90 prolongation in the MCH and CDI cells. The CLS cells responded with quiescence at high concentrations of quinidine. The MCH cells were most sensitive to vandetanib to prolong the APD90, but action potential prolongation was detected in each cell line. D, I sotalol slowed beat rate of MCH and CDI cells, but caused tachyarrhythmia in the CLS cells. APD90 prolongation was detected at low concentration (0.1 µM) in CLS cells, but only at the highest concentration (100 µM) in CDI and MCH cells.
Figure 7.
Summary of hiPSC-CM cell type response to high-risk compounds. A, High-risk compounds effect on spontaneous beat rate, Hz. B, High-risk compound effects on APD90 values. C, High-risk compound effects on the APD90 relative to vehicle control values. The clinical effective therapeutic plasma concentration (ETPC) is positioned on each plot in (C) to provide context for the drug concentration relative to therapeutic levels. All data expressed as mean±SEM.
Sodium Channel Blockers Slow CV
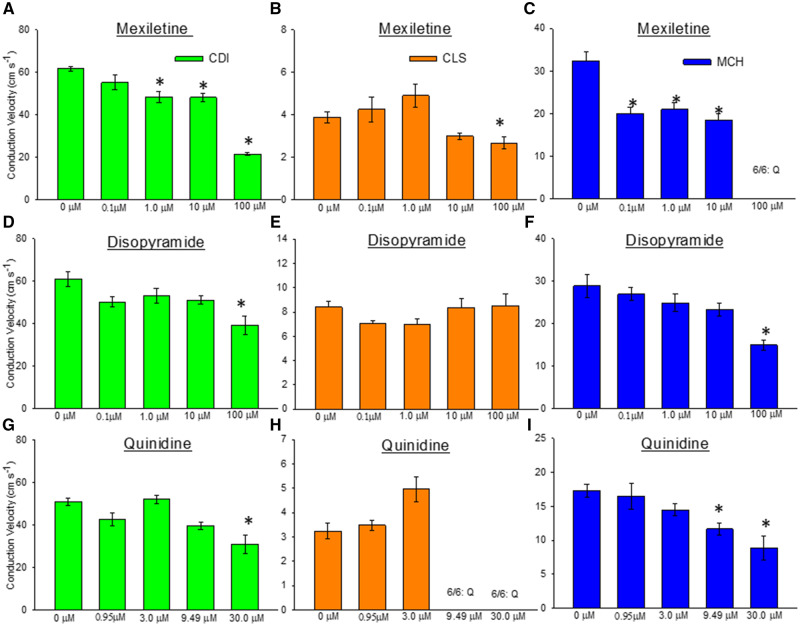
The spatial resolution of our optical mapping system enabled quantification of action potential CV in the 96-well plates used here. We analyzed the effect of sodium channel blockers mexiletine, disopyramide, and quinidine to slow impulse velocity in each hiPSC-CM cell type. Mexiletine caused conduction slowing in each cell type (Figs. 8A–C). In CDI cells, significant conduction slowing by mexiletine was detected at 1.0 µM (0 µM = 61.6 ± 2.87 cm/s; 1 µM = 48.34 ± 6.58 cm/s; n = 6, 1-way ANOVA, p < .001) and slowed further with increasing dose to 100.0 µM (100 µM = 21.5 ± 1.64 cm/s). The MCH cells were more sensitive to mexiletine-induced conduction slowing where significant slowing was detected at 0.1 µM (0 µM = 32.4 ± 4.93 cm/s; 0.1 µM = 19.9 ± 3.81 cm/s; n = 6, 1-way ANOVA, p < .001). In CLS cells mexiletine-induced conduction slowing was only detected at the highest concentration (100 µM). Disopyramide-induced conduction slowing was detected only at the highest dose (100 µM; Figs. 8D–F) in CDI cells (0 µM = 61.0 ± 8.83 cm/s; 100 µM = 39.1 ± 10.9 cm/s; n = 6, 1-way ANOVA, p < .001) and MCH cells (0 µM = 28.9 ± 6.65 cm/s; 100 µM = 14.9 ± 2.92 cm/s; n = 6, 1-way ANOVA, p < .001). Disopyramide-induced conduction slowing was not detected in CLS cells. Quinidine-induced conduction slowing (Figs. 8G–I) was apparent at the highest dose in CDI cells (0 µM = 51.2 ± 4.21 cm/s; 30.0 µM = 31.1 ± 11.2 cm/s; n = 6, 1-way ANOVA, p < .001). In MCH cells quinidine conduction slowing was detected at lower concentration (0 µM = 17.32 ± 2.28 cm/s; 9.49 µM = 11.7 ± 2.21 cm/s) and progressively slowed at 30 µM (8.8 ± 3.85 cm/s; n = 6, 1-way ANOVA, p < .001). These CLS cells responded to quinidine with cessation of spontaneous beating, quiescence (Q).
Figure 8.
Detection of action potential conduction slowing by Na channel blockers. A–C, Mexiletine is a sodium channel blocker that slows impulse conduction velocity (CV). Quantification of CV indicates that our assay can detect significant slowing of impulse propagation in all 3 cell lines. D–F, Disopyramide is a sodium channel blocker that also slows impulse conduction. Conduction slowing by disopyramide was detected in the CDI and MCH cell lines, but not CLS. G–I, Quinidine is a sodium channel blocker and conduction slowing was detected in CDI and MCH hiPSC-CMs in this assay, but not the CLS cells. All data expressed as mean±SEM. *Significant difference of the mean within a group, analyzed by 1-Way ANOVA, p < .001.
Risk Assessment
Cardiomyocytes from CDI were employed in other validation studies conducted by the FDA (Blinova et al., 2017; Schocken et al., 2018; Strauss et al., 2018), they are commercially available for proarrhythmia screening; therefore we have submitted data obtained from drug treatment with CDI cells to a multiple linear regression including several parameters and we have generated 4 assessment models:
Prediction models were also computed using Fridericia corrected (cF) APD 30%, APD50% and APD90%:
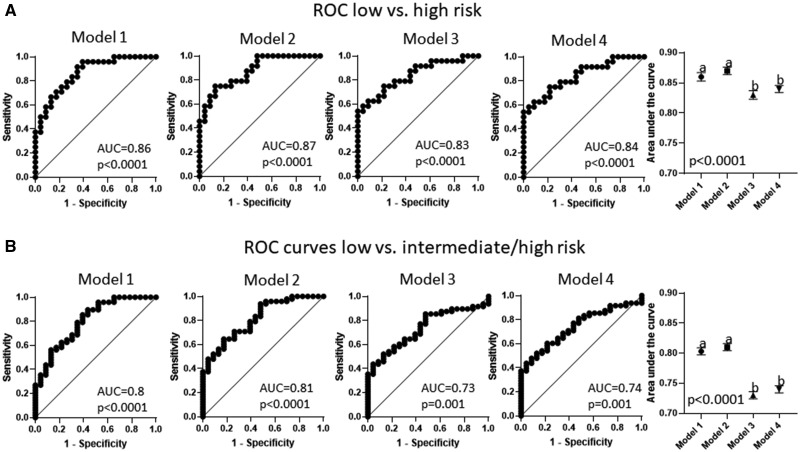
Risk scores were computed for low-, intermediate-, high-, and intermediate-/high-risk drugs with each of the 4 models and 4 cF models. Risk scores were used to generate ROC curves. Inclusion of CV significantly increase the capacity of the prediction models to identify drugs that have low risk of arrhythmias in relation to high-risk drugs (Figure 9A; model 1 AUC = 0.86; model 2 AUC = 0.87; model 3 AUC = 0.83, and model 4 AUC = 0.84; p < .0001). Furthermore, CV also enhanced discrimination between drugs with low risk and those posing greater risk to generate arrhythmias (Figure 9B; model 1 AUC = 0.8; model 2 AUC = 0.81; model 3 AUC = 0.73, and model 4 AUC = 0.74; p < .0001). Also, inclusion of CV in prediction models; models that included CV yield significantly higher power to discriminate between drugs with low versus intermediate risk (Supplementary Figure 2A; model 1 AUC = 0.74; model 2 AUC = 0.75; model 3 AUC = 0.63, and model 4 AUC = 0.63; p < .0001). Nevertheless, models including CV did not improve the potential to discriminate between drugs classified as intermediate and high risk that (Supplementary Figure 2B; model 1 AUC = 0.7; model 2 AUC = 0.67; model 3 AUC = 0.72, and model 4 AUC = 0.71; p < .0001).
Figure 9.
Receiver operating characteristic curves were calculated for 4 models (model 1: includes relative APD90%, relative APD50%, relative triangulation, relative conduction velocity (CV), and arrhythmias at any concentration; model 2: includes relative APD90%, relative APD50%, relative triangulation, and relative CV; model 3: includes relative APD90%, relative APD50%, relative triangulation, and arrhythmias at any concentration; model 4: includes relative APD90%, relative APD50%, and relative triangulation). Inclusion of CV on prediction models increased the ability to discriminate between drugs classified as low risk for arrhythmogenesis in relation to those that are classified as high risk and intermediate/high risk for causing arrhythmias.
Prediction models calculated with Fridericia correction of APD showed that included CV or number of arrhythmias significantly improved the capacity of the models to discriminate between low- and high-risk drugs (Supplementary Figure 3A; cFModel 1 AUC = 0.87; cF model 2 AUC = 0.85; cF model 3 AUC = 0.86, and cF model 4 AUC = 0.82; p < .0001). Inclusion of CV also increased the prediction power of cF models to discern between intermediate- and high-risk drugs (Supplementary Figure 3B; cFModel 1 AUC = 0. 7; cF model 2 AUC = 0.7; cF model 3 AUC = 0.68, and cF model 4 AUC = 0.66; p < .0001). Calculation of prediction models with Fridericia corrected data blunted the ability of the models to discriminate between low- and intermediate-risk drugs (Supplementary Figure 4A; cFModel 1 AUC = 0.53; cF model 2 AUC = 0.56; cF model 3 AUC = 0.51, and cF model 4 AUC = 0.5; p < .0001). Interestingly, the prediction model including only CV had significant lower ability to discriminate between intermediate- and high-risk drugs than those including CV and number of arrhythmias, number of arrhythmias only or that not including CV nor number of arrhythmias (Supplementary Figure 4B; cFModel 1 AUC = 0.81; cF model 2 AUC = 0.76; cF model 3 AUC = 0.82, and cF model 4 AUC = 0.8; p < .0001).
Although we performed calculations with Fridericia correction, we only observed significant a significantly higher cycle length of spontaneous activity in high-risk drugs and 10 times the ETPC; low- and intermediate-risk drugs at 10 times the ETPC were similar (Supplementary Figure 5; cycle length low risk: 1226 ms; intermediate risk: 1176 ms; and high risk: 1392 ms; p = .001).
We performed pairwise comparison between the risk models obtained with raw values and cF values to determine if cF would improve the power of any of the 4 models to discriminate drugs classified as low, intermediate, high, and intermediate/high risk for arrhythmias. Fridericia correction of APD values significantly decreased the power of cF models in relation to models obtained with raw APD data to discriminate between drugs with low risk and drugs that pose intermediate and higher risk (Supplementary Figure 6A; model 1 vs cF model 1: p < .0001, model 2 vs cF model 2: p < .0001 model 3 vs cF model 3: p < .0001; and model 4 vs cF model 4: p < .0001). Nevertheless, cF correction significantly improved the ability of all models to discriminate between intermediate- and high-risk drugs (Supplementary Figure 6B; model 1 vs cF model 1: p < .0001, model 2 vs cF model 2: p < .0001 model 3 vs cF model 3: p < .0001; and model 4 vs cF model 4: p < .0001). cF models were not able to discriminate between low and intermediate risk and all the 4 cFmodels presented significantly lower AUC in comparison to the correspondent raw data models (Supplementary Figure 7A; model 1 vs cF model 1: p < .0001, model 2 vs cF model 2: p < .0001 model 3 vs cF model 3: p < .0001; and model 4 vs cF model 4: p < .0001). Finally, comparisons between the capacity of cF Models and Models using noncorrected data were not consistent across the 4 models (Supplementary Figure 7B). cF models and using noncorrected data that included CV and number of arrhythmias had similar AUCs (p = .34); nevertheless, when the models included CV utilization of noncorrected data yielded more power to discriminate between low- and high-risk drugs (p = .048). When the models included only the number of arrhythmias, cF model 3 presented significantly higher AUC in comparison to Model 3 (p = .0058). Conversely, model using noncorrected data that did not include CV and number of arrhythmias (model 4) provided a significantly higher AUC in comparison to the corresponding risk model using cF data (p = .048).
DISCUSSION
Human-induced pluripotent stem cell-derived cardiomyocytes utility to predict drug-induced arrhythmias has been demonstrated by international initiatives (Blinova et al., 2017, 2018) that comprised up to 60 drugs in their testing libraries (Kanda et al., 2018). These herculean efforts validated the utility of purified hiPSC-CMs from 2 different commercial vendors employing different testing platforms such as MEAs from different manufacturers and photonic optical mapping with VSDs for the detection of field potential changes and action potential changes, respectively. Those validation studies utilized immature hiPSC-CMs that were highly purified. In this study, we investigated also the impact of naturally occurring noncardiomyocytes on drug response of mature syncytial monolayers. Naturally occurring noncardiomyocytes are cell types arising from cardiac progenitor cells during the process of differentiation (endothelial cells, smooth muscle cells, and cardiac fibroblast) that can be present in different percentages in cellular preparations depending on the method of generation and/or purification of hiPSC-CMs. We employed in this study cells obtained from 2 commercial vendors (CDI 98% of cardiomyocytes and CLS 80% of cardiomyocytes) and in house produced cardiomyocytes separated with a magnetic beads-assisted noncardiomyocyte immunodepletion approach (MCH 94% of cardiomyocytes).
Recently, we have demonstrated that addition of hiPSC-derived cardiac fibroblast, dermal fibroblast, or adult cardiac fibroblasts to cardiomyocytes mature functional syncytia decreases electrical impulse CV (Zhang et al., 2019) and also significantly affected action potential duration at 80% of repolarization (Zhang et al., 2019). Results obtained from the 3 cell lines employed in this study corroborate with this previous report; cell preparations with lower proportions of noncardiomyocytes (indicated by lower levels of vimentin expression in CDI cellular preparations) associate with faster CV and shorter APD, whilst higher proportions of noncardiomyocytes associates with slower CV and longer APD (Figure 1).
Changes in CV of electrical impulse and action potential duration corresponding to the percentage of noncardiomyocytes present in cell preparations are of utmost importance for drug safety screening tests because changes in these 2 parameters have long been recognized as important determinants of cardiac arrhythmias (Arita et al., 1977; Campbell et al., 2012; Mironov et al., 2008; Wit and Rosen, 1983; Zipes, 1975). In fact, mature functional syncytia of CDI, CLS, and MCH cardiomyocytes yielded similar trends in drug response, but at different sensitivities as observed in the relative APD90 results. Furthermore, domperidone-induced TdP-like (Supplementary Video 1) were observed in mature functional syncytia with higher proportions of noncardiomyocytes while mature functional syncytia of CDI only presented early afterdepolarizations, indicating that a certain percentage of noncardiomyocytes, shown to reduce CV, may be required for direct observation of adverse events such as TdP-like activation patterns.
The previous international initiatives to demonstrate the utility of hiPSC-CMs to predict drug-induced arrhythmias relied on generation of mathematical models using candidate predictors. The selected predictors (Blinova et al., 2017, 2018) were applied to data generated by multiple study cites and the number of replicates necessary to generate qualitative predictors may not be feasible to single test sites generating safety data for new compounds. Conduction velocity was not added to the prediction models generated by these international initiatives because MEAs and photonic optical mapping are unable to provide sufficient spatial data for calculation of impulse CV. Nevertheless, inclusion of CV would increase resolution of prediction models because hiPSC-derived cardiomyocytes present sodium channel blocker-mediated slowing in CV, similarly to the effect of these drugs in intact hearts (Burashnikov et al., 2007; Davis et al., 1986; Lauribe et al., 1989).
Optical mapping of hiPSC-CM action potentials observed with a CCD camera has the unique advantage of producing data with temporal and spatial resolution for calculation of CV of electrical impulse as well as action potential duration (Lee et al., 2012). We were able to generate 8 different prediction models (4 models based on noncorrected data and 4 based on Fridericia corrected data) for CDI cardiomyocytes. We choose to generate risk models only to CDI cardiomyocytes because cells from this source were previously validated in multisite studies (Blinova et al., 2017, 2018). Risk scores calculated with these models were used to compute ROC curves and to compare the capacity of these models to discriminate between different risks for proarrhythmia. Models that comprised CV data generated with APD data that were not submitted to Fridericia correction had higher capacity to discriminate between different risk groups than models that did not include CV data (Figure 9; Supplementary Figure 2). Furthermore, this pattern was partially reproduced in risk assessment models calculated from Fridericia corrected APD (Supplementary Figs. 3 and 4).
Duration of spontaneous depolarization cycle length of CDI cardiomyocytes was similar between cells treated with low- and intermediate-risk drugs (Supplementary Figure 5); but high-risk drugs significantly increased spontaneous depolarization cycle length. Because APD is directly dependent of spontaneous depolarization cycle length, we investigated the value of using Fridericia corrected data to generate risk assessment models by direct comparison to the correspondent models generated with APD data that were not corrected for cycle length differences (Supplementary Figs. 6 and 7). Fridericia corrected data were able to increase the ability of prediction models to discriminate between intermediate- versus high-risk drugs; however, it completely blunted the ability of the models to discriminate between low and intermediate risk. The lack of ability to discriminate between low-and intermediate-risk drugs has a deleterious impact on the ability of cF models to discriminate between low risk drugs and those drugs that pose greater chances of causing arrhythmias and decrease the interest of using Fridericia corrected data to generate prediction models.
Our results support that the inclusion of a second ancillary factor to the development of arrhythmias, like CV increases the capability of risk assessment models to make accurate predictions. Another factor that may contribute or solely induce arrhythmias is APD alternans (Krogh-Madsen and Christini, 2012; Tse et al., 2016). Although we did not observe action potential alternans after treatment with the subset of drugs provided by CiPA to this study, optical mapping of action potential is able to unveil the presence of APD alternans (unpublished data). APD alternans may be quantitated as variance in APD duration and should be included in future studies aiming to improve the ability of risk assessment models.
Although data analysis with regular regression models yields accurate and useful models for predicting drug risk, future implementation of artificial intelligence and machine learning analysis of action potential patterns induced by specific drugs will further advance and improve the ability to determine the safety of new compounds. The high-throughput nature of our VSD-based assay offers the opportunity to collect sufficient human action potential drug response data for future generation of artificial intelligence and automated preclinical arrhythmia risk assessment.
In summary, we show here that drug testing on cardiomyocytes differentiated from hiPSCs provides reliable drug risk stratification and that including CV of electrical propagation improves the capacity of prediction models to indicate proarrhythmia risk. Furthermore, percentage of noncardiomyocytes in cellular preparations significantly impacts CV and hiPSC-CM response to drugs and should be carefully considered when investigating the proarrhythmia potential of investigational new drugs.
DECLARATION OF CONFLICTING INTERESTS
A.M.d.R. and J.C. are consultants for CARTOX, LLC. T.J.H. is cofounder of CARTOX, LLC. CARTOX, LLC is the recipient of an NIH SBIR grant.
FUNDING
The study was supported by National Institutes of Health-NIEHS (Grant/Award Number: R44ES027703-03), Michigan Economic Development Corporation (Grant/Award Number: MTRAC-FastForward Medical Innovation Program).
Supplementary Material
References
- Arita M., Nagamoto Y., Saikawa T. (1977). Automaticity and time-dependent conduction disturbance produced in canine ventricular myocardium. New aspects for initiation of ventricular arrhythmias. Jpn. Circ. J. 40, 1409–1418. [DOI] [PubMed] [Google Scholar]
- Authier S., Pugsley M. K., Koerner J. E., Fermini B., Redfern W. S., Valentin J.-P., Vargas H. M., Leishman D. J., Correll K., Curtis M. J., et al. (2017). Proarrhythmia liability assessment and the comprehensive in vitro Proarrhythmia Assay (CiPA): An industry survey on current practice. J. Pharmacol. Toxicol. Methods 86, 34–43. [DOI] [PubMed] [Google Scholar]
- Bizy A., Guerrero-Serna G., Hu B., Ponce-Balbuena D., Willis B. C., Zarzoso M., Ramirez R. J., Sener M. F., Mundada L. V., Klos M., et al. (2013). Myosin light chain 2-based selection of human iPSC-derived early ventricular cardiac myocytes. Stem Cell Res. 11, 1335–1347. [DOI] [PMC free article] [PubMed] [Google Scholar]
- Blinova K., Dang Q., Millard D., Smith G., Pierson J., Guo L., Brock M., Lu H. R., Kraushaar U., Zeng H. (2018). International multisite study of human-induced pluripotent stem cell-derived cardiomyocytes for drug proarrhythmic potential assessment. Cell Rep. 24, 3582–3592. [DOI] [PMC free article] [PubMed] [Google Scholar]
- Blinova K., Stohlman J., Vicente J., Chan D., Johannesen L., Hortigon-Vinagre M. P., Zamora V., Smith G., Crumb W. J., Pang L., et al. (2017). Comprehensive translational assessment of human-induced pluripotent stem cell derived cardiomyocytes for evaluating drug-induced arrhythmias. Toxicol. Sci. 155, 234–247. [DOI] [PMC free article] [PubMed] [Google Scholar]
- Boyle P. M., Franceschi W. H., Constantin M., Hawks C., Desplantez T., Trayanova N. A., Vigmond E. J. (2019). New insights on the cardiac safety factor: Unraveling the relationship between conduction velocity and robustness of propagation. J. Mol. Cell Cardiol. 128, 117–128. [DOI] [PMC free article] [PubMed] [Google Scholar]
- Burashnikov A., Di Diego J. M., Zygmunt A. C., Belardinelli L., Antzelevitch C. (2007). Atrium-selective sodium channel block as a strategy for suppression of atrial fibrillation: Differences in sodium channel inactivation between atria and ventricles and the role of ranolazine. Circulation 116, 1449–1457. [DOI] [PMC free article] [PubMed] [Google Scholar]
- Campbell K., Calvo C. J., Mironov S., Herron T., Berenfeld O., Jalife J. (2012). Spatial gradients in action potential duration created by regional magnetofection of hERG are a substrate for wavebreak and turbulent propagation in cardiomyocyte monolayers. J. Physiol. 590, 6363–6379. [DOI] [PMC free article] [PubMed] [Google Scholar]
- Colatsky T., Fermini B., Gintant G., Pierson J. B., Sager P., Sekino Y., Strauss D. G., Stockbridge N. (2016). The comprehensive in vitro proarrhythmia assay (CiPA) initiative—Update on progress. J. Pharmacol. Toxicol. Methods 81, 15–20. [DOI] [PubMed] [Google Scholar]
- da Rocha A. M., Campbell K., Mironov S., Jiang J., Mundada L., Guerrero-Serna G., Jalife J., Herron T. J. (2017). hiPSC-CM monolayer maturation state determines drug responsiveness in high throughput pro-arrhythmia screen. Sci. Rep. 7, 13834. [DOI] [PMC free article] [PubMed] [Google Scholar]
- Davis J., Matsubara T., Scheinman M. M., Katzung B., Hondeghem L. H. (1986). Use-dependent effects of lidocaine on conduction in canine myocardium: Application of the modulated receptor hypothesis in vivo. Circulation 74, 205–214. [DOI] [PubMed] [Google Scholar]
- Fermini B., Hancox J. C., Abi-Gerges N., Bridgland-Taylor M., Chaudhary K. W., Colatsky T., Correll K., Crumb W., Damiano B., Erdemli G., et al. (2016). A new perspective in the field of cardiac safety testing through the comprehensive in vitro proarrhythmia assay paradigm. J. Biomol. Screen. 21, 1–11. [DOI] [PubMed] [Google Scholar]
- Gintant G. A. (2008). Preclinical Torsades-de-Pointes Screens: Advantages and limitations of surrogate and direct approaches in evaluating proarrhythmic risk. Pharmacol. Ther. 119, 199–209. [DOI] [PubMed] [Google Scholar]
- Gintant G., Fermini B., Stockbridge N., Strauss D. (2017). The evolving roles of human iPSC-derived cardiomyocytes in drug safety and discovery. Cell Stem Cell 21, 14–17. [DOI] [PubMed] [Google Scholar]
- Gintant G., Sager P. T., Stockbridge N. (2016). Evolution of strategies to improve preclinical cardiac safety testing. Nat. Rev. Drug Discov. 15, 457. [DOI] [PubMed] [Google Scholar]
- Herron T. J., Rocha A. M., Campbell K. F., Ponce-Balbuena D., Willis B. C., Guerrero-Serna G., Liu Q., Klos M., Musa H., Zarzoso M., et al. (2016). Extracellular matrix-mediated maturation of human pluripotent stem cell–derived cardiac monolayer structure and electrophysiological function. Circ. Arrhythm. Electrophysiol. 9, e003638. [DOI] [PMC free article] [PubMed] [Google Scholar]
- Kanda Y., Yamazaki D., Osada T., Yoshinaga T., Sawada K. (2018). Development of torsadogenic risk assessment using human induced pluripotent stem cell-derived cardiomyocytes: Japan iPS Cardiac Safety Assessment (JiCSA) update. J. Pharmacol. Sci. 138, 233–239. [DOI] [PubMed] [Google Scholar]
- Krogh-Madsen T., Christini D. J. (2012). Nonlinear dynamics in cardiology. Annu. Rev. Biomed. Eng. 14, 179–203. [DOI] [PMC free article] [PubMed] [Google Scholar]
- Lauribe P., Denis E., Nottin R., Coraboeuf E. (1989). Electrical activity of human atrial fibres at frequencies corresponding to atrial flutter. Cardiovasc. Res. 23, 159–168. [DOI] [PubMed] [Google Scholar]
- Lee P., Klos M., Bollensdorff C., Hou L., Ewart P., Kamp T. J., Zhang J., Bizy A., Guerrero-Serna G., Kohl P., et al. (2012). Simultaneous voltage and calcium mapping of genetically purified human induced pluripotent stem cell-derived cardiac myocyte monolayers. Circ. Res. 110, 1556–1563. doi: 10.1161/CIRCRESAHA.111.262535 [DOI] [PMC free article] [PubMed] [Google Scholar]
- Lian X., Zhang J., Azarin S. M., Zhu K., Hazeltine L. B., Bao X., Hsiao C., Kamp T. J., Palecek S. P. (2013). Directed cardiomyocyte differentiation from human pluripotent stem cells by modulating Wnt/β-catenin signaling under fully defined conditions. Nat. Protocols 8, 162–175. [DOI] [PMC free article] [PubMed] [Google Scholar]
- Ma J., Guo L., Fiene S. J., Anson B. D., Thomson J. A., Kamp T. J., Kolaja K. L., Swanson B. J., January C. T. (2011). High purity human-induced pluripotent stem cell-derived cardiomyocytes: Electrophysiological properties of action potentials and ionic currents. Am. J. Physiol. Heart Circ. Physiol. 301, H2006–H2017. [DOI] [PMC free article] [PubMed] [Google Scholar]
- Mironov S., Jalife J., Tolkacheva E. G. (2008). Role of conduction velocity restitution and short-term memory in the development of action potential duration alternans in isolated rabbit hearts. Circulation 118, 17–25. [DOI] [PMC free article] [PubMed] [Google Scholar]
- Nguyen N., Nguyen W., Nguyenton B., Ratchada P., Page G., Miller P. E., Ghetti A., Abi-Gerges N. (2017). Adult human primary cardiomyocyte-based model for the simultaneous prediction of drug-induced inotropic and pro-arrhythmia risk. Front. Physiol. 8, 1073. [DOI] [PMC free article] [PubMed] [Google Scholar]
- Schocken D., Stohlman J., Vicente J., Chan D., Patel D., Matta M. K., Patel V., Brock M., Millard D., Ross J., et al. (2018). Comparative analysis of media effects on human induced pluripotent stem cell-derived cardiomyocytes in proarrhythmia risk assessment. J. Pharmacol. Toxicol. Methods 90, 39–47. [DOI] [PubMed] [Google Scholar]
- Sharma A., Burridge P. W., McKeithan W. L., Serrano R., Shukla P., Sayed N., Churko J. M., Kitani T., Wu H., Holmström A., et al. (2017). High-throughput screening of tyrosine kinase inhibitor cardiotoxicity with human induced pluripotent stem cells. Sci. Transl. Med. 9, eaaf2584. [DOI] [PMC free article] [PubMed] [Google Scholar]
- Stockbridge N., Morganroth J., Shah R. R., Garnett C. (2013). Dealing with global safety issues. Drug Saf. 36, 167–182. [DOI] [PubMed] [Google Scholar]
- Strauss D. G., Gintant G., Li Z., Wu W., Blinova K., Vicente J., Turner J. R., Sager P. T. (2018). Comprehensive in vitro proarrhythmia assay (CiPA) update from a cardiac safety research consortium/health and environmental sciences institute/FDA meeting. Ther. Innov. Regul. Sci. 53, 519–525. [DOI] [PubMed] [Google Scholar]
- Tse G., Wong S. T., Tse V., Lee Y. T., Lin H. Y., Yeo J. M. (2016). Cardiac dynamics: Alternans and arrhythmogenesis. J. Arrhythm. 32, 411–417. [DOI] [PMC free article] [PubMed] [Google Scholar]
- Wit A. L., Rosen M. R. (1983). Pathophysiologic mechanisms of cardiac arrhythmias. Am. Heart J. 106, 798–811. [DOI] [PubMed] [Google Scholar]
- Zhang J., Tao R., Campbell K. F., Carvalho J. L., Ruiz E. C., Kim G. C., Schmuck E. G., Raval A. N., da Rocha A. M., Herron T. J., et al. (2019). Functional cardiac fibroblasts derived from human pluripotent stem cells via second heart field progenitors. Nat. Commun. 10, 2238. [DOI] [PMC free article] [PubMed] [Google Scholar]
- Zipes D. P. (1975). Electrophysiological mechanisms involved in ventricular fibrillation. Circulation 52, III120-130. [PubMed] [Google Scholar]
Associated Data
This section collects any data citations, data availability statements, or supplementary materials included in this article.


