Figure 4.
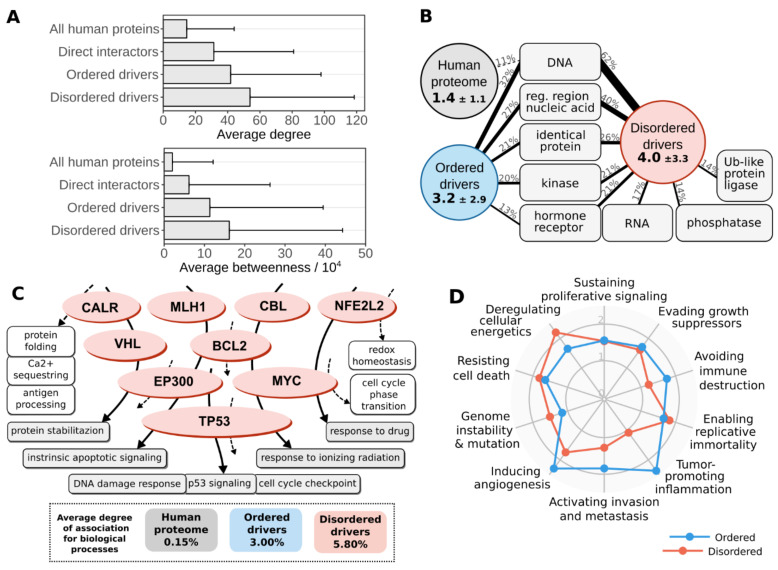
Characteristics of cancer drivers at the network/pathway and cellular levels. (A) Average degree (top) and betweenness (bottom) of all human proteins, showing the direct interaction partners of drivers, ordered drivers and disordered drivers. (B) The average occurrence of various types of interaction partners for the whole human proteome (grey circle), ordered drivers (blue circle) and disordered drivers (red circle). Values in circles show the average number of types of interactions together with standard deviations. The most common interaction types are shown in grey boxes, with connecting lines showing the fraction of proteins involved in that binding mode. Only interaction types present for at least 1/8th of the proteins are shown. (C) Top: An example subset of disordered drivers with associated biological processes marked with arrows (dashed and solid arrows marking processes involving only one or several disordered drivers). Bottom: Average values of overlap between protein sets of various biological processes, considering the full human proteome (grey), ordered drivers (blue) and disordered drivers (red). Process names in grey represent processes that involve at least two disordered drivers, names in white boxes mark other processes attached to disordered drivers. (D) Overrepresentation of hallmarks of cancer for ordered (blue) and disordered (red) drivers compared to all census drivers.

