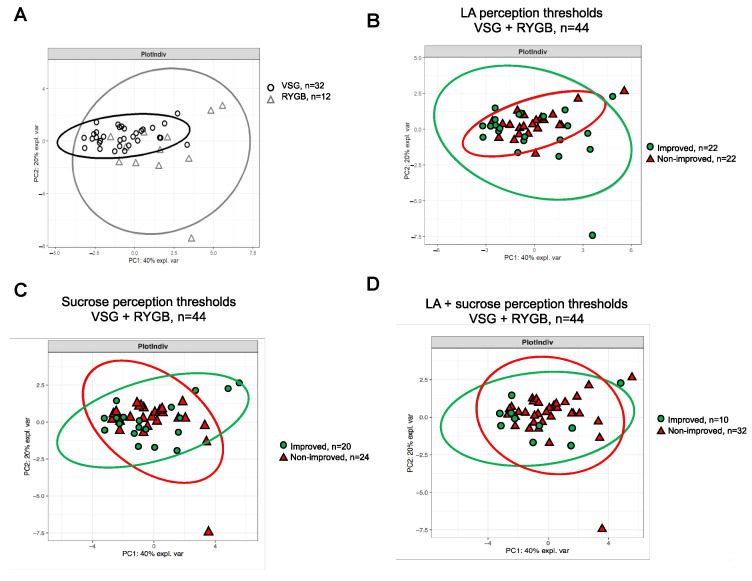
Figure 5.
Principal component analysis (PCA) of gut hormones (i.e., insulin, GLP-1, PYY and Ghrelin) response to a test meal 6 months after surgery, as well as confidence ellipse analysis. (A) Comparison of VSG and RYGB patients. (B) Comparison of patients (VSG + RYGB) with and without improvement (improved vs. nonimproved) of the LA perception threshold. (C) Comparison of patients (VSG + RYGB) with and without improvement (improved vs. nonimproved) of the sucrose perception threshold. (D) Comparison of patients (VSG + RYGB) with and without improvement (improved vs. nonimproved) of the LA+ sucrose perception threshold.

