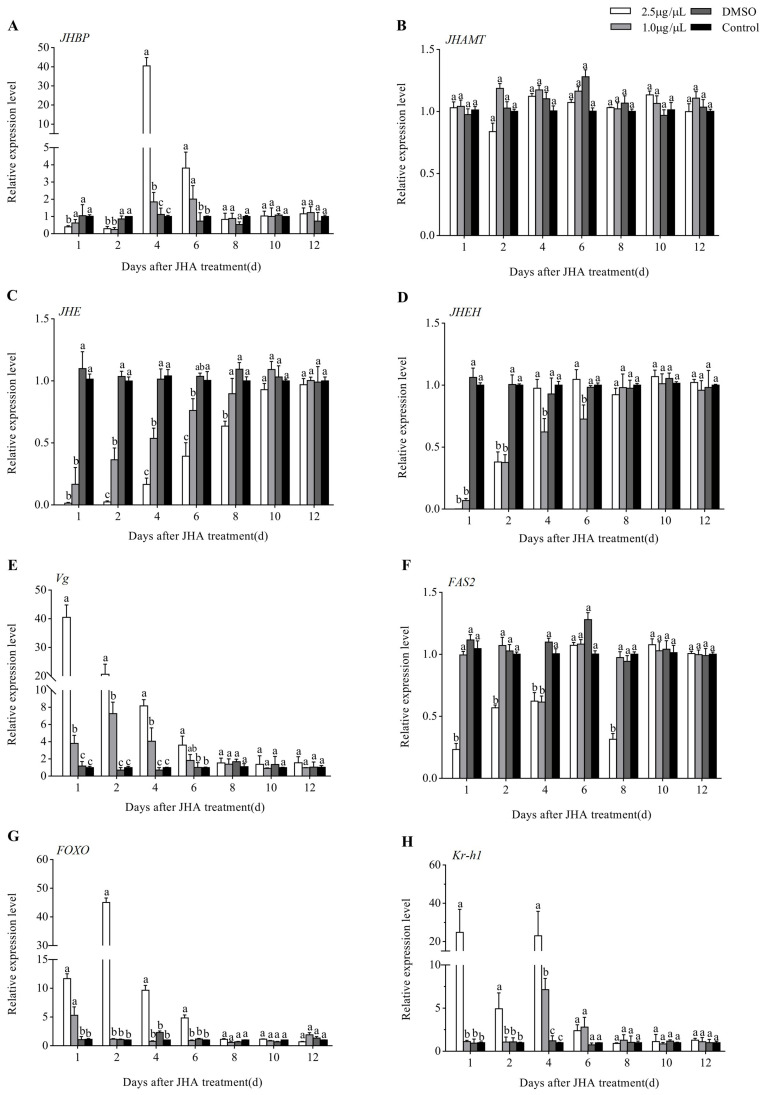
Figure 5.
Expression profiles of 8 JH signaling-related genes after JHA application at 3 days post-eclosion. Different letters above the columns indicate significant difference among different treatments at the same time at p < 0.05 (Tukey’s HSD test). (A): JHBP; (B): JHAMP; (C): JHE; (D): JHEH; (E): Vg; (F): FAS2; (G): FOXO; (H): Kr-h1.

