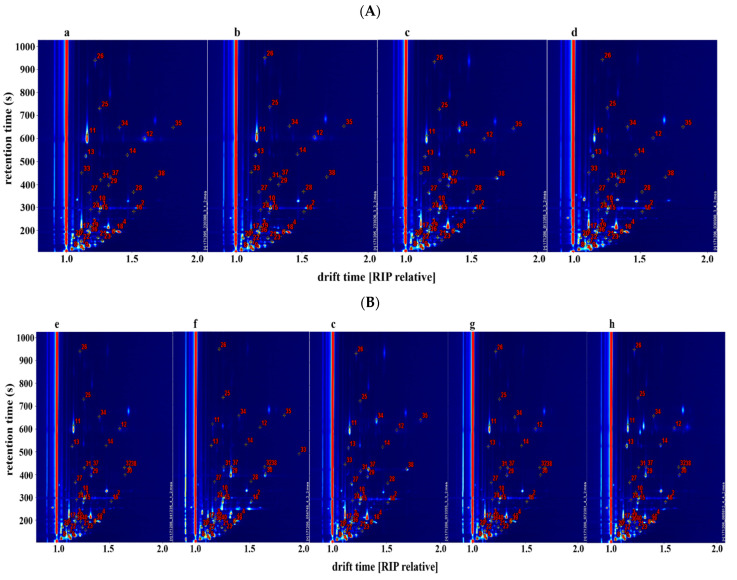
Figure 1.
Topographic plots of GC–IMS spectra with the selected markers obtained from T. matsutake samples at different frying temperatures (A) and frying times (B): (a) 100 °C, 80 s; (b) 120 °C, 80 s; (c) 160 °C, 80 s; (d) 200 °C, 80 s; (e) 160 °C, 40 s; (f) 160 °C, 60 s; (g) 160 °C, 100 s; and (h) 160 °C, 120 s. The numbers correspond to the identified signals.

