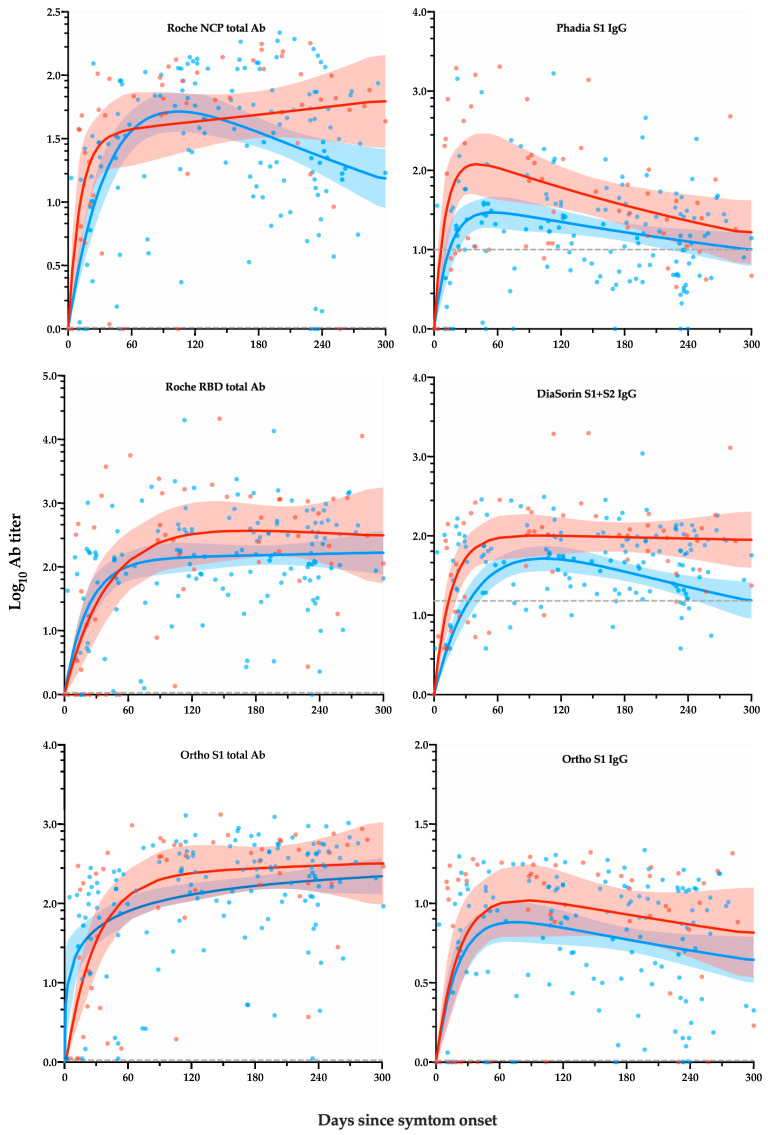
Figure 1.
Level of antibody response by days after symptom onset according to severity. Depending on the assay and/or the population considered, a rapid increase in antibody titers was observed followed by a plateau phase or a decrease phase. Blue curves (and 95% CI) and points represent non-hospitalized patients. Red curves (and 95% CI) and points represent hospitalized patients. The dotted grey line corresponds to the manufacturer’s cut-off for positivity.

