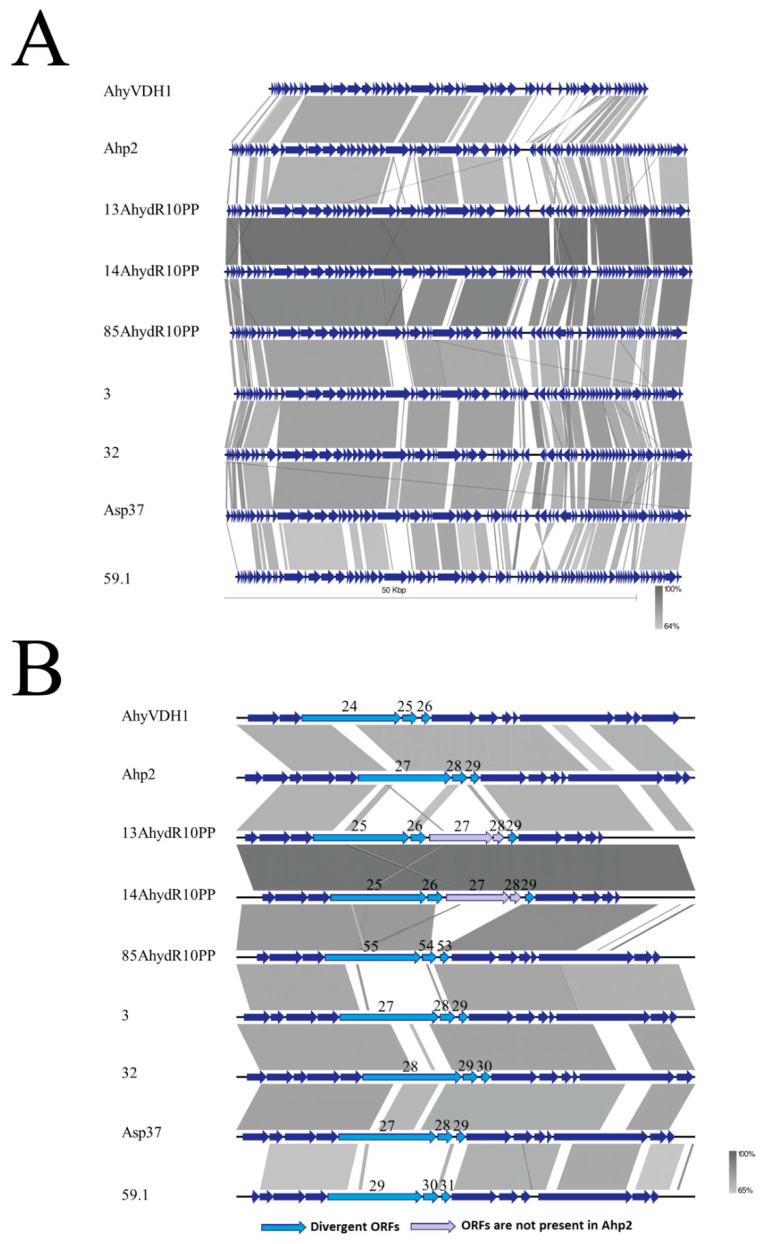
Figure 4.
Comparison of the phage genomes. (A) The whole genome and (B) the region containing the ORF27-ORF29 orthologs are illustrated and compared. The genomes of Ahp2 and A. hydrophila phages (AhyVDH1, 13AhydR10PP, 14AhydR10PP, 85AhydR10PP) and A. salmonicida phages (3, 32, Asp37, 59.1) were aligned and compared using EasyFig. The identity cutoff was 64%. Number indicates the ORF number of the phages.

