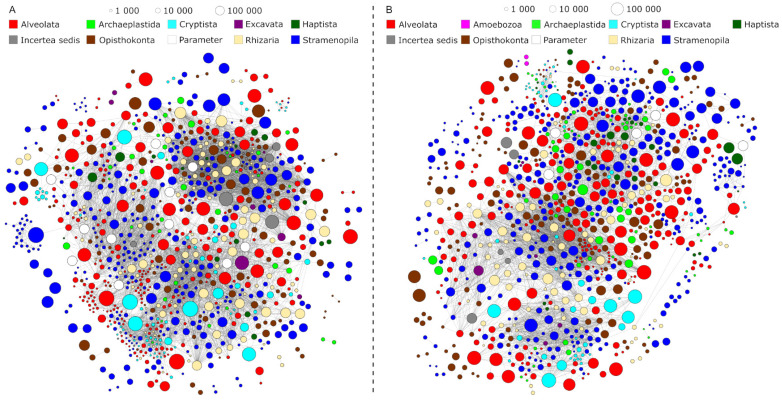
Figure 3.
Seasonal protistan plankton co-occurrence networks. Panel (A) shows the cold season network, panel (B) the warm season network. Each node represents one network sequence cluster (NSC). Two nodes are connected by an edge if they were significantly co-occurring in the three-year time-series dataset of Lake Zurich. Node colors reflect the taxonomic assignment of NSCs on higher taxonomic levels. Node sizes reflect the read abundance of NSCs in the metabarcoding dataset.

