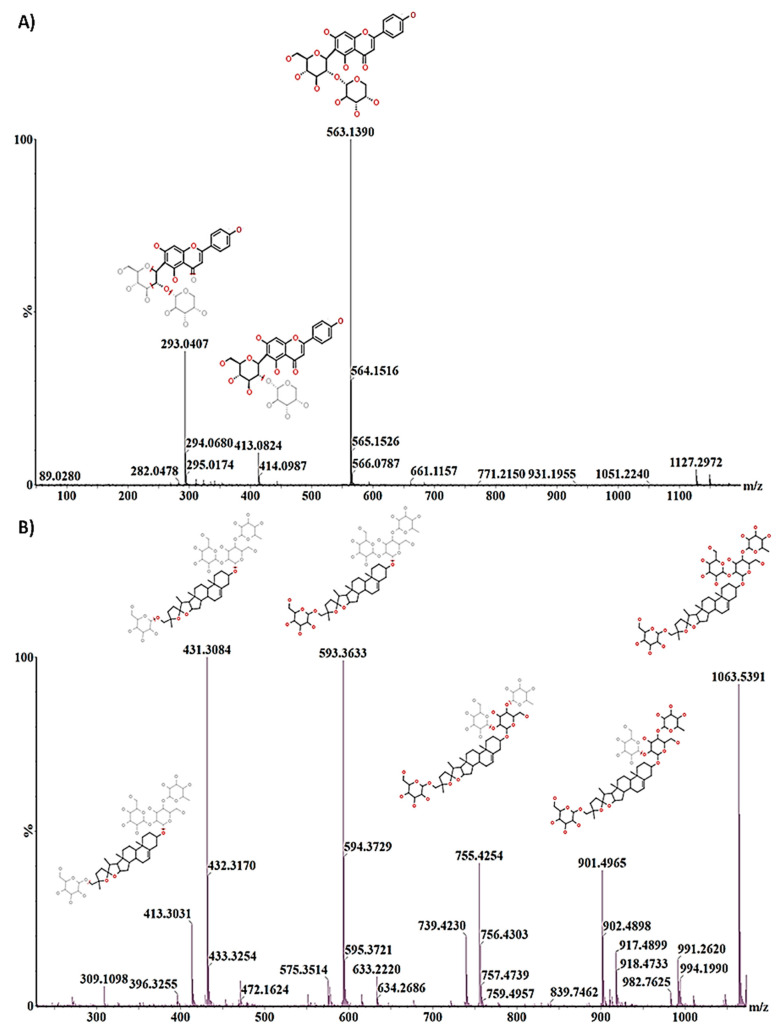
Figure 5.
Representation of the use of fragmentation patterns for the annotation of secondary metabolites. (A) Isovitexin 2″-O-arabinoside showing the parent ion at m/z 563 and two diagnostic fragment ions at m/z 413 and 293. (B) Avenacoside A at an m/z of 1063 showing diagnostic fragments (m/z 901, 755, 593, 431 and 413) with their structural changes that aid in the structural identification of the metabolite. The fragmentation spectra enable confirmation of the elemental composition and provide useful hints to elucidate possible structural information by evaluating fragmentation patterns yielded at different collision energies, MSE.

