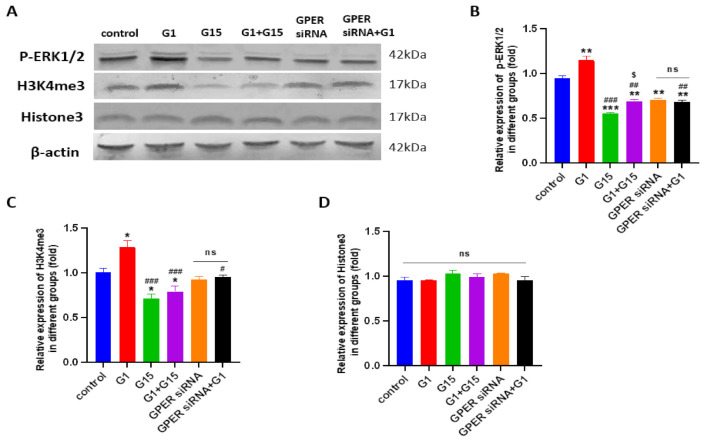
Figure 10.
The levels of p-ERK1/2 and H3K4me3 and Histone 3 in the Caov4 cell line were detected by Western blot analysis. (A) The Caov4 cells were treated by 1 μM G1, 1 μM G15, 1 μM G1 + 1 μM G15, GPER siRNA with vehicle and GPER siRNA + G1 for 24 h. Histograms illustrate the ratio of (B) p-ERK1/2, (C) H3K4me3 and (D) Histone3. β-actin was used as the loading control. The results are presented as the mean ± SEM of three independent experiments (n = 3). Data were calculated by one-way ANOVA (ns p > 0.05, * p < 0.05, ** p < 0.01, *** p < 0.001 vs. control; # p < 0.05, ## p < 0.01, ### p < 0.001 vs. G1 group; $ p < 0.05 vs. G15 group).

