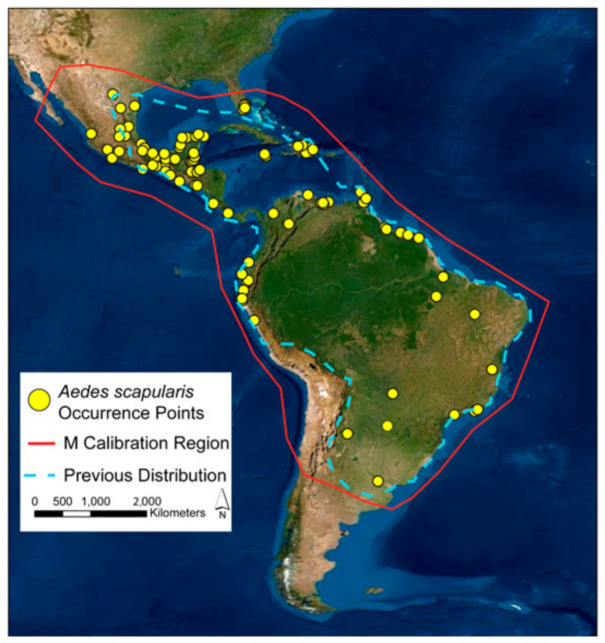
Figure 1.
Distribution of Aedes scapularis georeferenced occurrence points used in model calibration and evaluation (yellow points); red polygon represents the M calibration region. Blue, hashed-line polygon indicates previously recognized distribution of Ae. scapularis, redrawn from Arnell (1976). Base map provided by Environmental Systems Research Institute.

