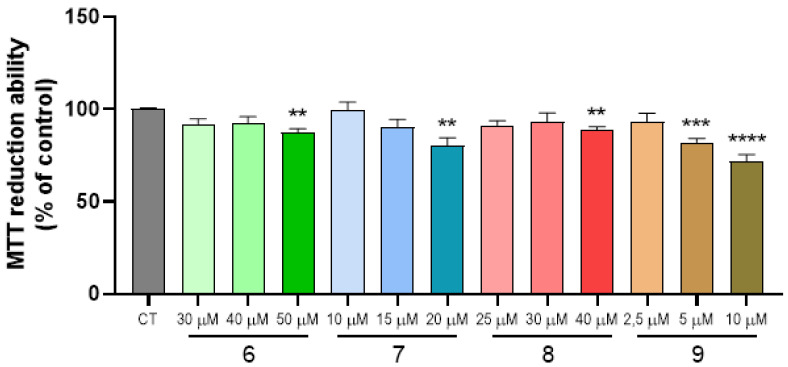
Figure 2.
Dose-response screening of compounds 6–9 on SH-SY5Y neuronal cell line. SH-SY5Y cells were treated with varying concentrations of compounds from 2.5 μM to 50 μM for 24 h and cellular viability was measured by using the MTT reduction assay. Results are expressed relatively to SH-SY5Y untreated cells, with the mean ± SEM derived from at least three different experiments. ** p < 0.01, *** p < 0.001, **** p < 0.0001 significantly different when compared with control, untreated SH-SY5Y cells.

