

ABSTRACT
Background
Non-communicable diseases (NCDs) are increasingly prevalent and were responsible for 40.5 million deaths (71%) globally in 2016. We examined the number of NCD-related emergency hospital admissions during the years 1998 to 2018 in the UK.
Methods
Demographic features for those admitted as an emergency with NCDs as their primary diagnosis were collated for all admissions in England, Wales and Scotland. NCDs recorded as secondary diagnoses for all admissions in England from 2012 to 2018 were additionally recorded.
Results
We identified 120,662,155 emergency episodes of care. From 1998 to 2018 there was an increase from 1,416,233 to 1,892,501 in annual emergency admissions due to NCDs. This, however, represented a fall in the proportion of NCD among all emergency admissions, from 33.4% to 26.9%. Mean age of all patients admitted increased from 46.3 to 53.8 years.
Conclusion
Despite a fall in proportion of NCD admissions, the population acutely admitted to hospital was increasingly elderly and increasingly comorbid.
KEYWORDS: non-communicable diseases, emergency admissions, ageing, multimorbidity, ICD-10
Introduction
Globally and in the UK and NHS, we face a series of complex challenges in anticipating demands for care as the population ages.1,2 Non-communicable diseases (NCDs) are chronic conditions that are a result of genetic, physiological, environmental and behavioural factors, which are increasingly prevalent with older age. Worldwide, they cause 41 million deaths, making up 71% of all deaths worldwide.3 In the UK, an estimated 89% of deaths are due to NCDs.4 A key development target of the World Health Organization (WHO) is to reduce mortality from NCDs by 25% by 2025.3,5 An increasing burden of disease due to NCDs has been demonstrated in a wide variety of conditions including neurological disability, musculoskeletal disease, obesity, diabetes and cancer.6–10 However, it is not clear how the increasing burden of NCDs translates into emergency and inpatient healthcare usage. Specifically, it is uncertain if emergency admissions in these populations are for treatment of their primary NCD or alternative diagnoses, and how NCDs complicate or predispose to other acute diseases, affecting patient outcomes.11 While the prevalence of individual NCDs is known to be increasing, the combined burden of NCDs in those admitted to secondary care has not been described. NCDs are a major contributor to the population living with multiple long-term conditions (multimorbidity), this is a growing population and recent focus of the National Institute for Health Research (NIHR).12 Using aggregated, national data from the UK NHS, we examined trends in emergency admissions due to NCDs and the burden of NCDs as secondary diagnoses within admissions in general.
Methods
Study design
This was a time-trend ecological study. Ecological studies explore diseases and outcomes in temporally or geographically defined populations. We explored the prevalence of NCDs, infectious diseases and other diagnostic codes within England, Scotland and Wales over the period 1998–2018. This study used anonymised aggregated national summary data on admitted patient care taken from Hospital Episode Statistics (HES) data produced by NHS Digital for England, SMR01 data from the Information Services Division (ISD) for Scotland and Patient Episode Database for Wales (PEDW) produced by NHS Wales Informatic Service.13 A prospective statistical analysis plan was developed.14
Data sources
Data were available from NHS Digital for England from 1998–2018, NHS Wales for Wales from 1999–2018 and ISD for Scotland from 1998–2018.15–17 Where possible, data from England, Scotland and Wales were aggregated for analysis (see supplementary material S1). During a single admission, multiple episodes of care are possible if a patient is transferred between different specialty teams. As a reference for the overall demographic trends in the population, we used Office for National Statistics (ONS) data that describes the age demographics of the population over the same period.18
Exposure
International Statistical Classification of Diseases and Related Health Problems, 10th revision (ICD-10) codes defining NCDs of interest were derived from WHO ICD-10 categories: cancer, cardiovascular disease, respiratory, diabetes mellitus, and digestive system including liver cirrhosis.3 In addition, NCD groups causing the greatest burden of mortality and morbidity in the Global Burden of Disease study were also identified and selected (supplementary material S1, Table S3). Finally chronic kidney disease (CKD) was also recorded as an NCD as an additional significant comorbid disease not already captured in our mapping.16,17 For comparison, admissions related to infectious diseases were defined based on published ICD-10 codes.21 Other ICD-10 codes that were neither NCDs nor infectious were also investigated.
Data processing
Data for number of episodes of care, number of emergency episodes of care and age profile for each primary diagnosis ICD-10 code for the years 1998–2018 were extracted and grouped into NCD, Infectious and Other as described (supplementary material S1). Mean estimates of age were calculated for each category for each year and compared to general population age profile from ONS values. In English data from 2012–2018, we assessed mean number of NCDs as secondary diagnoses subtracting the number of times each NCD ICD-10 code was a primary diagnosis from the total number of times that code is recorded in all admissions, allowing calculation of the average number of NCDs recorded per admission as a non-primary diagnosis.
Analysis
Data was analysed in R (R Core Team).22 Where appropriate, both raw data for the number of episodes of care and number of emergency episodes are presented as well as data normalised per 100,000 of the population or age group. Linear models with 95% confidence intervals (CI) were plotted to demonstrate trends in the data with individual yearly figures plotted as discrete points. As the age data were in aggregated, age bands we are unable to present standard deviations. The ICD-10 coded diseases causing the most emergency episodes of care in the NCD, infectious aetiology and all other codes groupings are presented as bar charts with a fixed scale for comparison.
Results
Episode selection
All episodes of care for which the number of emergency admissions and the mean age of patients was recorded were included (supplementary material S1). Age data were missing for 0.04% of episodes and these corresponding ICD-10 codes were also excluded. In total, data from 351,069,997 episodes of patient care were considered from England, Scotland and Wales across the 20 year period, from which, we analysed 120,662,155 emergency episodes.
Emergency admissions due to NCDs
Total emergency episodes of care increased from 4,241,740 in 1998 to 7,035,449 in 2018, a 65.9% increase. Emergency episodes of care due to NCDs increased from 1,416,233 to 1,892,501, representing a 33.6% increase, however, the proportion of emergency admissions for which NCDs were coded as the primary diagnosis decreased from 33.4% to 26.9% (Table 1; Fig 1; supplementary material S1). Emergency episodes of care due to infectious causes increased from 758,909 to 1,939,085, representing a 155.5% increase over the same time period.
Table 1.
Emergency admissions to hospitals in England, Scotland and Wales
| Year | Total emergency episodes of care | NCDs | Proportion due to NCDs | Infectious | Other |
|---|---|---|---|---|---|
| 1998 | 4,241,740 | 1,416,233 | 33.4 | 758,909 | 2,066,598 |
| 1999 | 4,624,203 | 1,524,400 | 33.0 | 829,957 | 2,269,846 |
| 2000 | 4,646,676 | 1,506,015 | 32.4 | 830,138 | 2,310,523 |
| 2001 | 4,695,901 | 1,502,037 | 32.0 | 857,165 | 2,336,699 |
| 2002 | 4,748,396 | 1,528,421 | 32.2 | 870,300 | 2,349,675 |
| 2003 | 4,955,793 | 1,553,018 | 31.3 | 925,579 | 2,477,196 |
| 2004 | 5,226,327 | 1,615,895 | 30.9 | 968,778 | 2,641,654 |
| 2005 | 5,474,088 | 1,657,871 | 30.3 | 1,038,961 | 2,777,256 |
| 2006 | 5,539,096 | 1,661,962 | 30.0 | 1,065,425 | 2,811,709 |
| 2007 | 5,596,348 | 1,653,469 | 29.6 | 1,095,035 | 2,847,844 |
| 2008 | 5,878,047 | 1,714,978 | 29.2 | 1,171,721 | 2,991,348 |
| 2009 | 6,044,766 | 1,742,348 | 28.8 | 1,218,905 | 3,083,513 |
| 2010 | 6,154,817 | 1,754,518 | 28.5 | 1,303,949 | 3,096,350 |
| 2011 | 6,103,373 | 1,742,428 | 28.6 | 1,313,939 | 3,047,006 |
| 2012 | 6,227,489 | 1,708,109 | 27.4 | 1,520,873 | 2,998,507 |
| 2013 | 6,323,329 | 1,723,921 | 27.3 | 1,538,055 | 3,061,353 |
| 2014 | 6,544,362 | 1,780,540 | 27.2 | 1,665,661 | 3,098,161 |
| 2015 | 6,700,962 | 1,828,843 | 27.3 | 1,767,899 | 3,104,220 |
| 2016 | 6,840,286 | 1,863,312 | 27.2 | 1,879,997 | 3,096,977 |
| 2017 | 7,060,027 | 1,908,126 | 27.0 | 1,990,743 | 3,161,158 |
| 2018 | 7,035,449 | 1,892,501 | 26.9 | 1,939,085 | 3,203,863 |
Wales data unavailable for 1998 and 2018. NCDs = non-communicable diseases.
Fig 1.

Change in absolute number of emergency episodes of care due to infectious, non-communicable disease and other ICD-10 codes with total emergency episodes of care 1998–2018. ICD-10 = International Statistical Classification of Diseases and Related Health Problems, 10th revision; NCD = non-communicable disease.
Primary diagnosis ICD-10 codes
The NCD code associated with most emergency episodes of care in 2018 was chronic obstructive pulmonary disease (COPD; 208.4 emergency episodes of care per 100,000). Pneumonia was the most common infectious diseases code employed in emergency episodes of care, causing 399.6 per 100,000 in 2018. Chest or throat pain was the most frequent code that appeared in neither the NCD nor infectious category, associated with 413.4 emergency episodes of care per 100,000 in 2018. The top five codes for each category are presented in Table 2 (supplementary material S1: Table S5, Fig S6).
Table 2.
The five non-communicable diseases, infectious diseases and other diagnoses causing the greatest number of emergency admissions in Scotland and England in 2018–2019
| Emergency admissions | Emergency admissions per 100,000 | |
|---|---|---|
| ICD-10 code: NCDs | ||
| J44 Other chronic obstructive pulmonary disease | 127,994 | 208.41 |
| M79 Other soft tissue disorders not elsewhere classified | 79,789 | 129.92 |
| I50 Heart failure | 75,584 | 123.07 |
| I21 Acute myocardial infarction | 74,331 | 121.03 |
| I48 Atrial fibrillation and flutter | 67,286 | 109.56 |
| ICD-10 code: Infectious | ||
| J18 Pneumonia organism unspecified | 245,401 | 399.58 |
| N39 Other disorders of urinary system including infection | 158,697 | 258.4 |
| A41 Other septicaemia | 136,623 | 222.46 |
| J22 Unspecified acute lower respiratory infection | 122,075 | 198.77 |
| B34 Viral infection of unspecified site | 112,735 | 183.56 |
| ICD-10 code: Other | ||
| R07 Pain in throat and chest | 253,904 | 413.42 |
| R10 Abdominal and pelvic pain | 246,009 | 400.57 |
| R69 Unknown and unspecified causes of morbidity | 83,685 | 136.26 |
| R29 Other symptoms and signs involving nervous and musculoskeletal systems | 75,287 | 122.59 |
| R55 Syncope and collapse | 71,070 | 115.72 |
ICD-10 = International Statistical Classification of Diseases and Related Health Problems, 10th revision; NCDs = non-communicable diseases.
Age profile of NCD admissions
The number of episodes of care per 100,000 people with NCDs as a primary diagnosis for different age groups showed an increase in all ages other than the 0–14 years age group (Fig 2a). The growth of NCD-associated episodes of care showed linear trends for all age groups, with the over 75 years age group increasing most rapidly from 26,461 per 100,000 (of population aged over 75 years) to 42,981 per 100,000, representing a 62.4% increase. When examining absolute numbers of episodes of care, the 15–59 years age bracket accounted for the largest number of episodes (2,703,070 episodes; 37.4% of all NCD associated episodes; Fig 2b).
Fig 2.

Number of episodes of care due to non-communicable diseases. a) Change, split into four age bands. b) Total number, split by four age bands without normalisation.
All cause emergency hospital admission age increased 7.5 years from 46.3 years to 53.8 years. This increase was greater in those with an infection-related admission (44.8 years to 55.7 years; an increase of 10.9 years) as opposed to an NCD-related admission (57.1 years to 60.5years; an increase of 3.4 years). Over the same period, the national population mean age increased from 38.3 years to 40.2 years (an increase of 1.9 years; Fig 3).
Fig 3.
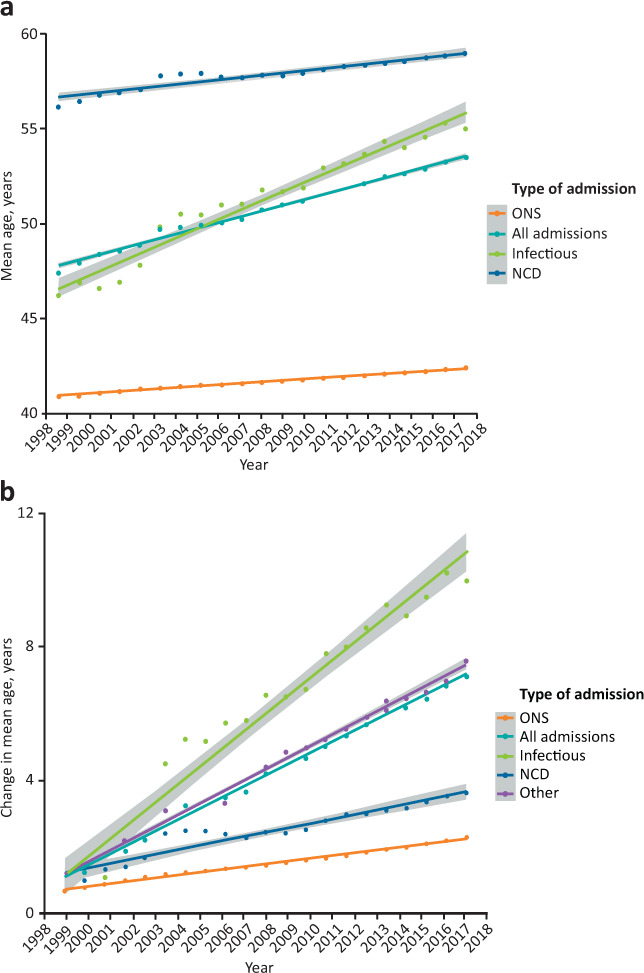
Age of the population admitted to hospital for infectious diagnoses, NCDs and all those admitted for any reason. a) Mean age, the increase in the ONS recorded mean age of the general population is also plotted for comparison. b) Change in the mean age compared with the index year (1998). ONS = Office for National Statistics general population; NCD = non-communicable disease.
Number of NCDs recorded as non-primary diagnoses
The number of NCDs were coded as secondary diagnoses per episode increases in all age groups other than 0–14 years. Those aged over 75 years saw the largest increase, with a mean number of 2.3 NCD-related ICD-10 codes per admission in 2012 and 3.1 codes recorded per admission in 2018 (Fig 4).
Fig 4.

Mean number of secondary non-communicable disease diagnostic codes recorded per admission for four age categories.
Discussion
NCDs remain a significant cause of emergency admissions to hospital in the UK responsible for 26.9% of admissions and the absolute numbers of emergency admissions associated with NCDs have increased by 33.6% to 1,892,501 in the last 20 years. The proportion of emergency admissions attributed to NCDs has decreased. The category with the greatest increase in absolute number and proportion of emergency admissions was neither infectious nor NCD codes but ‘Other’ diagnostic codes. These ‘Other’ codes tended to represent non-specific presentations of symptoms without a definitive diagnosis (for example, chest pain or abdominal/pelvic pain). This increase could either represent a greater burden of unclear presentations, in an increasingly ageing and complex cohort, social factors precipitating admission, or poor coding practice. To give context to how these ICD-10 codes are currently interpreted in NHS planning, the mapping to the Summary Hospital Mortality Indicator (SHMI) for the most common codes is included in supplementary material S1: Table S5.2. Here, it becomes apparent that some groupings are over inclusive or too specific. There is ambiguity about which category ICD-10 codes are best allocated, highlighting known issues when attempting to aggregate together increasingly granular data.
Those admitted with NCDs were the oldest of the three groups throughout the study period, with a mean age of 57.1 years in 1998 increasing by 3.4 years to 60.5 years by 2018. However, this increase was less than the 7.5-year increase seen in the overall hospital population. It was also significantly less than the 10.9-year increase in the mean age of those with primarily infectious diseases, and closer to the national mean age increase of 1.9 years. This suggests the cohort admitted with primarily NCD pathology are an older group of patients but are not rapidly increasing in age. Given that the number of comorbid NCDs recorded per admission has increased for all ages, but most rapidly in the >75 years population, this raises the possibility that much of the NCD burden is felt not necessarily in primary presentations but predisposition to infection or presentation with non-specific complaints reflected by ‘Other’ primary diagnoses.
NCDs representing a decreasing proportion of admissions in combination with having a mean age increase similar to the national mean increase suggests that, broadly, outpatient management of NCDS (be it primary and secondary care) has been successful in reducing the burden of emergency admissions from NCDS.
Comorbidity and the associated phenomenon of multimorbidity, where patients have two or more co-existing long-term conditions, is a poorly understood topic with wide reaching implications for health service structure and provision. The growth of multimorbidity is intrinsically linked with an ageing population.23 Those aged over 65 years are most commonly found to be multimorbid with 54% in the UK having two or more comorbidities in 2015 and this is projected to increase to 68% by 2035.24 Our results demonstrate that those in the >75 years age bracket had the greatest number of comorbidities with, on average, more than three NCDs recorded as secondary diagnoses at every episode of care. This group also saw the largest increase in comorbidities during the study period, with an 0.9 additional NCD codes recorded per admission. The increasing prevalence of comorbidities and non-specific presentations to emergency care are evidence of an increasingly complex patient cohort. This supports the assertion by the chief medical officer that to effectively manage patients with multimorbidity we need a concerted effort from medical schools to royal colleges to train doctors to be able to manage patients with clusters of conditions and take a holistic generalist approach, appreciating the significant interplay between related non-communicable conditions.25
This study has several strengths, it covered the overwhelming majority of emergency hospital admissions in three nations over a 20-year period. We followed a predefined statistical analysis plan, and used groupings of ICD-10 codes that were robustly defined from pre-existing mappings. Additionally, national summary statistics on the general population were used to allow values to be scaled appropriately and be comparable.
However, this study did rely heavily on aggregated data and we were unable to explore patient level associations. While this allowed for hundreds of millions of care episodes to be collated, lack of granularity of the data thus limits inferences that can be made about individual patient groups. In particular, although we can demonstrate changes in the number of comorbidities on a population level, we are unable to comment on how comorbidities are clustered and associated with individuals. While the increasing comorbidity prevalence rates are largely in agreement with existing literature, this could also reflect changing clinical coding accuracy. Additionally, our dataset lacked linkage outcome data that would allow NCDs and comorbidities to be correlated with survival. As well as trends in health and healthcare within the UK population, changes in coding practices could also account for some of our findings. For example, the code ‘K52 Unspecified Colitis’ has seen drastically reduced usage after central government advice that it was being used inappropriately.26 To minimise the effect of changes in coding practice and because some conditions may be encoded in several different ways, broader groups of ICD-10 categories were used. However, this reduces the granularity with which individual conditions can be examined. Lastly, the coding of ‘Others’ limits the utility of national databases to be examined with greater granularity, and will affect all such analyses in the future, unless coding practice changes.
A further consideration when interpreting the findings of our study is the impact of COVID-19 both in the short and long term. COVID-19 has led to over 135,000 acute hospital admissions to from February to September 2020 and will contribute to a significant increase in infectious admissions.27 How it contributes to long-term admissions remains to be seen and depends on numerous factors, including whether there is endemic COVID-19 transmission following the pandemic and if a vaccine can be successfully developed and deployed. There is also the emerging phenomenon of ‘long COVID’, describing a range of sequalae following infection (including fatigue, shortness of breath and chest pain), these symptoms may result in further increases in non-specific presentations to hospital.28–30 How these are coded will clearly affect the burden of NCDs recorded but it would seem likely that post-infectious sequalae are likely to be considered non-communicable in the same manner that post-rheumatic heart failure is currently.
Future work directions should focus on the patterns of comorbidity and NCD accumulation with older age at an individual level, how these NCDs relate to other emergency presentations and how comorbid diseases are then related to patient-episode outcomes, in line with calls research priorities in multimorbidity identified by the Chief Medical Officer for England and the Chair of the UK Medical Research Council.31
Conclusion
While the number of emergency admissions are increasing, in an ageing population, the majority of this increase is primarily related to infections or non-specific presentations. Emergency presentations primarily due to NCDs have decreased over time, potentially as a result of successful ambulatory care. Secondary diagnoses of NCD are increasingly common with older age and it is likely that these contribute indirectly to risk of admission of other primary causes including infection.
Summary
| What is known? |
| Currently NCDs are a leading cause of death in the UK. There is also an increasing prevalence of NCDs in an ageing population. |
| What is the question? |
| What proportion of emergency admissions are attributed to NCDs and what diseases are the leading causes? What are the demographics of those admitted with NCDs changing and how is the prevalence of multiple long-term diseases changing? |
| What was found? |
| The number of emergency admissions due to NCDs is increasing but they account for a smaller proportion of emergency admissions than 20 years ago. The biggest growth has been in admissions coded as non-specific symptoms without a definitive diagnosis. NCDs are increasingly prevalent in the older population and the incidence of multiple long-term diseases is increasing. |
| What is the implication for practice now? |
| This falling proportion of admissions coded as NCD-related may represent improving outpatient and ambulatory management of NCDs but admissions data reveals a new group of poorly understood patients often without a definitive diagnosis recorded. |
Supplementary material
Additional supplementary material may be found in the online version of this article at www.rcpjournals.org/clinmedicine:
S1 – Additional data for emergency hospital admissions associated with non-communicable diseases.
Conflicts of interest
Rupert M Pearse has given lectures and/or performed consultancy work for Intersurgical, GlaxoSmithKline and Edwards Lifesciences, and holds editorial roles with British Journal of Anaesthesia, British Journal of Surgery and BMJ Quality and Safety. Zudin Puthucheary has received honoraria for consultancy from GlaxoSmithKline, Lyric Pharmaceuticals, Faraday Pharmaceuticals and Fresenius-Kabi, and speaker fees from Orion, Nutricia and Nestle. John R Prowle has received grant and/or research support from bioMérieux, consulting fees from Quark Pharmaceutical and Medibeacon, and speaker's honoraria from Nikkiso Europe, Baxter, BBraun Medical, Fresenius Medical Care and Fresenius-Kabi UK.
References
- 1.World Health Organization . Deaths from NCDs. WHO, 2018. [Google Scholar]
- 2.Office for National Statistics . English Life Tables No.17: 2010 to 2012. ONS, 2015. www.ons.gov.uk/peoplepopulationandcommunity/birthsdeathsandmarriages/lifeexpectancies/bulletins/englishlifetablesno17/2015-09-01 [Accessed 04 May 2020]. [Google Scholar]
- 3.World Health Organization . Noncommunicable Diseases: Fact sheets on sustainable development goals: health targets. WHO, 2017. www.euro.who.int/__data/assets/pdf_file/0007/350278/Fact-sheet-SDG-NCD-FINAL-25-10-17.pdf?ua=1 [Google Scholar]
- 4.World Health Organization . Noncommunicable Diseases (NCD) Country Profiles: United Kingdom. WHO, 2018. https://www.who.int/nmh/countries/gbr_en.pdf [Google Scholar]
- 5.World Health Organization . Global status report on noncommunicable diseases 2014. WHO, 2014. [DOI] [PubMed] [Google Scholar]
- 6.Parkinson's UK . The incidence and prevalence of Parkinson's in the UK. Parkinson's UK, 2018. [Google Scholar]
- 7.Parsons S, Symmons DPM. The burden of musculoskeletal conditions. Medicine 2014;42:190–2. [Google Scholar]
- 8.NHS Digital . Statistics on obesity, physical activity and diet, England, 2019. NHS, 2019. https://digital.nhs.uk/data-and-information/publications/statistical/statistics-on-obesity-physical-activity-and-diet/statistics-on-obesity-physical-activity-and-diet-england-2019 [Accessed 10 June 2020]. [Google Scholar]
- 9.Diabetes UK . Facts & figures. Diabetes UK. www.diabetes.org.uk/professionals/position-statements-reports/statistics [Accessed 10 June 2020]. [Google Scholar]
- 10.Smittenaar CR, Petersen KA, Stewart K, Moitt N. Cancer incidence and mortality projections in the UK until 2035. Br J Cancer 2016;115:1147–55. [DOI] [PMC free article] [PubMed] [Google Scholar]
- 11.Hazra NC, Gulliford M. Evolution of the ‘fourth stage’ of epidemiologic transition in people aged 80 years and over: population-based cohort study using electronic health records. Popul Health Metr 2017;15:18. [DOI] [PMC free article] [PubMed] [Google Scholar]
- 12.National Institute for Health Research . NIHR artificial intelligence for multiple long-term conditions (AIM): clusters call research specification (finalised). NIHR, 2020. www.nihr.ac.uk/documents/nihr-artificial-intelligence-for-multiple-long-term-conditions-aim-clusters-call-research-specification/24646 [Accessed 14 September 2020]. [Google Scholar]
- 13.NHS Digital . Hospital admitted patient care and adult critical care activity: 2017–18. NHS, 2018. https://files.digital.nhs.uk/B3/DCC543/hosp-epis-stat-admi-summ-rep-2017-18-rep.pdf [Google Scholar]
- 14.Robbins AJ, Fowler AJ, Haines RW, et al. A statistical analysis proposal: Emergency hospital admissions associated with non-communicable diseases 1998-2019: an ecological study. Queen Mary, University of London. [DOI] [PMC free article] [PubMed] [Google Scholar]
- 15.NHS . Monthly hospital activity data. NHS. www.england.nhs.uk/statistics/statistical-work-areas/hospital-activity/monthly-hospital-activity/mar-data [Accessed 09 July 2020]. [Google Scholar]
- 16.Information and Statistics . Annual PEDW data tables. NHS Wales. [Google Scholar]
- 17.ISD Scotland . ISD(S)1 Data Collection. Public Health Scotland. www.isdscotland.org/Products-and-Services/Data-Support-and-Monitoring/ISDS1 [Accessed 03 November 2020]. [Google Scholar]
- 18.Office for National Statistics . Population estimates for UK, England and Wales, Scotland and Northern Ireland. ONS. www.ons.gov.uk/datasets/mid-year-pop-est/editions/time-series/versions/4 [Accessed 26 March 2020]. [Google Scholar]
- 19.de Lusignan S, Tomson C, Harris K, van Vlymen J, Gallagher H. Creatinine fluctuation has a greater effect than the formula to estimate glomerular filtration rate on the prevalence of chronic kidney disease. Nephron Clin Pract 2011;117:c213–24. [DOI] [PubMed] [Google Scholar]
- 20.Couser WG, Remuzzi G, Mendis S, Tonelli M. The contribution of chronic kidney disease to the global burden of major noncommunicable diseases. Kidney Int 2011;80:1258–70. [DOI] [PubMed] [Google Scholar]
- 21.Inada-Kim M, Page B, Maqsood I, Vincent C. Defining and measuring suspicion of sepsis: An analysis of routine data. BMJ Open 2017;7:e014885. [DOI] [PMC free article] [PubMed] [Google Scholar]
- 22.R Core Team . R: A language and environment for statistical computing. R Foundation for Statistical Computing, 2019. [Google Scholar]
- 23.Barnett K, Mercer SW, Norbury M, et al. Epidemiology of multimorbidity and implications for health care, research, and medical education: A cross-sectional study. Lancet 2012;380:37–43. [DOI] [PubMed] [Google Scholar]
- 24.Kingston A, Robinson L, Booth H, et al. Projections of multi-morbidity in the older population in England to 2035: estimates from the Population Ageing and Care Simulation (PACSim) model. Age Ageing 2018;47:374–80. [DOI] [PMC free article] [PubMed] [Google Scholar]
- 25.Whitty CJM, MacEwen C, Goddard A, et al. Rising to the challenge of multimorbidity. BMJ 2020;368:l6964. [DOI] [PMC free article] [PubMed] [Google Scholar]
- 26.Health and Social Care Information Centre . National Clinical Coding Standards ICD-10, 4th edition (2013): Accurate data for quality information. NHS, 2013. [Google Scholar]
- 27.GOV.UK. Coronavirus (COVID-19) in the UK: UK summary. GOV.UK; https://coronavirus.data.gov.uk [Accessed 14 September 2020]. [Google Scholar]
- 28.Carfì A, Bernabei R, Landi F. Persistent symptoms in patients after acute COVID-19. JAMA 2020;324:603–5. [DOI] [PMC free article] [PubMed] [Google Scholar]
- 29.Madjid M, Safavi-Naeini P, Solomon SD, Vardeny O. Potential effects of coronaviruses on the cardiovascular system: a review. JAMA Cardiol 2020;5:831–40. [DOI] [PubMed] [Google Scholar]
- 30.Patient Led Research For COVID-19 . Report: What does COVID-19 recovery actually look like? Patient Led Research For COVID-19, 2020. https://patientresearchcovid19.com/research/report-1/#Recovery_Timecourse [Accessed 16 September 2020]. [Google Scholar]
- 31.Whitty CJM, Watt FM. Map clusters of diseases to tackle multimorbidity. Nature 2020;579:494–6. [DOI] [PubMed] [Google Scholar]