Abstract
This study tested for longitudinal changes in femoral cartilage T2 relaxation time and thickness in fast-progressing medial femorotibial osteoarthritis (OA). From the Osteoarthritis Initiative (OAI) database, nineteen knees fulfilled the inclusion criteria, which included medial femorotibial OA and sequential progression from Kellgren–Lawrence grade (KL) 1 to KL2 to KL3 within five years. Median T2 value and mean thickness were calculated for six condylar volumes of interest (VOIs; medial/lateral anterior, central, posterior) and six sub-VOIs (medial/lateral anterior external, central, internal). T2 value and thickness changes between severity timepoints were tested using repeated statistics. T2 values increased between KL1 and KL2 and between KL1 and KL3 in the medial compartment (p ≤ 0.02), whereas both increases and decreases were observed between the same timepoints in the lateral compartment (p ≤ 0.02). Cartilage thickness decreased in VOI/subVOIs of the medial compartment from KL1 to KL2 and KL3 (p ≤ 0.014). Cartilage T2 value and thickness changes varied spatially over the femoral condyles. While all T2 changes occurred in the early radiographic stages of OA, thickness changes occurred primarily in the later stages. These data therefore support the use of T2 relaxation time analyses in methods of detecting disease-related change during early OA, a valuable period for therapeutic interventions.
Keywords: knee, osteoarthritis, magnetic resonance imaging, cartilage, composition, morphology, three-dimensional, spatial variations
1. Introduction
Magnetic resonance imaging (MRI) relaxometry methods allow for in vivo analyses of cartilage tissue properties and detection of cartilage degradation associated with knee osteoarthritis (OA) [1]. Specifically, cartilage T2 relaxation time has been related to tissue water and collagen content, along with the structural organization of cartilage [1]. Cross-sectional studies indicate that T2 relaxation times are longer in OA compared to healthy knees, and they are increased with greater radiographic severity of OA [2]. However, longitudinal studies of T2 changes with disease progression have reported inconsistent results, with indications of both no longitudinal femoral T2 changes [3] and increases in T2 values [4] in knees of various OA severities. These discrepancies are likely due to the various definitions of structural progression, follow-up time periods, OA severity, and regions of interest [3,4]. The application of a standardized, validated method of assessing longitudinal cartilage composition changes could provide increased clarity herein [5]. Furthermore, previous studies have assessed changes in T2 over specified durations of follow-up (e.g., 12 months) [3,4]. However, future T2 analysis applications, particularly regarding the measurement of OA disease progression, require an understanding of the evolution of T2 relaxation times through several OA severity grades. Because disease severity and progression is often assessed using radiographic Kellgren–Lawrence grading (KL), it is especially interesting to study the longitudinal evolution of T2 relaxation time in knees progressing sequentially through various KL stages [6].
Testing for T2 longitudinal changes throughout multiple KL stages requires frequent imaging data acquisition for a cohort of progressing OA knees, which is available through the Osteoarthritis Initiative (OAI) database. Here, MRI and radiographic data was collected for nearly 5000 community members over an eight-year follow-up period. Because OA progression can advance at vastly different rates, it is important to consider the progression speed when conducting analyses of longitudinal cartilage changes [7]. Given the limitations in follow-up period in the OAI, a group of “fast progressing” knees, defined as knees advancing from KL1 to KL3 within 5 years, provides a homogeneous population of knees for cartilage analyses [8]. Additionally, including analyses of KL2 provides a common mid-point in the progression of OA. Therefore, in order to characterize the relationship between sequential radiographic progression of OA and changes in cartilage properties, a subset of OAI knees that progressed sequentially from KL1 to KL2 to KL3 within five years was selected for this study.
The known spatial variations of T2 values support the analysis of changes in relaxation time over the entire cartilage surfaces [5,9]. A recently developed technique allows for quantifying changes in T2 in a set of volumes of interest (VOIs) over the entire femoral condyles that are consistent with cartilage morphology analyses [5]. This method also avoids the difficulties faced with segmenting cartilage on T2 MR images by performing cartilage segmentation on high resolution morphological MR images and combining this data with the relaxometry data [5]. As such, information regarding the spatial variations in both cartilage morphology and composition can be derived from a single image segmentation process. Therefore, this study aimed to employ this previously verified MRI relaxometry and morphology analysis methods to characterize cartilage T2 and thickness changes in medial OA knees progressing sequentially from mild to moderate OA, from KL1 to KL2 to KL3. Based on previous cross-sectional and short-term longitudinal studies [2,4], it was hypothesized that T2 relaxation times would increase monotonically from KL1 to KL2 to KL3 throughout the femoral condyles. From studies of the medial knee OA population, femoral cartilage thickness was hypothesized to increase in the medial load-bearing area from KL1 to KL2, and decrease from KL2 to KL3 [10,11,12,13,14].
2. Methods
2.1. Study Population
Data used in this study are from the Osteoarthritis Initiative (OAI) public use datasets (https://oai.nih.gov). Specific datasets included 0.2.3 for baseline clinical data along with 0.E.2, 1.E.2, 3.E.2, 5.E.2, 6.E.3, 8.E.2, and 10.E.1 for imaging data (see Appendix A, Table A1 for further information).
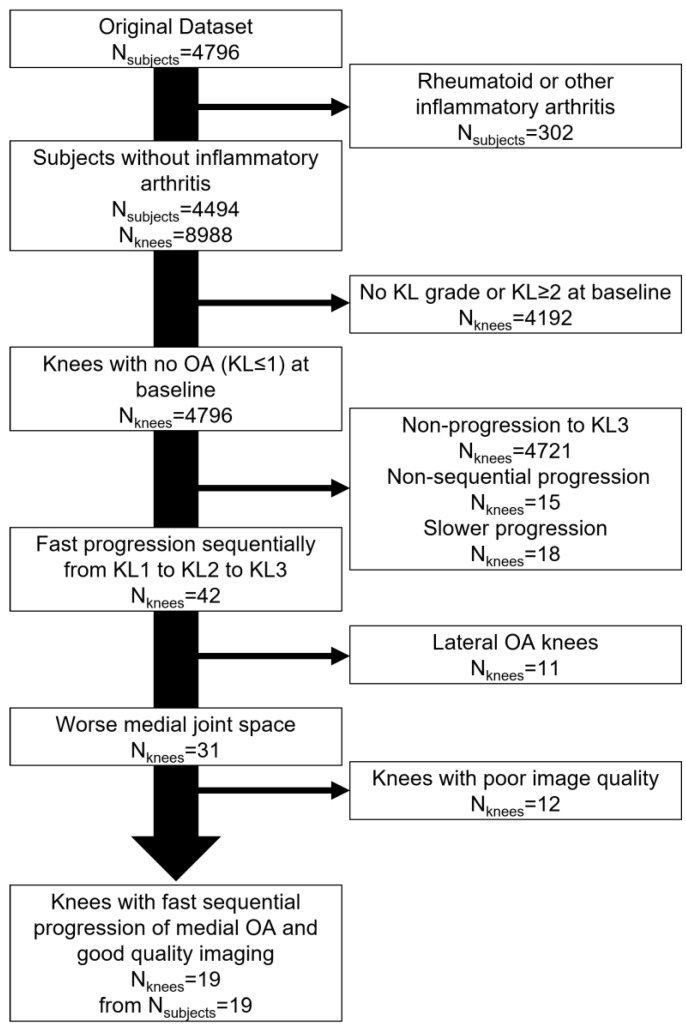
Study knees that progressed monotonically from KL1 to KL2 to KL3 within 60 months [8] with worse medial (versus lateral) joint space narrowing and satisfactory image quality were included. As depicted in Figure 1, this resulted in a study group of 19 knees from 19 subjects.
Figure 1.
Flowchart of study inclusion.
2.2. Imaging Analysis
MRI images at the first timepoints in which each KL grade was reported (“severity timepoint”) were analyzed as previously described [5]. Briefly, the 3D double echo steady state (DESS) MRI (repetition time (TR) = 16.3 ms; echo time (TE) = 4.7 ms; resolution 0.365 × 0.456 × 0.7 mm) were segmented to create bone and cartilage three-dimensional models from which cartilage thickness maps were computed [15,16]. A single operator (C.D.), blind to all patient data including KL grades, segmented all study knees at the three severity timepoints in random order. The segmentation operator trained with a musculoskeletal radiologist with over ten years of experience (P.O.), and all segmentations were reviewed by the senior radiologist. Using the constructed bone and cartilage three-dimensional models, cartilage thickness was computed at each vertex of the subchondral bone model as the minimum distance to the cartilage model surface. The intra- and inter-operator reliability of femoral CTh has been shown to be excellent with this method (ICC ≥ 0.82) [17]. Mean cartilage thickness was then computed per VOI.
The three-dimensional bone and cartilage models were also semi-manually registered to the multi-slice, multi-echo (MSME) MRI T2 sequence (TR = 2700 ms; TE = 10, 20, 30, 40, 50, 60, 70; resolution 0.313 × 0.446 × 3 mm), as previously described [5,18]. Briefly, using custom software, spatial information from the DESS and MSME DICOM headers were used to make an initial registration. The models were then manually translated and rotated to match the tissue structures shown in the MSME images [5]. Intra- and inter-rater reliabilities of this method have been reported as good to excellent (ICC ≥ 0.66) [5]. Per-voxel T2 values were calculated using a monoexponential fit of signal intensities in echoes two through seven, thus excluding the first echo to minimize the effect of stimulated echoes [5,19]. Due to the non-normal distribution of T2 values (as per Shapiro–Wilk tests for normality), median T2 relaxation times were calculated for the full cartilage thickness per (sub-)VOI, excluding values strictly less than 0 ms and values greater than the median plus three times the interquartile range, as per Raya et al. [5,20]. As a supplementary analysis (Appendix B), median T2 relaxation times were also computed in each (sub-)VOI for the superficial (Figure A1) and deep (Figure A2) layers, divided at half cartilage thickness.
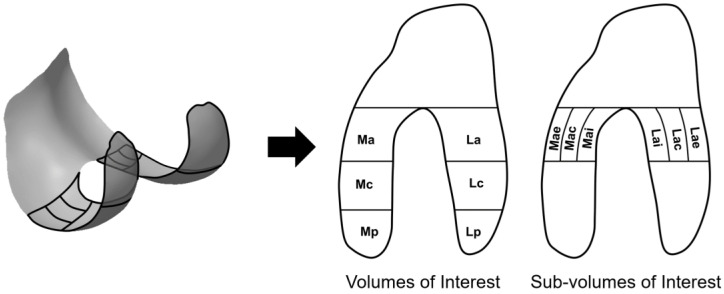
VOIs covered the entire condylar cartilage, dividing it into three parts from anterior to posterior as medial and lateral anterior (Ma, La), central (Mc, Lc), and posterior (Mp, Lp) VOIs (Figure 2). Ma and La were further divided along the medial-lateral axis into medial and lateral anterior external (Mae, Lae), anterior central (Mac, Lac), and anterior internal (Mai, Lai) sub-VOIs. Medial-lateral ratios were also calculated (e.g., Ra = Ma/La, Rae = Mae/Lae), as is commonly done in studies of cartilage thickness. Per convention, both the anterior and central VOIs are considered load-bearing [21].
Figure 2.
Cartilage volumes of interest (VOIs) and sub-VOIs displayed on a representative femur.
2.3. Statistical Analysis
Non-parametric statistics were utilized as T2 values per (sub-)VOI were found not to be normally distributed across the study knees, as determined using the Shapiro–Wilk test for normality. Therefore, to test for changes in group median T2 relaxation time per (sub-)VOI between severity timepoints, Friedman nonparametric repeated measures tests followed by Wilcoxon signed-rank tests were performed.
The cartilage thickness data was normally distributed across study knees and thus repeated measures analysis of variance (ANOVA) was used to test for changes in (sub-)VOI mean cartilage thickness between the three severity timepoints; post-hoc paired t-tests were conducted when indicated.
Alpha was set at 0.05 for the repeated measures test per (sub-)VOI and was Bonferroni-corrected for multiple comparisons for the post-hoc pairwise testing (α = 0.017). Effect sizes (ES) were calculated to quantify the magnitude of the changes in post-hoc comparisons [22].
All statistical calculations were performed using SPSS software (version 23, IBM, New York, NY, USA).
3. Results
The 19 participants (8 females and 11 males) had an average (standard deviation) age of 60.7 (7.8) years and BMI of 31.1 (4.6) kg/m2 at the KL1 severity timepoint. The median time between KL1 and KL3 was 36 (first quartile: 30, third quartile: 45) months.
3.1. Cartilage T2 Analyses
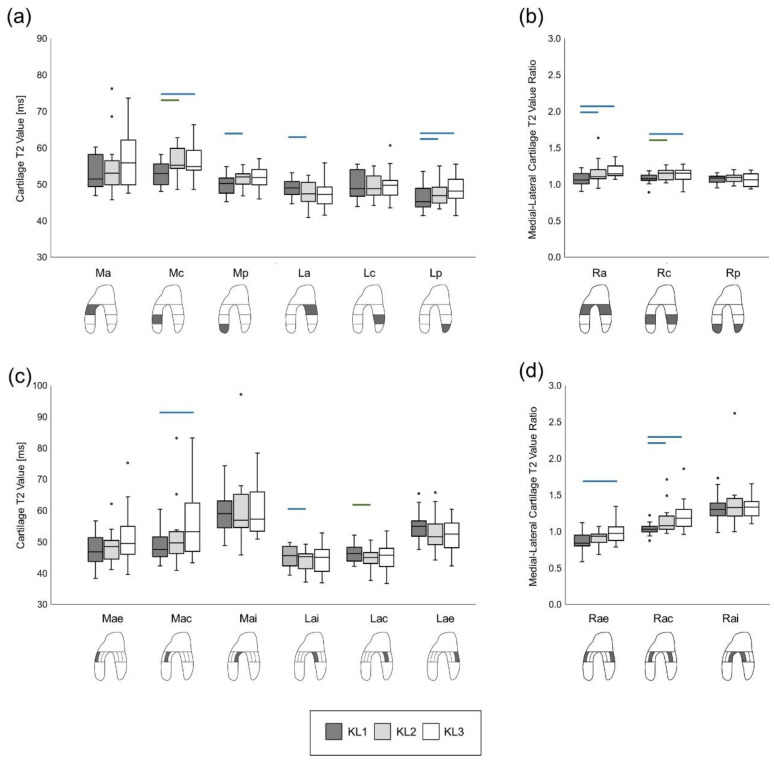
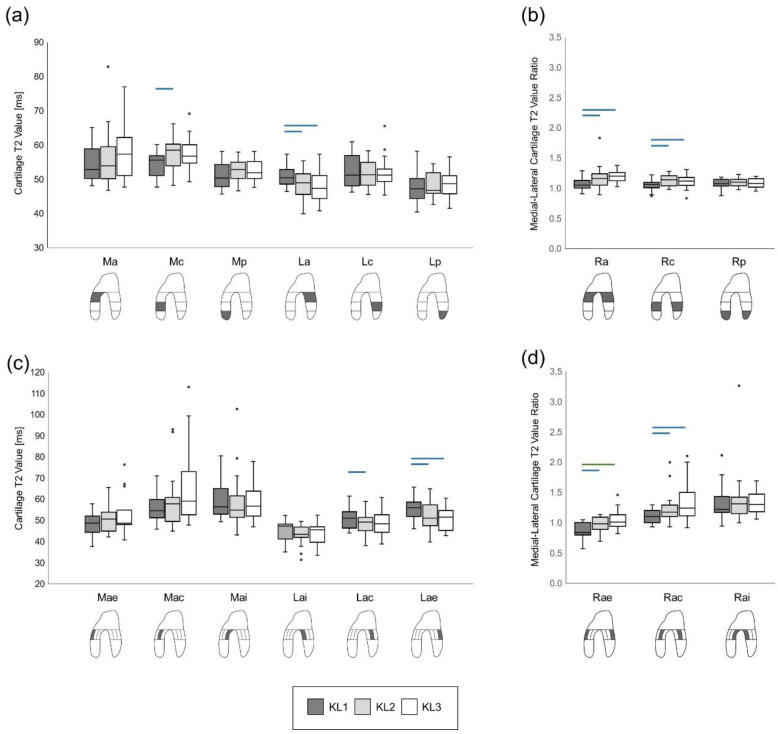
Friedman repeated measures testing indicated significant severity timepoint effects on cartilage T2 values for all VOIs (p < 0.02), except Ma (p = 0.14) and Lc (p = 0.62). Pairwise comparisons indicated that, between KL1 and KL2 severity timepoints, T2 values increased significantly in the Mc, Mp, and Lp VOIs (p ≤ 0.02, ES ≥ 0.57), but significantly decreased in the La VOI (p = 0.003, ES = 0.68) (Figure 3a). A significant increase in T2 values was also reported between KL1 and KL3 in the Mc and Lp VOIs (p < 0.005, ES ≥ 0.65). Furthermore, significant severity timepoint effects were found for all sub-VOIs (p < 0.017), except Mae (p = 0.08) and Mai (p = 0.08). T2 values increased significantly between KL1 and KL3 in the Mac sub-VOI (p = 0.005, ES = 0.55), while significant decreases were observed between KL1 and KL2 in the Lac (p < 0.001, ES = 0.82) and Lai (p = 0.01, ES ≥ 0.59) sub-VOIs (Figure 3c).
Figure 3.
Box and whisker plots of cartilage T2 values per VOI (a) and sub-VOI (c) and their respective medial-lateral ratios (b,d). Horizontal bars indicate statistically significant (p < 0.017) changes between severity timepoints (blue: ES > 0.5; green: ES > 0.8).
Significant severity timepoint effects were observed for the anterior (Ra) and central (Rc) VOI medial-lateral ratios (p < 0.001). Here, ratios increased both between KL1 and KL2 (p ≤ 0.006, ES ≥ 0.63) and between KL1 and KL3 (p ≤ 0.01, ES ≥ 0.59) (Figure 3b). There were significant severity timepoint effects in the anterior external (Rae) and central (Rac) sub-VOI medial-lateral ratios (p < 0.008). Rae increased between KL1 and KL3 (p = 0.001, ES = 0.77), whereas Rac increased both between KL1 and KL2 (p = 0.001, ES ≥ 0.77) and between KL1 and KL3 (p = 0.004, ES = 0.64) (Figure 3d).
Results for the supplementary analyses of T2 values in the superficial and deep cartilage layers are provided in Appendix B (Figure A1 and Figure A2).
3.2. Cartilage Thickness Analyses
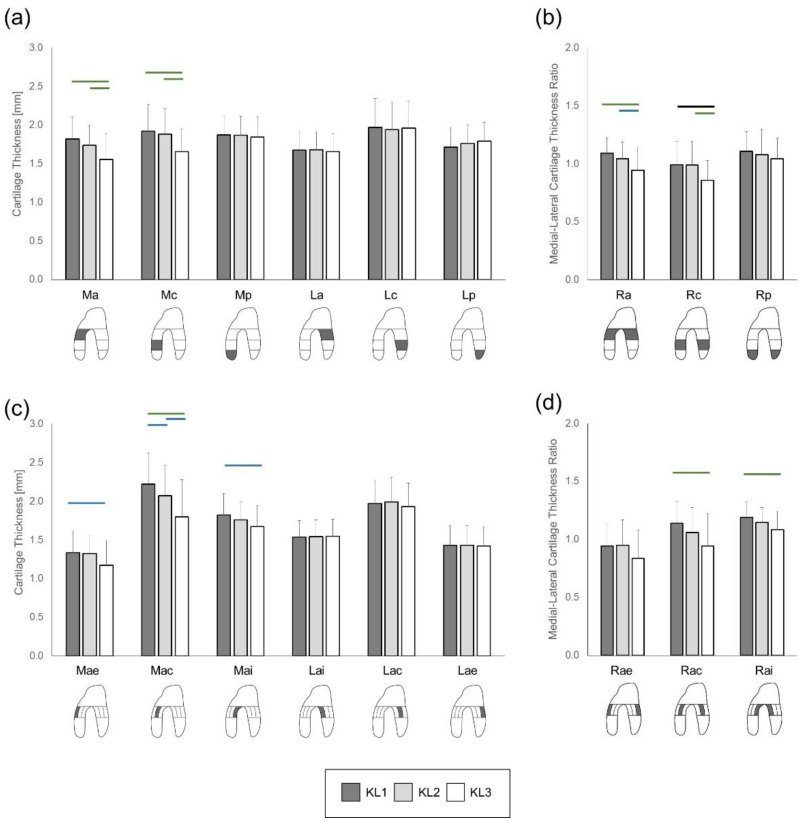
The ANOVA reported significant timepoint effects on cartilage thickness in the Ma and Mc VOIs (p < 0.001). In these VOIs, the post-hoc comparisons indicated significant decreases between KL1 and KL3 and between KL2 and KL3 (p < 0.003, ES ≥ 0.0.81) (Figure 4a). Regarding the sub-VOIs, significant differences among severity timepoints were observed in Mae (p = 0.017), Mac (p < 0.001), and Mai (p = 0.009). Post-hoc comparisons indicated a significant decrease in cartilage thickness from KL1 to KL3 timepoints in these three sub-VOIs (Mae: p = 0.014, ES = 0.63; Mac: p < 0.001, ES = 1.1; Mai: p = 0.004, ES = 0.77) (Figure 4c). Additionally, cartilage thickness significantly decreased in the Mac sub-VOI from KL1 to KL2 (p = 0.012, ES = 0.64) and from KL2 to KL3 (p = 0.004, ES = 0.76). No severity timepoint effect was detected in the Mp VOI (p = 0.5), nor in the lateral VOIs or sub-VOIs (p > 0.12).
Figure 4.
Bar plots (mean ± standard deviation) of cartilage thickness per VOI (a) and sub-VOI (c) and their respective medial-lateral ratios (b,d). Horizontal bars indicate statistically significant (p < 0.017) changes between severity timepoints (blue: ES > 0.5; green: ES > 0.8; black: ES > 1.2).
Significant severity timepoint effects were observed for the anterior (Ra) and central (Rc) VOI medial-lateral ratios (p < 0.001), with post-hoc analysis indicating significant decreases between KL1 and KL3 and between KL2 and KL3 for both ratios (p < 0.007, ES ≥ 0.7) (Figure 4b). Significant severity timepoint effects were also reported for the anterior central (Rac) and internal (Rai) VOI medial-lateral ratios (p < 0.002). The post-hoc analysis indicated significant thickness decreases from KL1 to KL3 in the Rac and Rai ratios (p < 0.001, ES ≥ 0.93) (Figure 4d).
4. Discussion
The results demonstrated that, in radiographically fast-progressing medial OA knees, T2 relaxation times increased in the medial femoral condyle and in the posterior lateral condyle. Furthermore, contrary to the study hypotheses, decreases in T2 values were found in the anterior area of the lateral compartment. These opposing changes between the medial and lateral compartments were further demonstrated in the medial-lateral ratios, which increased in both the anterior and central areas of cartilage. Interestingly, there were no significant changes in T2 relaxation time at any location between KL2 and KL3 severity timepoints, suggesting that T2 changes occur early in the disease process. This is consistent with previous reports of increased T2 values in at-risk populations [23,24] and the predictive capacity of T2 values for subsequent OA development [25].
Simultaneously, a decrease in cartilage thickness was observed in the medial load-bearing VOIs primarily between KL2 and KL3 radiographic stages, later in the disease than T2 changes. These results agree with the location of cartilage thinning previously observed in the general medial knee OA population, with medial areas of greater loading displaying the greatest loss in cartilage thickness [10,26,27]. In examining the sub-VOIs of the medial anterior VOI, significant thinning was detected first in the medial anterior central sub-VOI from KL1 to KL2 and then in the medial anterior internal and external sub-VOIs. This is also consistent with previous longitudinal [10,12] and cross-sectional data [13,14,28], in which cartilage loss was reported to occur first in the anterior central sub-VOI and then grow toward the exterior.
Taken together, the results suggest that T2 relaxation time changes precede cartilage thickness loss in OA disease progression. Thus, T2 relaxation time analyses could be especially useful for evaluating disease progression during the early development of OA, before the occurrence of any substantial chondral tissue loss. This is a particularly important period in which interventions could be most effective in preserving the existing cartilage tissue.
The observed increases in T2 relaxation times in the medial compartment likely reflect the increased water content and altered collagen organization due to disease progression [1]. It is unclear why T2 values in the lateral compartment decreased during disease development. One hypothesis could be that this compartment undergoes increased cell proliferation and collagen production, which in turn could decrease T2 values, as previously seen in animal models of OA [29]. Further histological studies are needed to confirm these postulations. The contrasting changes in T2 values between the compartments were made more apparent in the medial-lateral ratios. Medial-lateral ratios are typically used in studies of cartilage morphology; including these measures in cartilage relaxometry analyses can bring insights into the relationships between joint loading and cartilage properties in OA [30].
In contrast to the study hypotheses, no increase in cartilage thickness was found in either the load-bearing VOIs of the medial compartment in early OA nor in the non-load-bearing VOIs of the medial and lateral compartments between OA radiographic severities. This differs from previous evidence of cartilage thickening in the medial load-bearing VOIs in the early stages of OA and in areas of lesser loading throughout the disease [11,12,13,14,28,31,32]. The causes for medial cartilage thickness increases observed in the early stages of the disease in the general medial knee OA population are not entirely understood [13,29]. In a healthy knee joint, anabolic and catabolic processes of cartilage are balanced to maintain tissue metabolic homeostasis [30]. Using evidence from animal models, it is suggested that early cartilage thickening may be due to a reparative, anabolic response to the initial cartilage damage, resulting in increased proteoglycan production and apparent cartilage hypertrophy [24,31,32]. In the later stages of the disease, the same anabolic signaling may exist, but its effect is likely only visible in areas of cartilage not exposed to load-induced degradation, such as the most posterior aspect of the medial condyle [26]. The lack of cartilage thickening in any ROI of the tested knees suggests that the cartilage metabolic balance in fast-progressing knees is dominated by catabolic activities. Further histological studies would be necessary to confirm this possible explanation, and comparisons of the biological processes involved in knees of various OA subtypes could reveal new therapeutic pathways in OA.
The results must be interpreted with consideration for the study limitations. A population of fast-progressing knees was chosen to provide a study group of similar progression speeds within the OAI database. This resulted in a study group with a mean BMI classified as obese. Therefore, further investigations will be necessary to assess the generalizability of the presented findings to non-obese patients and knees with slower disease progression. Furthermore, future work should consider extending the utilized method to analyzing T2 changes across various OA severities in the cartilage of the patellofemoral joint and in the tibial cartilage, both of which are also affected by disease progression [2,33]. Longitudinal cartilage changes in a control population of KL0 knees were not employed here for comparison, as these changes have been previously evaluated in the same cohort of patients as in this study [34,35]. Specifically, Buck et al., reported annualized cartilage thickness changes in healthy individuals of <0.7%/year [34]; significant changes found in this study ranged from −8.8%/year to −1.7%/year. Similarly, T2 value changes in the medial femoral cartilage of healthy individuals have been reported at 1.4%/year [35], as compared to the 4.4%/year increase found in this study. Finally, the “magic angle effect” may have influenced the T2 values in locations of cartilage oriented at about 55° relative to B0 [36]. However, due to the longitudinal, intra-subject design of this study along with the standardized imaging protocol, this effect likely acted as a constant additive bias to the T2 estimates in consistent VOIs; its effect was thus minimized when analyzing the differences between severity timepoints.
5. Conclusions
In conclusion, this study characterized cartilage T2 and thickness changes with respect to radiographic structural disease progression in a group of fast-progressing medial OA knees using an intra-subject longitudinal study design. Unique to this study was the use of VOIs spanning the entire condylar surfaces, the simultaneous analysis of relaxometry and morphology data, the application of a standardized methodology, and the longitudinal analysis of cartilage through multiple radiographic stages of OA. The results highlighted that cartilage T2 and thickness changes vary spatially over the femoral condyles. Additionally, all T2 changes occurred in the early radiographic stages of OA, whereas thickness changes occurred primarily in the later stages. These data therefore support the use of T2 relaxation time analyses in methods of detecting, potentially more sensitively than with radiography, disease-related change during early OA, a valuable period for therapeutic interventions.
Acknowledgments
The authors would like to thank Charles Dalang (C.D.) for his assistance in data processing.
Appendix A
Table A1.
Osteoarthritis Initiative dataset versions used for study cohort identification and analysis.
| Data Collected | Dataset Name | Version Number |
|---|---|---|
| Radiological joint space narrowing (JSN) and Kellgren-Lawrence grade (KL) | kxr_sq_bu00 | 0.8 |
| kxr_sq_bu01 | 1.8 | |
| kxr_sq_bu03 | 3.7 | |
| kxr_sq_bu05 | 5.7 | |
| kxr_sq_bu06 | 6.5 | |
| kxr_sq_bu08 | 8.2 | |
| kxr_sq_bu10 | 10.2 | |
| MRI quality control | mri00 | 0.2.3 |
| mri01 | 1.2.2 | |
| mri03 | 3.2.2 | |
| mri05 | 5.2.2 | |
| mri06 | 6.2.2 | |
| mri08 | 8.2.2 | |
| mri10 | 10.2.2 | |
| Body Mass Index (BMI) | physexam00 | 0.2.2 |
| physexam01 | 1.2.1 | |
| physexam03 | 3.2.1 | |
| physexam05 | 5.2.1 | |
| physexam06 | 6.2.1 | |
| physexam08 | 8.2.1 | |
| physexam10 | 10.2.1 | |
| Presence of rheumatoid arthritis/inflammatory disease | medhist00 | 0.2.2 |
| Age at baseline | allclinical00 | 0.2.3 |
| Sex | enrollees | 25 |
Appendix B
Figure A1.
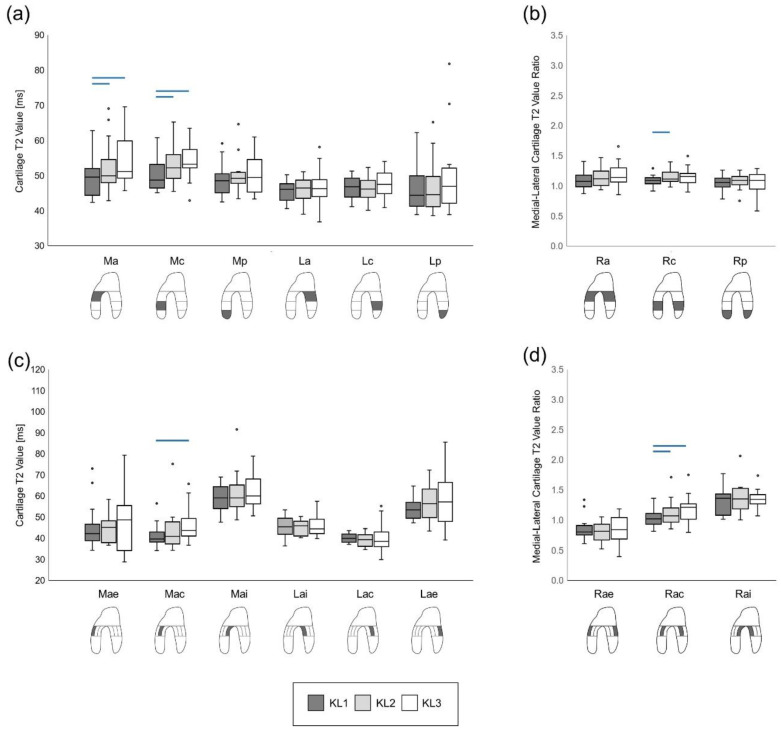
Box and whisker plots of superficial cartilage T2 values per VOI (a) and sub-VOI (c) and their respective medial-lateral ratios (b,d). Horizontal bars indicate statistically significant (p < 0.017) changes between severity timepoints (blue: ES > 0.5; green: ES > 0.8).
Figure A2.
Box and whisker plots of deep cartilage T2 values per VOI (a) and sub-VOI (c) and their respective medial-lateral ratios (b,d). Horizontal bars indicate statistically significant (p < 0.017) changes between severity timepoints (blue: ES > 0.5; green: ES > 0.8).
Author Contributions
Conceptualization: all; Methodology: S.N.E., P.O. and J.F.; Validation: S.N.E.; formal analysis: S.N.E.; investigation: S.N.E., P.O., J.F.; resources: all; data curation: S.N.E.; writing—original draft preparation: S.N.E., P.O.; writing—review and editing: all; visualization: S.N.E., J.F.; supervision: P.O., B.M.J., J.F.; project administration: P.O., B.M.J., J.F.; funding acquisition: all. P.O., B.M.J., and J.F. supervised this study and should be considered as last authors. All authors have read and agreed to the published version of the manuscript.
Funding
This work was partially supported by the Swiss National Science Foundation (SNSF), Switzerland (Grant: CRSII5_177155), the Profectus Foundation, Switzerland, and the Lausanne Orthopedic Research Foundation, Switzerland. The OAI is a public-private partnership comprised of five contracts (N01-AR-2-2258; N01-AR-2-2259; N01-AR-2-2260; N01-AR-2-2261; N01-AR-2-2262) funded by the National Institutes of Health, a branch of the Department of Health and Human Services, and conducted by the OAI Study Investigators. Private funding partners include Merck Research Laboratories; Novartis Pharmaceuticals Corporation, GlaxoSmithKline; and Pfizer, Inc. Private sector funding for the OAI is managed by the Foundation for the National Institutes of Health. This manuscript was prepared using an OAI public use data set and does not necessarily reflect the opinions or views of the OAI investigators, the NIH, or the private funding partners.
Institutional Review Board Statement
The study was conducted according to the guidelines of the Declaration of Helsinki, and approved by the Institutional Review Board of the University of California, San Francisco (approval number 10-00532, 10 March 2015).
Informed Consent Statement
All OAI study participants provided informed consent.
Data Availability Statement
The source data are publicly available at https://oai.nih.gov.
Conflicts of Interest
The authors declare no conflict of interest.
Footnotes
Publisher’s Note: MDPI stays neutral with regard to jurisdictional claims in published maps and institutional affiliations.
References
- 1.Oei E.H.G.G., Van Tiel J., Robinson W.H., Gold G.E. Quantitative radiologic imaging techniques for articular cartilage composition: Toward early diagnosis and development of disease-modifying therapeutics for osteoarthritis. Arthritis Care Res. 2014;66:1129–1141. doi: 10.1002/acr.22316. [DOI] [PMC free article] [PubMed] [Google Scholar]
- 2.Hirose J., Nishioka H., Nakamura E., Oniki Y., Yamashita Y., Mizuta H. T1ρ and T2 mapping of the proximal tibiofibular joint in relation to aging and cartilage degeneration. Eur. J. Radiol. 2012;81:2776–2782. doi: 10.1016/j.ejrad.2011.11.019. [DOI] [PubMed] [Google Scholar]
- 3.Wirth W., Maschek S., Roemer F.W., Eckstein F., Roemer F.W., Eckstein F. Layer-specific femorotibial cartilage T2 relaxation time in knees with and without early knee osteoarthritis: Data from the Osteoarthritis Initiative (OAI) Sci. Rep. 2016;6:1–8. doi: 10.1038/srep34202. [DOI] [PMC free article] [PubMed] [Google Scholar]
- 4.Kretzschmar M., Heilmeier U., Yu A., Joseph G.B., Liu F., Solka M., McCulloch C.E., Nevitt M.C., Link T.M. Longitudinal analysis of cartilage T2 relaxation times and joint degeneration in African American and Caucasian American women over an observation period of 6 years—Data from the Osteoarthritis Initiative. Osteoarthr. Cartil. 2016;24:1384–1391. doi: 10.1016/j.joca.2016.03.002. [DOI] [PMC free article] [PubMed] [Google Scholar]
- 5.Edd S.N., Babel H., Kerkour N., Jolles B.M., Omoumi P., Favre J., Edd S.N., Babel H., Kerkour N., Jolles B.M., et al. Comprehensive description of T2 value spatial variations in non-osteoarthritic femoral cartilage using three-dimensional registration of morphological and relaxometry data. Knee. 2019;26:555–563. doi: 10.1016/j.knee.2019.03.006. [DOI] [PubMed] [Google Scholar]
- 6.Kellgren J.H., Lawrence J.S. Radiological assessment of osteo-arthrosis. Ann. Rheum. Dis. 1957;16:494–502. doi: 10.1136/ard.16.4.494. [DOI] [PMC free article] [PubMed] [Google Scholar]
- 7.Emrani P.S., Katz J.N., Kessler C.L., Reichmann W.M., Wright E.A., McAlindon T.E., Losina E. Joint space narrowing and Kellgren-Lawrence progression in knee osteoarthritis: An analytic literature synthesis. Osteoarthr. Cartil. 2008;16:873–882. doi: 10.1016/j.joca.2007.12.004. [DOI] [PMC free article] [PubMed] [Google Scholar]
- 8.Riddle D.L., Stratford P.W., Perera R.A. The incident tibiofemoral osteoarthritis with rapid progression phenotype: Development and validation of a prognostic prediction rule. Osteoarthr. Cartil. 2016;24:2100–2107. doi: 10.1016/j.joca.2016.06.021. [DOI] [PMC free article] [PubMed] [Google Scholar]
- 9.Surowiec R.K., Lucas E.P., Fitzcharles E.K., Petre B.M., Dornan G.J., Giphart J.E., LaPrade R.F., Ho C.P. T2 values of articular cartilage in clinically relevant subregions of the asymptomatic knee. Knee Surg. Sport. Traumatol. Arthrosc. 2014;22:1404–1414. doi: 10.1007/s00167-013-2779-2. [DOI] [PubMed] [Google Scholar]
- 10.Eckstein F., Nevitt M., Gimona A., Picha K., Lee J.H., Davies R.Y., Dreher D., Benichou O., Le Graverand M.P.H., Hudelmaier M., et al. Rates of change and sensitivity to change in cartilage morphology in healthy knees and in knees with mild, moderate, and end-stage radiographic osteoarthritis: Results from 831 participants from the osteoarthritis initiative. Arthritis Care Res. 2011;63:311–319. doi: 10.1002/acr.20370. [DOI] [PMC free article] [PubMed] [Google Scholar]
- 11.Buck R.J., Wyman B.T., Le Graverand M.-P.H., Hudelmaier M., Wirth W., Eckstein F., Hellio Le Graverand M.P., Hudelmaier M., Wirth W., Eckstein F. Osteoarthritis may not be a one-way-road of cartilage loss—Comparison of spatial patterns of cartilage change between osteoarthritic and healthy knees. Osteoarthr. Cartil. 2010;18:329–335. doi: 10.1016/j.joca.2009.11.009. [DOI] [PubMed] [Google Scholar]
- 12.Le Graverand M.P.H., Buck R.J., Wyman B.T., Vignon E., Mazzuca S.A., Brandt K.D., Piperno M., Charles H.C., Hudelmaier M., Hunter D.J., et al. Change in regional cartilage morphology and joint space width in osteoarthritis participants versus healthy controls: A multicentre study using 3.0 Tesla MRI and Lyon-Schuss radiography. Ann. Rheum. Dis. 2010;69:155–162. doi: 10.1136/ard.2008.099762. [DOI] [PubMed] [Google Scholar]
- 13.Favre J., Erhart-Hledik J.C., Blazek K., Fasel B., Gold G.E., Andriacchi T.P. Anatomically-standardized maps reveal distinct patterns of cartilage thickness with increasing severity of medial compartment knee osteoarthritis: Cartilage Thickness Maps with OA. J. Orthop. Res. 2017 doi: 10.1002/jor.23548. [DOI] [PubMed] [Google Scholar]
- 14.Le Graverand M.P.H., Buck R.J., Wyman B.T., Vignon E., Mazzuca S.A., Brandt K.D., Piperno M., Charles H.C., Hudelmaier M., Hunter D.J., et al. Subregional femorotibial cartilage morphology in women—Comparison between healthy controls and participants with different grades of radiographic knee osteoarthritis. Osteoarthr. Cartil. 2009;17:1177–1185. doi: 10.1016/j.joca.2009.03.008. [DOI] [PubMed] [Google Scholar]
- 15.Favre J., Scanlan S.F., Erhart-Hledik J.C., Blazek K., Andriacchi T.P. Patterns of femoral cartilage thickness are different in asymptomatic and osteoarthritic knees and can be used to detect disease-related differences between samples. J. Biomech. Eng. 2013;135:101002–101012. doi: 10.1115/1.4024629. [DOI] [PMC free article] [PubMed] [Google Scholar]
- 16.Koo S., Gold G.E., Andriacchi T.P. Considerations in measuring cartilage thickness using MRI: Factors influencing reproducibility and accuracy. Osteoarthr. Cartil. 2005;13:782–789. doi: 10.1016/j.joca.2005.04.013. [DOI] [PubMed] [Google Scholar]
- 17.Favre J., Babel H., Cavinato A., Blazek K., Jolles B.M., Andriacchi T.P. Analyzing femorotibial cartilage thickness using anatomically standardized maps: Reproducibility and reference data. J. Clin. Med. 2021;10:461. doi: 10.3390/jcm10030461. [DOI] [PMC free article] [PubMed] [Google Scholar]
- 18.Peterfy C.G., Schneider E., Nevitt M. The osteoarthritis initiative: Report on the design rationale for the magnetic resonance imaging protocol for the knee. Osteoarthr. Cartil. 2008;16:1433–1441. doi: 10.1016/j.joca.2008.06.016. [DOI] [PMC free article] [PubMed] [Google Scholar]
- 19.Shiomi T., Nishii T., Nakata K., Tamura S., Tanaka H., Yamazaki Y., Murase K., Yoshikawa H., Sugano N. Three-dimensional topographical variation of femoral cartilage T2 in healthy volunteer knees. Skelet. Radiol. 2013;42:363–370. doi: 10.1007/s00256-012-1522-2. [DOI] [PubMed] [Google Scholar]
- 20.Raya J.G., Dietrich O., Horng A., Weber J., Reiser M.F., Glaser C. T2 measurement in articular cartilage: Impact of the fitting method on accuracy and precision at low SNR. Magn. Reson. Med. 2010;63:181–193. doi: 10.1002/mrm.22178. [DOI] [PubMed] [Google Scholar]
- 21.Pelletier J.-P., Raynauld J.-P., Berthiaume M.-J., Abram F., Choquette D., Haraoui B., Beary J.F., Cline G.A., Meyer J.M., Martel-Pelletier J. Risk factors associated with the loss of cartilage volume on weight-bearing areas in knee osteoarthritis patients assessed by quantitative magnetic resonance imaging: A longitudinal study. Arthritis Res. Ther. 2007;9:1–11. doi: 10.1186/ar2272. [DOI] [PMC free article] [PubMed] [Google Scholar]
- 22.Cohen J. Statistical Power Analysis for the Behavioral Sciences. Academic Press; New York, NY, USA: 2013. [Google Scholar]
- 23.Su F., Hilton J.F., Nardo L., Wu S., Liang F., Link T.M., Ma C.B., Li X. Cartilage morphology and T1ρ and T2 Quantification in ACL- reconstructed knees: A 2-year follow-up. Osteoarthr. Cartil. 2013;21:1058–1067. doi: 10.1016/j.joca.2013.05.010. [DOI] [PMC free article] [PubMed] [Google Scholar]
- 24.Williams A., Winalski C.S., Chu C.R. Early articular cartilage MRI T2 changes after anterior cruciate ligament reconstruction correlate with later changes in T2 and cartilage thickness. J. Orthop. Res. 2017;35:699–706. doi: 10.1002/jor.23358. [DOI] [PMC free article] [PubMed] [Google Scholar]
- 25.Liebl H., Joseph G., Nevitt M.C., Singh N., Heilmeier U., Subburaj K., Jungmann P.M., McCulloch C.E., Lynch J.A., Lane N.E., et al. Early T2 changes predict onset of radiographic knee osteoarthritis: Data from the osteoarthritis initiative. Ann. Rheum. Dis. 2015;74 doi: 10.1136/annrheumdis-2013-204157. [DOI] [PMC free article] [PubMed] [Google Scholar]
- 26.Shim V.B., Besier T.F., Lloyd D.G., Mithraratne K., Fernandez J.F. The influence and biomechanical role of cartilage split line pattern on tibiofemoral cartilage stress distribution during the stance phase of gait. Biomech. Model. Mechanobiol. 2016;15:195–204. doi: 10.1007/s10237-015-0668-y. [DOI] [PubMed] [Google Scholar]
- 27.Eckstein F., Maschek S., Wirth W., Hudelmaier M., Hitzl W., Wyman B., Nevitt M., Le Graverand M.P.H. One year change of knee cartilage morphology in the first release of participants from the Osteoarthritis Initiative progression subcohort: Association with sex, body mass index, symptoms and radiographic osteoarthritis status. Ann. Rheum. Dis. 2009;68:674–679. doi: 10.1136/ard.2008.089904. [DOI] [PMC free article] [PubMed] [Google Scholar]
- 28.Frobell R.B., Nevitt M.C., Hudelmaier M., Wirth W., Wyman B.T., Benichou O., Dreher D., Davies R., Lee J.H., Baribaud F., et al. Femorotibial subchondral bone area and regional cartilage thickness: A cross-sectional description in healthy reference cases and various radiographic stages of osteoarthritis in 1003 knees from the Osteoarthritis Initiative. Arthritis Care Res. 2010;62:1612–1623. doi: 10.1002/acr.20262. [DOI] [PubMed] [Google Scholar]
- 29.Vignon E., Arlot M., Hartmann D., Moyen B., Ville G. Hypertrophic repair of articular cartilage in experimental osteoarthrosis. Ann. Rheum. Dis. 1983;42:82–88. doi: 10.1136/ard.42.1.82. [DOI] [PMC free article] [PubMed] [Google Scholar]
- 30.Edd S.N., Omoumi P., Andriacchi T.P., Jolles B.M., Favre J. Modeling knee osteoarthritis pathophysiology using an integrated joint system (IJS): A systematic review of relationships among cartilage thickness, gait mechanics, and subchondral bone mineral density. Osteoarthr. Cartil. 2018;26:1425–1437. doi: 10.1016/j.joca.2018.06.017. [DOI] [PubMed] [Google Scholar]
- 31.Omoumi P., Babel H., Jolles B.M., Favre J. Cartilage can be thicker in advanced osteoarthritic knees: A tridimensional quantitative analysis of cartilage thickness at posterior aspect of femoral condyles. Br. J. Radiol. 2018:20170729. doi: 10.1259/bjr.20170729. [DOI] [PMC free article] [PubMed] [Google Scholar]
- 32.Omoumi P., Michoux N., Roemer F.W., Thienpont E., Berg B.C.V. Cartilage thickness at the posterior medial femoral condyle is increased in femorotibial knee osteoarthritis: A cross-sectional CT arthrography study (Part 2) Osteoarthr. Cartil. 2015;23:224–231. doi: 10.1016/j.joca.2014.08.017. [DOI] [PubMed] [Google Scholar]
- 33.McAlindon T.E., Snow S., Cooper C., Dieppe P.A. Radiographic patterns of osteoarthritis of the knee joint in the community: The importance of the patellofemoral joint. Ann. Rheum. Dis. 1992;51:844–849. doi: 10.1136/ard.51.7.844. [DOI] [PMC free article] [PubMed] [Google Scholar]
- 34.Buck R.J., Wirth W., Dreher D., Nevitt M., Eckstein F. Frequency and spatial distribution of cartilage thickness change in knee osteoarthritis and its relation to clinical and radiographic covariates—Data from the osteoarthritis initiative. Osteoarthr. Cartil. 2013;21:102–109. doi: 10.1016/j.joca.2012.10.010. [DOI] [PubMed] [Google Scholar]
- 35.Pan J., Pialat J.-B., Joseph T., Kuo D., Joseph G.B., Nevitt M.C., Link T.M. Knee cartilage T2 characteristics and evolution in relation to morphologic abnormalities detected at 3-T MR imaging: A longitudinal study of the normal control cohort from the osteoarthritis initiative. Radiology. 2011;261:507–515. doi: 10.1148/radiol.11102234. [DOI] [PMC free article] [PubMed] [Google Scholar]
- 36.Waldschmidt J.G., Rilling R.J., Kajdacsy-Balla A.A., Boynton M.D., Erickson S.J. In Vitro and in vivo MR imaging of hyaline cartilage: Zonal anatomy, imaging pitfalls, and pathologic conditions. Radiographics. 1997;17:1387–1402. doi: 10.1148/radiographics.17.6.9397453. [DOI] [PubMed] [Google Scholar]
Associated Data
This section collects any data citations, data availability statements, or supplementary materials included in this article.
Data Availability Statement
The source data are publicly available at https://oai.nih.gov.


