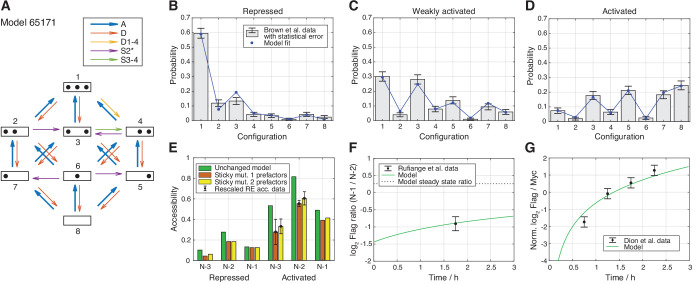
Figure 3. Best regulated on-off-slide model compatible with all the experimental data sets in stage 3.
All fits were done simultaneously (see Materials and methods). (A) Regulated on-off-slide model with the regulated process A (global assembly, thick arrows) and the constitutive processes D (global disassembly), D1-4 (disassembly from configuration 1 to 4, overrules D), S2* (sliding away from N-2) and S3-4 (sliding from configuration 3 to 4). (B, C, D) Combined fits to the steady-state promoter nucleosome configuration occurrences in repressed, weakly activated, and activated state. Only a change in the rate of the regulated global assembly process accounts for differences in the three distributions. The other processes (D, D1-4, S2*, and S3-4) are constitutive and their rates do not change. The model fits in stage 1 (ignoring all other data) and stage 2 (ignoring Flag-/Myc-tagged histone exchange data) are only slightly better (data not shown). (E) Fit to the sticky N-3 RE accessibility data of two mutants in the activated state (error bars with standard deviation of rescaled RE accessibility). Only reaction rates involving the N-3 were allowed to divert from the previously fitted parameter values. (F) Fit to the Rufiange et al., 2007 data of Flag amounts at N-1 over N-2 after 2 h of Flag expression (shifted by 0.25 h lag time determined in Dion et al., 2007). The error bar corresponds to the standard deviation of two measurements. (G) Fit to the Dion et al., 2007 data of Flag over Myc amounts at N-1 at four time points after Flag expression (shifted by 0.25 h lag time). y-axis points are normalized by their mean to account for a sloppy fitted parameter in the treatment of the data in Dion et al., 2007. Error bars are estimated experimental standard deviations used in the fit.
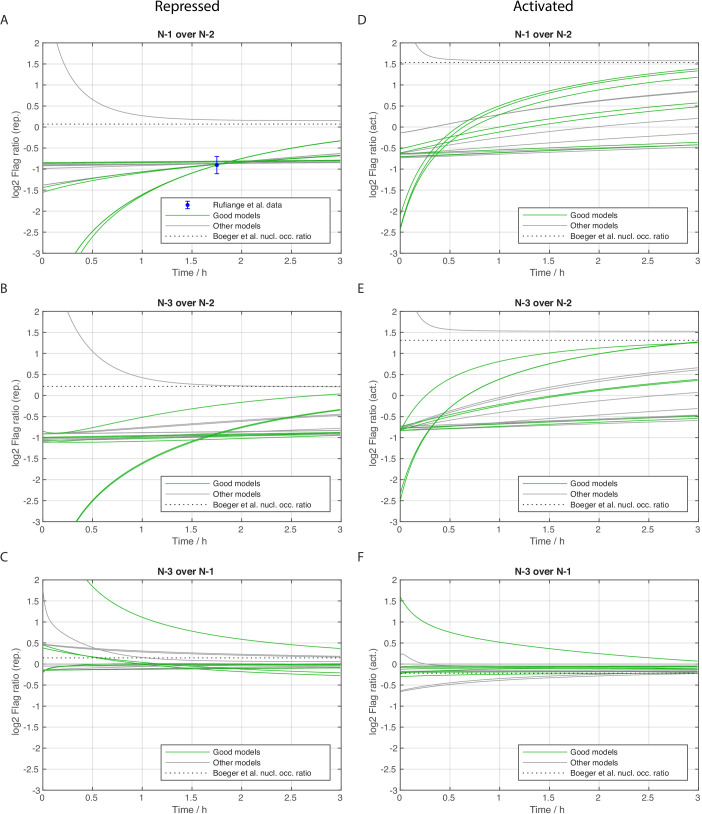
Figure 3—figure supplement 1. Stage 3: Flag amount ratios of tested models.
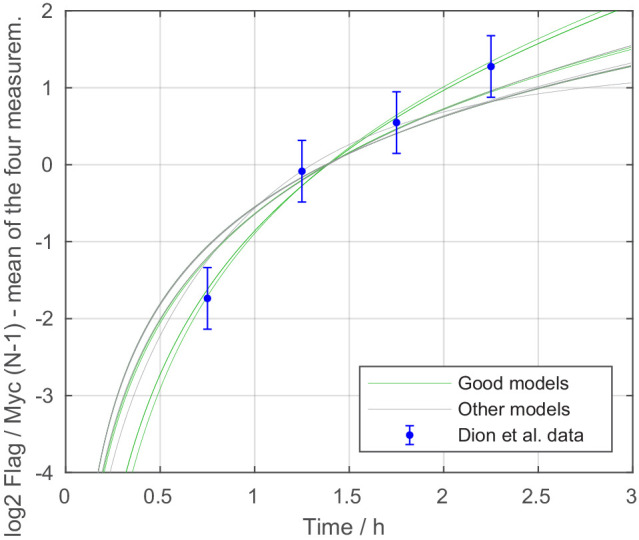
Figure 3—figure supplement 2. Stage 3: Flag over Myc amount ratios of tested models.

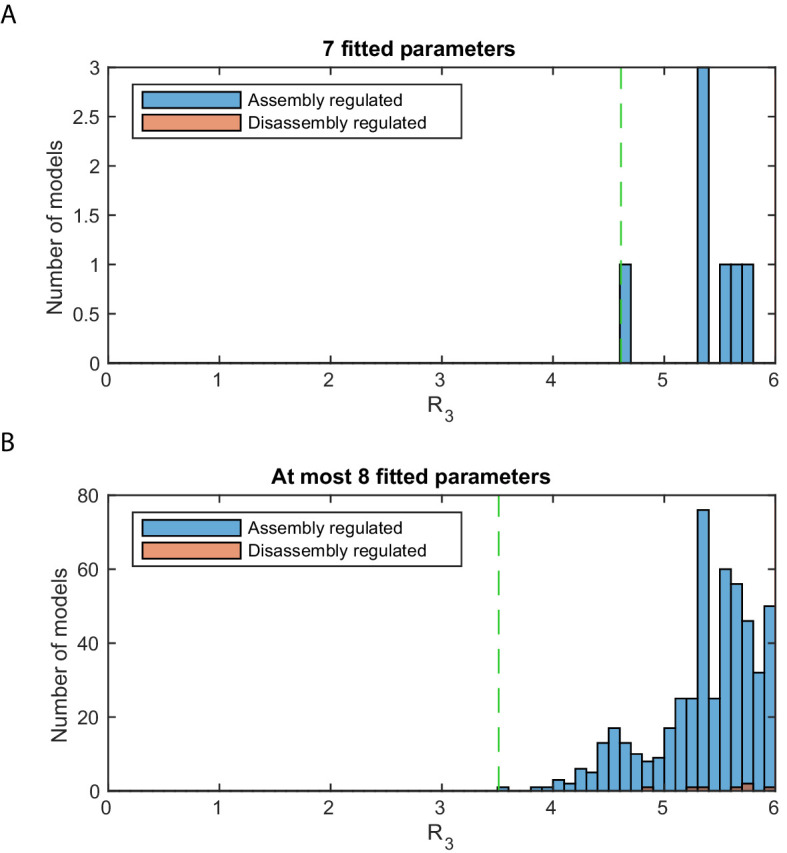
Figure 3—figure supplement 3. Stage 3: logarithmic likelihood ratio histograms.


