Abstract
Acute myeloid leukemia (AML) is a type of hematological malignancy with diverse genetic pathogenesis. Identification of the miR-93-5p targeted pathogenic markers could be useful for AML diagnosis and potential therapy. We collected 751 miR-93-5p targeted and AML-related genes by integrating the results of multiple databases and then used the expression profile of TCGA-LAML to construct a coexpression function network of AML WGCNA. Based on the clinical phenotype and module trait relationship, we identified two modules (brown and yellow) as interesting dysfunction modules, which have a significant association with cytogenetics risk and FAB classification systems. GO enrichment and KEGG analysis showed that these modules are mainly involved with cancer-associated pathways, including MAPK signal pathway, p53 signal pathway, JAK-STAT signal pathway, TGF-beta signaling pathway, mTOR signaling pathway, VEGF signaling pathway, both associated with the occurrence of AML. Besides, using the STRING database, we discovered the top 10 hub genes in each module, including MAPK1, ACTB, RAC1, GRB2, MDM2, ACTR2, IGF1R, CDKN1A, YWHAZ, and YWHAB in the brown module and VEGFA, FGF2, CCND1, FOXO3, IGFBP3, GSF1, IGF2, SLC2A4, PDGFBM, and PIK3R2 in the yellow module. The prognosis analysis result showed that six key pathogens have significantly affected the overall survival and prognosis in AML. Interestingly, VEGF with the most significant regulatory relationship in the yellow modules significantly positively correlated with the clinical phenotype of AML. We used qPCR and ELISA to verify miR-93-5p and VEGF expression in our clinical samples. The results exhibited that miR-93-5p and VEGF were both highly expressed in AML.
1. Introduction
Acute myeloid leukemia (AML) is one of the most common hematological malignancies in adults and is characterized by clonal expansion of abnormally differentiated blasts of a myeloid lineage [1]. Usually, patients who are initially diagnosed with AML are often accompanied by severe clinical symptoms [2]. So, the early untreated disease progresses of AML is very rapid, and the mortality rate is also very high [3]. In recent years, with the rapid development of molecular biology and other technologies, the pathogenic genes of AML have been continuously discovered, and the development and clinical exploration of new drugs targeting AML have also been accelerated [4–6]. However, it is established that the treatment outcome of patients with AML is still not optimistic currently, and the 5-year survival rate of patients is only maintained at approximately 30% [7]. At present, AML has the characteristics of low cure rate, poor prognosis, and high rate of relapse, so it is imperative to find new biomarkers and targeted therapeutic molecules.
For nearly two decades, studies have found that the noncoding RNAs are closely related to tumor occurrence and development [8]. It plays an essential role as “oncogenes” or “tumor suppressor genes,” but the specific regulatory mechanism is still unclear entirely [9]. MicroRNAs are a noncoding single-stranded RNA class with a length of approximately 19–22 nucleotides encoded by endogenous genes [10]. It was stated that miRNA is involved with various types of critical biological processes in the human body through posttranscriptional gene expression regulation [11]. Studies have increasingly reported that miRNAs' abnormal expression is related to various tumors in the body [12]. There is also a close association between AML and several microRNAs [13, 14]. So, in-depth research on the miRNAs' function will have significant scientific significance and clinical value in AML.
MiR-93 belongs to the miR-106b-25 cluster, which can play an essential role in aging, hyperglycemia, and osteoblast calcification [15]. Recently, studies have demonstrated that miR-93-5p could participate in the occurrence, development, and drug resistance of numerous types of tumors [16–18]. Meanwhile, miR-93-5p can act as an oncogene by promoting angiogenesis. It can suppress integrin-β8 expression, which is ultimately associated with the tumor, and overexpression of miR-93 is associated with cell spreading, growth, migration, and tube formation of cancer cells [19]. The highly expressed miR-93-5p has been found in other types of tumors such as neuroblastoma, non-small-cell lung cancer, and lacrimal adenoid cystic carcinoma [20–22]. Furthermore, increased expression of miR-93-5p is associated with the poor prognosis of gastric cancer and squamous cell carcinoma of the head and neck [23, 24]. Still, researchers have found a close association between AML and abnormal expression of miR-93-5p. It can promote tumor growth, blood vessel formation, and cell proliferation in AML. Also, the expression levels of miR-93 are closely associated with VEGF formation in AML. These studies proved that miR-93 is associated with several cancers, including AML [25]. However, the specific molecular mechanism that miR-93-5p participates in AML in pos-transcriptional regulation still needs further study. Therefore, the current study aimed to determine the expression of miR-93-5p and its targeted genes in AML based on integrative bioinformatics analysis and clinical validation.
2. Materials and Methods
2.1. Data Resources
Firstly, to collect the target genes of miR-93-5p, we used the miRNet [26] (https://www.mirnet.ca/miRNet/home.xhtml) to obtain miR-93-5p target genes from miRTarBase v8.0 [27], TarBase v8.0 [28], and miRecords [29] database. Thus, we got 2624 genes that were the targets of miR-93-5p. Moreover, we obtained a gene set that contains 985 genes that closely interact with the pathogenesis of AML from the National Center for Biotechnology Information (NCBI-Gene) database [30] and the Human Online Mendelian Genetic (OMIM) database [31]. Then, we searched in the protein interaction (STRING) database [32]. We further expanded to 3900 genes that are defined as AML-related genes in this study. Through a comprehensive comparative analysis in the expression profiling of AML from The Cancer Genome Atlas (TCGA) database (n = 151) [33], we have initially constructed an expression matrix including miR-93-5p targeted and AML-related potential pathogenic genes.
Furthermore, we constructed a coexpression gene network in AML-related genes profile based on weighted gene coexpression network analysis (WGCNA) [34]. We analyzed the hub genes as key pathogenic markers in dysfunctional modules. Besides, the clinical data of TCGA-LAML was downloaded from TCGA to investigate the survival prognosis of key pathogenic markers. The flowchart of the analysis procedure in the previous study is shown in Figure 1.
Figure 1.
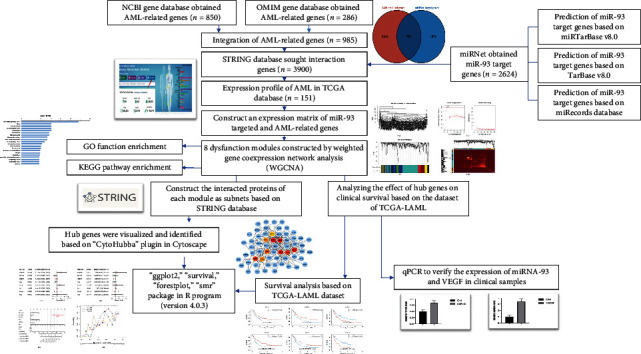
The overall analysis process of the present study.
2.2. Coexpression Recognition Module Based on Relevant Network Analysis
WGCNA is a newly developed method that aims to identify gene modules cooperatively expressed by characteristic genes, explore the association between gene networks and phenotypes of interest, and identify critical genes in a specific phenotype [35]. This new mathematical method is different from previous biological experimental processes. It is an effective way to identify new essential genes involved in AML and discover potential predictive and diagnostic indicators for AML patients. In this study, we used the WGCNA package for constructing the coexpression network of potential pathogenic genes in AML. In the construction process, we chose the unsigned coexpression network, selecting the power of β = 5 as the soft threshold to ensure the connections between genes in the network and obey the scale-free network distribution. The minimal number of genes in an individual module is set as 20.
Finally, the hierarchical clustering tree was constructed through the correlation coefficients between genes, and the similarity coexpression module was shown as the topological overlap matrix (TOM). Besides, to determine the correlation between clinical phenotype and modules, we used the person method to calculate the relationship between module eigengenes and the phenotypes of AML.
2.3. GO Enrichment and KEGG Analyses of the Dysfunctional Modules
To explore the genes' biological functions and signal pathways in dysfunctional modules, we used the GSEA [36] to perform the gene ontology (GO) and the Kyoto Encyclopedia of Genes and Genomes (KEGG) analysis for interested functional modules. The GO terms and KEGG pathways were confirmed as an enrichment when FDR <0.05.
2.4. Identification of Module Hub Genes in Dysfunctional Modules
The biomarker is helpful for the diagnosis, staging, or classification of diseases. Based on WGCNA, we have established a coexpression network of AML-related genes, and we use the Cytoscape (version 3.8.0) for screening the module hub genes [32]. Then, the “CytoHubba” [37] plugins of Cytoscape (version 3.8.0) were used to detect and visualize the hub genes of the interested functional modules. The hub genes were screened with the top 10 degrees in dysfunctional modules.
2.5. Analyzing the Effect of Hub Genes on Clinical Survival Based on the Dataset of TCGA-LAML
To analyze the prognosis value of screened hub genes in AML patients, the clinical information was obtained from the profile of TCGA-LAML (https://portal.gdc.cancer.gov/) in January 2020. The difference between the two groups was compared using KM survival analysis and log-rank.
For the Kaplan–Meier curve analysis, the hazard ratio (HR) with 95% confidence interval (CI) and the P value was derived from log-rank tests and univariate Cox proportional regression [38]. The analysis methods and packages were executed using the R program version 4.0.3 (The R Foundation for Statistical Computing, 2020). P < 0.05 was considered statistically significant.
The univariate and multivariate Cox regression analysis was used to identify the significant variables to establish the nomogram [39]. The “forestplot” package in the R program was used for displaying the forest plot of the P value, HR, and 95% CI between each variable. The multivariate Cox proportional hazard analysis results were used to develop a nomogram for predicting the 3-year overall recurrence. The nomogram provided a graphical contribution of the factors, which can be used to estimate the risk of recurrence for an individual patient by the points associated with each risk factor through the “rms” R package.
2.6. Verifying the Expression of miRNA-93 and VEGF in Clinical Samples
To verify the expression of two molecules from the most significant modules that are still not clearly defined, we have validated the expression of miR-93-5p and VEGF. Bone marrow samples from 18 patients who were newly diagnosed with AML were collected at our institution between January 2019 and September 2019. Diagnose AML according to the classification criteria of the World Health Organization MICM (morphology, immunology, cytogenetics, and molecular biology) [40]. The inclusion criteria were as follows: the bone marrow blasts count of ≥20%. The exclusion criteria were as follows: (1) age at diagnosis <18 years and (2) follow-up information not complete. There were six male patients and 12 female patients, ranging from 20 to 79 years old. Histologically, two patients had M1, nine patients had M2, one patient had M3, two patients had M4, and four patients had M5. The bone marrow samples were collected in anticoagulated tubes before treatment. The leukemic cells were isolated by using 1.077 g/mL Ficoll-Isopaque (Pharmacia). The proportion of leukemic cells was estimated using May–Grünwald–Giemsa-stained cytocentrifuge preparations and light microscopy. The cell samples selected for analysis contained at least 90% blasts after separation. Each sample containing 2 to 10 million cells was stored in TRIzol (Invitrogen, Carlsbad, CA, USA) and frozen at −80°C as soon as possible. The clinical information of the patient included in this study was collected, with the last follow-up on September 30, 2019. The mononuclear cells were isolated from the peripheral blood of two anonymized healthy volunteers as control samples.
cDNA was generated using the Reverse Transcription Kit (Foregene, Chengdu, China). The expression levels of miRNA-93 were quantified using SYBR Green Master Mix (SYBR GREEN, Beijing, China), and the U6 gene was used as an internal control. The following primers were used: miR-93-5p, 5′-CAAAGTGCTGTT CGTGCAGGTAG -3′ and U6 5′-GGATGACACGCAAATTCGTGAAGC-3′. qRT-PCR was performed on ViiATM 7 System software (Thermo Fisher Scientific, ABI7500, USA). The results were normalized to the expression of the U6 gene and are presented as the fold change (2−ΔΔCT). VEGF protein expression by bone marrow mononuclear cells was quantified for media samples collected from different experiments using VEGF ELISA kit per manufacturer protocol (human vascular endothelial growth factor ELISA Kit, Wuhan, China).
3. Results
3.1. Data Processing
To systematically study the critical role of miR-93-5p regulatory target genes in the pathogenesis of AML, we collected a large number of results from multiple online databases. First, we obtained 2624 target genes of miR-93-5p from the miRNet, and these genes were predicted by three commonly used databases (miRTarBase v8.0, TarBase v8.0, and miRecords database). Second, to further screen these target genes related to AML, we sought to obtain 3900 AML-related genes from NCBI-Gene and OMIM databases. Then, we screened 751 interact genes between miR-93-5p target genes and AML-related genes to determine the essential regulatory functions of miR-93-5p and its target genes in AML. The Venn diagram is shown in Figure 2.
Figure 2.
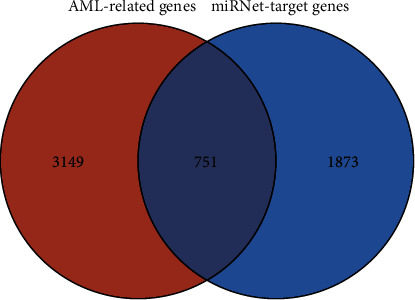
Venn diagram of miR-93-5p target genes and AML-related genes.
3.2. The Coexpression Network of miR-93-5p Target Genes in Acute Myeloid Leukemia Was Constructed Based on the Comprehensive Analysis
In the current research, to match and construct an expression matrix of miR-93-5p targeting AML-related genes, we downloaded the RNA-seq profile of 151 AML samples from the TCGA database. The clinical information is represented in Table 1. In the process of network construction, we adopt a soft threshold (β = 5) to ensure the stability of the scale-free network, and we established eight coexpressed gene modules. The clustering of module gene expression behaviors in AML is shown in Figure 3. The relationship between the modules' connectivity and the gene's significance is as shown in Figure 4. The eigengene adjacency heatmap and module trait relationships are shown in Figure 5.
Table 1.
Clinical information of the patient with AML from TCGA.
| Patient characteristic | Total |
|---|---|
| Age | 54.17 ± 17.07 |
| Gender | |
| Male | 83 |
| Female | 68 |
| Leukocyte | 35.02 ± 41.34 |
| Monocyte | 11.72 ± 15.13 |
| Hemoglobin | 9.47 ± 1.62 |
| Platelet | 64.38 ± 53.13 |
| FAB classification systems | |
|
| |
| Mo | 15 |
| M1 | 35 |
| M2 | 38 |
| M3 | 15 |
| M4 | 29 |
| M5 | 15 |
| M6 | 2 |
| M7 | 1 |
| Not classified | 1 |
| Cytogenetics risk | |
|
| |
| Unclassified | 2 |
| Favorable | 31 |
| Intermediate/normal | 82 |
| Poor | 36 |
Note: FAB classification systems, French-American-British classification systems.
Figure 3.
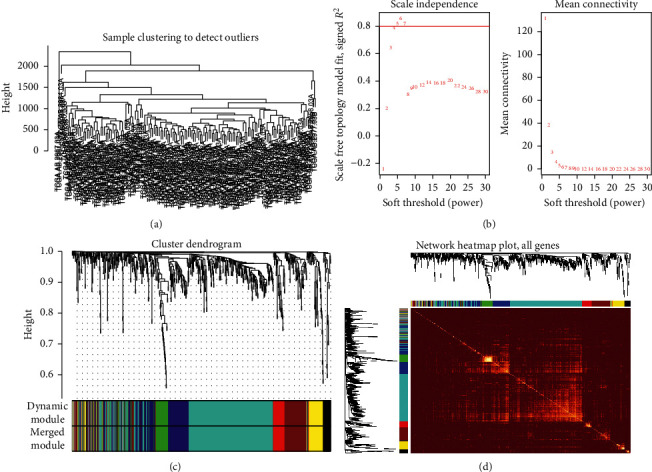
Coexpression relationship of related genes in acute myeloid leukemia clustered into modules. (a) Sample clustering to detect outliers in AML samples. (b) Cluster analysis of the scale-free topology model fit index for soft threshold powers. (c) Heat map of the expression of modular genes in AML samples. It was shown that the expression behavior of 8 modules in 151 AML samples was significantly consistent. (d) Clustering into eight modules based on differential gene coexpression relationship. One-color represents a module. AML: acute myeloid leukemia.
Figure 4.
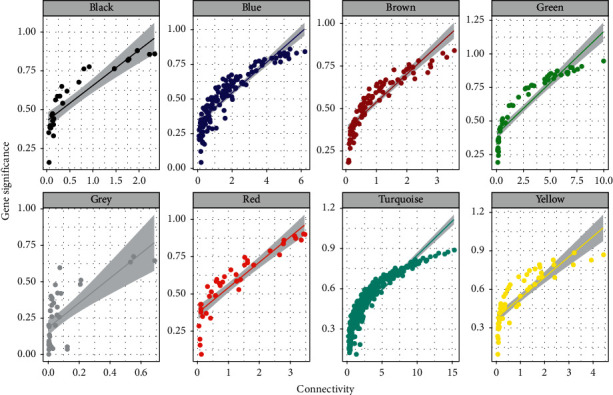
The relationship between the connectivities of the modules in each module.
Figure 5.
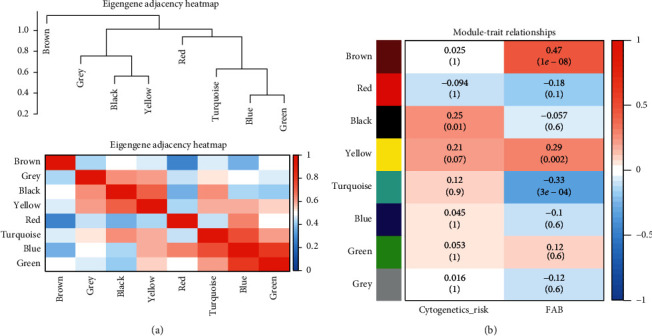
Heatmap of the clustering relationship of eigengenes adjacencies and module trait. (a) The clustering relationship between different modules. The upper part is the clustering tree between modules, and the lower part is the clustering heatmap between the modules. Red represents the closer the similarity, and blue represents the farther the similarity. (b) The clustering relationship between disease characteristics and modules. Red represents an opposite relationship, and blue represents a negative relationship.
3.3. Correlation between Clinical Phenotype and Modules
We found that two modules are significantly correlated with the FAB classified subtypes and cytogenetic risks [41]. According to our finding, both the brown and yellow modules are positively associated with FAB classified subtype of AML (R2 = 0.61 and R2 = 0.51) (Figure 6). Furthermore, we also observed a positive correlation between the yellow module and cytogenetic risks (R2 = 0.28), and brown modules were negatively correlated with cytogenetic risks (R2 = -0.32) (Figure 7). What is noteworthy is that FAB morphological classification and cytogenetic risk are closely associated with the progress of AML, so it is necessary to identify further the biological functions and critical genes of these two modules.
Figure 6.
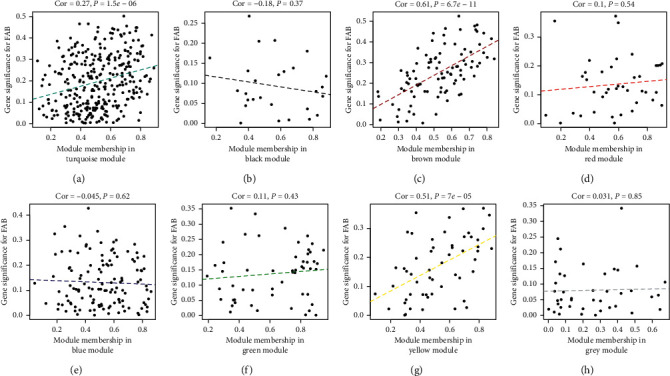
The correlation of FAB classified subtype of AML and dysfunction modules. The brown and yellow modules are significantly associated with FAB classified subtype (P < 0.05).
Figure 7.
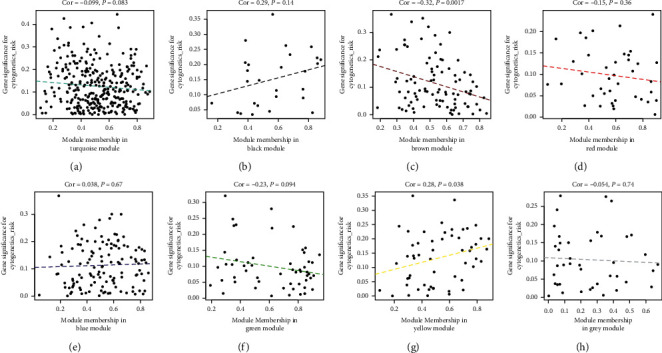
The correlation of cytogenetics risk of AML and dysfunction modules. The brown module is negatively associated with cytogenetics risk (R2 = −0.32, P < 0.05), and the yellow module is oppositely associated with cytogenetics risk (R2 = 0.28, P < 0.05).
3.4. Identification of Functional Modules and Pathways That Are Involved in the Pathogenesis of AML
As the two modules (yellow and brown) have been observed with the highest correlated modules with AML subtype and cytogenetic risk, we performed the GO enrichment on characteristic genes in these two modules, including biological process (BP), cellular component (CC), and molecular function (MF). The mainly enriched terms in the brown module were regulation of protein metabolic and modification process, regulation of intracellular signal transduction, regulation of phosphorus metabolic process, and positive regulation of molecular function. The significant GO terms of the brown module are visualized in Figure 8. Besides, the genes in the yellow module were mainly enriched in response to endogenous stimulus, positive regulation of the developmental process, and cell differentiation and proliferation regulation. The result of GO enrichment of the yellow module is visualized in Figure 9. The KEGG pathway analysis shows that brown and yellow modules are mainly involved pathways in cancer, neurotrophin signaling pathway, focal adhesion, adherens junction, MAPK signaling pathway, insulin signaling pathway, p53 signaling pathway, TGF-beta signaling pathway, mTOR signaling pathway, VEGF signaling pathway, and these signaling pathways involved in the occurrence, invasion, and metastasis of AML (Figure 10).
Figure 8.

The significant GO enrichment results of brown module genes.
Figure 9.
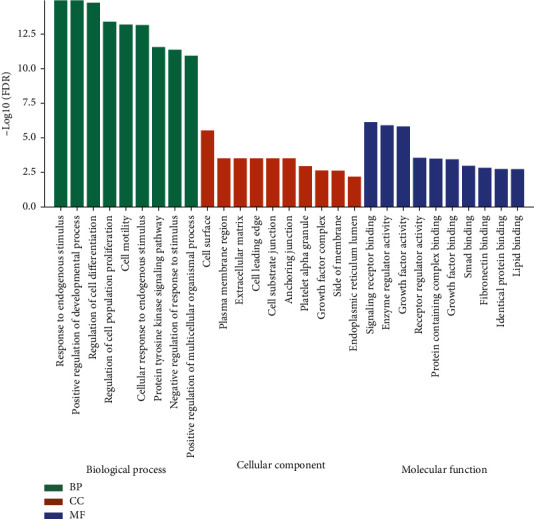
The significant GO enrichment results of yellow module genes.
Figure 10.
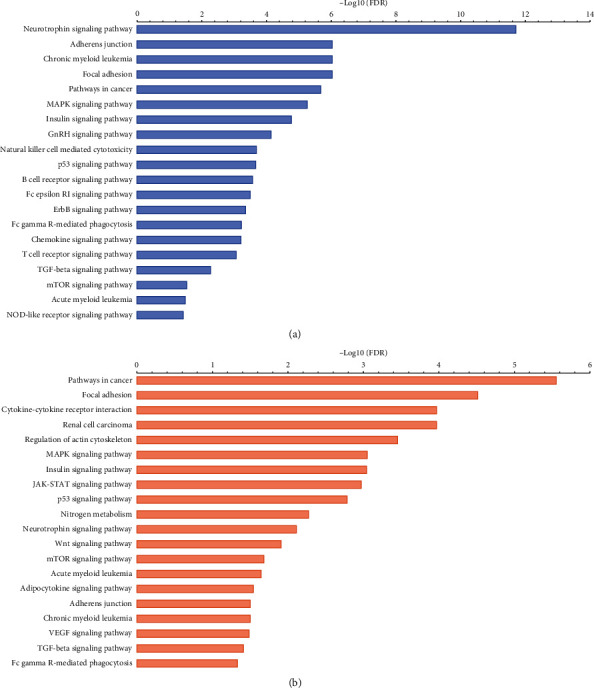
KEGG pathway analysis of two modules. (a) The results of KEGG pathways analysis of the brown module. (b) The results of KEGG pathways analysis of the yellow module.
3.5. Identification of Hub Genes in Coexpression Modules
Our research found that the brown and yellow functional modules are composed of many potential genes, and these genes have significant interaction regulation relationships among different available modules. Therefore, we constructed the protein-protein interaction (PPI) network in brown (83 nodes and 243 edges) and yellow modules (41 nodes and 103 edges) based on the STRING database. Then, we screened the top 10 hub genes in these two modules separately, including MAPK1, ACTB, RAC1, GRB2, MDM2, ACTR2, IGF1R, CDKN1A, YWHAZ, and YWHAB in the brown module (Figure 11), and VEGFA, FGF2, CCND1, FOXO3, IGFBP3, GSF1, IGF2, SLC2A4, PDGFBM, and PIK3R2 in the yellow module (Figure 12). These genes play essential regulatory roles in the modules and have been identified as critical roles in the pathogenesis of AML.
Figure 11.
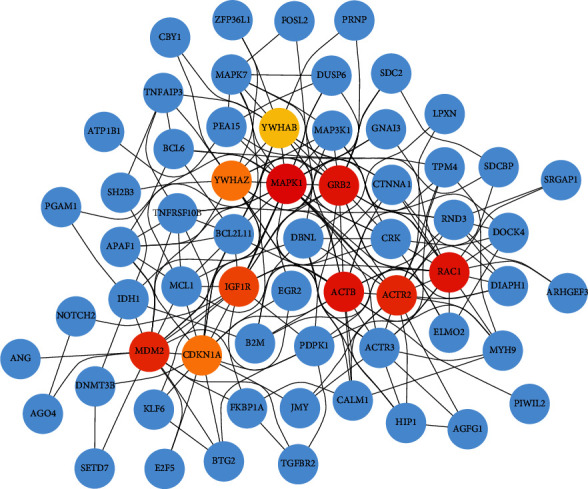
The top 10 hub genes in the brown module. The interaction of top ten hub genes with other genes in the brown module. Dark red to yellowish nodes indicate the hub genes. The hub nodes with dark red indicating the greater degree of interaction and Yellowish color hub nodes indicate the comparatively lower number of interactions. Blue nodes are other genes that are interacting with hub genes.
Figure 12.

The top 10 hub genes in the yellow module. The interaction of top ten hub genes with other genes in the brown module. Dark red to yellowish nodes indicate the hub genes. The hub nodes with dark red indicating the greater degree of interaction and Yellowish color hub nodes indicate the comparatively lower number of interactions. Blue nodes are other genes that are interacting with hub genes.
3.6. The Affection of Hub Genes on Survival in AML Patients
To verify the screened key pathogens' clinical prognosis value, we demonstrated the effects of hub genes on the AML prognosis from the TCGA database. The result shows that six hub genes significantly impact the overall survival by using a log-rank test (P < 0.05). Highly expressed ACTR2 and YWHAB are associated with poor prognosis. Low expression of IGF2, IGFBP3, SLC2A4, and IGF1R is related to poor prognosis contrarily (Figure 13). Besides, the result of nomogram analysis shows that these hub genes both affect AML's overall survival, and we could predict the 1-year, 2-year, and 3-year survival based on patient characteristics and the hub genes expression level (Figure 14).
Figure 13.
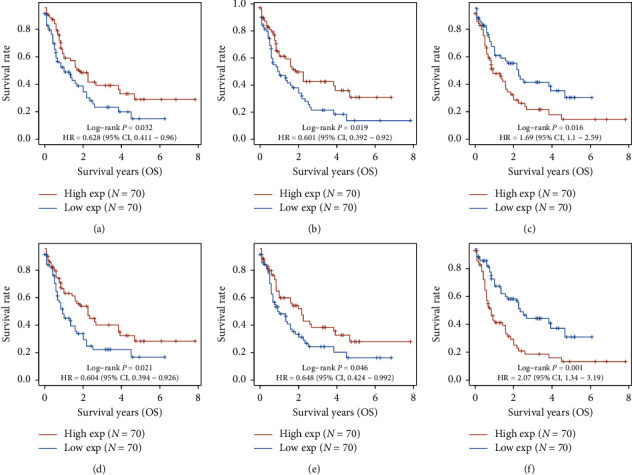
The Kaplan–Meier survival analysis of the gene signature. (a) IGF2, (b) IGFBP3, (c) ACTR2, (d) SLC2A4, (e) IGF1R, and (f) YWHAB.
Figure 14.
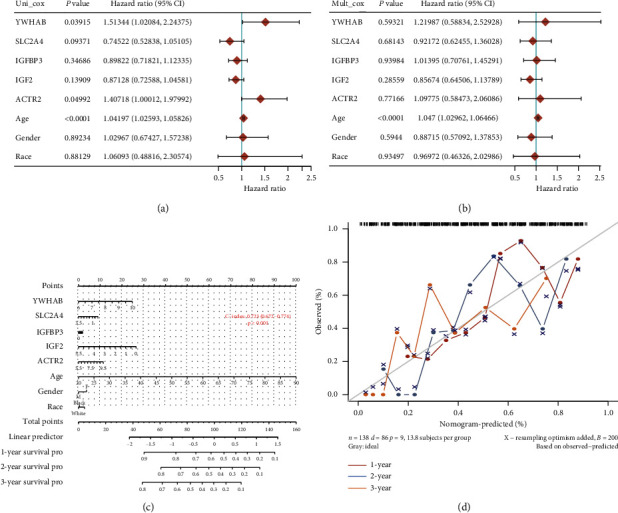
The results of Cox regression and nomogram analysis in hub genes. (a) Hazard ratio and P value involved in univariate Cox regression and the parameters of the hub genes. (b) Hazard ratio and P value involved in multivariate Cox regression and some parameters of the hub genes. (c) Nomogram to predict the 1-year, 2-year, and 3-year overall survival based on AML patients' characteristics and critical gene expression. (d) Calibration curve for the overall survival nomogram model in the discovery group. A dashed diagonal line shows the ideal nomogram, and the blue line, red line, and orange line represent the 1-year, 2-year, and 3-year observed nomograms.
3.7. Validation of the Expression of Key Genes in Clinical Samples
In this study, the miR-93 targeted genes with significant correlation with AML were identified. We noticed that the miR-93-5p targeted genes had not been extensively studied in AML, and the considerable impact of miR-93-5p target gene networks on pathogenesis in AML is still unclear. Thus, to further verify the specific characteristic genes found in this study, we selected the genes with the most significant regulatory relationship among the yellow modules that are significantly positively correlated with the clinical phenotype of AML. Thus, we verified the expression of miR-93-5p and VEGF in our clinical samples. The results indicated that miRNA-93-5p is highly expressed in AML, which is significantly higher than in the healthy (Figure 15). Besides, we also found that VEGF is highly expressed in AML (Figure 16). These results might provide us with novel insights for further molecular phenotype and function mechanism research.
Figure 15.
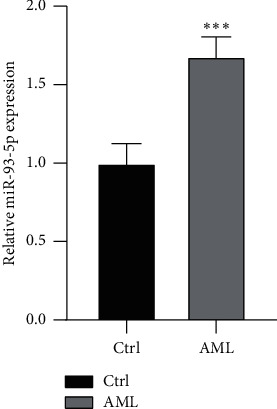
The different expression of miR-93-5p between AML and healthy group. Ctrl represents the healthy group.
Figure 16.
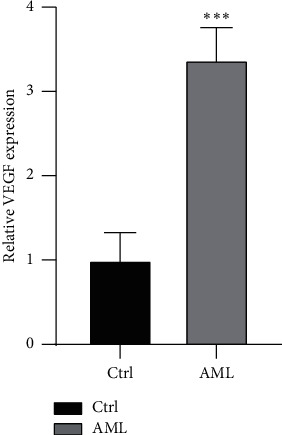
The different expression of VEGF between AML and healthy group. Ctrl represents the healthy group.
4. Discussion
Acute myeloid leukemia (AML) is a highly aggressive malignant tumor caused by abnormal cloning of hematopoietic stem cells [42]. Cytogenetic abnormalities have been identified as diagnostic and prognostic markers [43]. In AML with different genetic characteristics, miRNAs have differential expression profiles, and this differential expression profile can be used as a basis for clinical diagnosis and prognosis of AML [44]. The carcinogenic mechanism of some miRNAs that are abnormally expressed in leukemia has been elucidated [45]. It is expected that drugs targeting these miRNAs will be developed in the future to provide new targets for the treatment of leukemia.
MicroRNA-93 is a member of the miR-106b-25 cluster, located in intron 13 of the MCM7 gene [46]. It is a new type of miRNA that is highly expressed in a variety of human malignancies. Increasing evidence indicates that abnormal expression of miR-93-5p involves many kinds of human tumors [47, 48]. The dysregulation of miR-93-5p is associated with the development of multidrug resistance in various types of cancer [20, 49]. Recently, research has reported miR-93-5p was abnormally expressed in AML, and the abnormal expression of miR-93-5p may affect the prognosis of AML [50]. However, the exact mechanism of miR-93-5p in AML is still unclear. Therefore, to fully explore the specific mechanism of miR-93-5p regulating target genes to mediate in the pathogenesis of AML, we adopted comprehensive bioinformatics research. In this study, we obtained 2,624 miR-93-5p target genes through the prediction of target genes from multiple online databases. At the same time, to further determine these miR-93-5p target genes are closely associated with the pathogenesis of AML, we collected a gene list related to AML through NCBI-GENE and OMIM. Then, we obtained 751 interacted genes between miR-93-5p target genes and AML associated genes. Besides, based on the RNA-seq profile of TCGA-LAML, we constructed an expression matrix for WGCNA analysis. Our new ideas about collecting disease-related genes and gene cluster modularization may provide a feasible research method for other diseases like AML that lack strict controls. As the result of WGCNA, we conducted eight dysfunction modules to characterize the pathogenesis of AML. Interestingly, we found that two modules were significantly correlated with the phenotype of AML. Furthermore, GO analysis shows that these two modules are involved in protein metabolism and modification, intracellular signal transduction, and cell differentiation and proliferation regulation. KEGG pathway analysis also indicates that these two modules were mainly involved in the cancer pathways, such as MAPK signaling pathway, insulin signaling pathway, p53 signaling pathway, TGF-beta signaling pathway, mTOR signaling pathway, VEGF signaling pathway, and other different pathways that are closely connected with the pathogenesis of AML [51, 52].
As we have found in our research, the hub genes with core regulatory roles in brown and yellow modules were further identified. Using connectivity to calculate the relationship between module genes, we screened ten hub genes in each module. VEGF has been a core regulatory position in the yellow module, and MAPK1 also acts as a core regulatory role in the brown module. Vascular endothelial growth factor (VEGF) is an essential factor in promoting angiogenesis in vivo, promoting the proliferation, differentiation, and infiltration of tumor cells [53]. It has been proved that VEGF could lead to an increase of leukemic cells, and patients with higher expression levels of VEGF are more likely to have poor prognoses [54]. Studies have found that AML patients with higher expression of VEGF are more likely to relapse [54, 55]. As far as we have known, angiogenesis plays an essential role in the bone marrow microenvironment, which leads to the pathogenesis, metastasis, and infiltration of AML. The VEGF/VEGFR complex's critical regulatory part in angiogenesis may be the key to studying the pathogenesis of AML [56]. Furthermore, the current studies have found that VEGF may affect the pathogenesis and treatment of AML in three forms: higher levels of VEGF can be detected in the BMSCs of leukemia patients, which resists the apoptosis of leukemia cells by chemotherapeutics through autocrine pathways and promotes leukemia Cell resistance; VEGF can stimulate endothelial cells to secrete growth factors and reversely bind to receptors on leukemia cell membranes, thereby promoting vascular endothelial proliferation and secreting cytokines that encourage cell leukemia proliferation and indirectly promote the pathogenesis of leukemia through the paracrine pathway; VEGF can also promote the expansion of leukemia stem/progenitor cells [57]. Therefore, research on the VEGF signaling pathway's downstream regulatory mechanism will guide the development of new treatments for AML.
In addition, we verified the expression of VEGF and miR-93-5p in our clinical samples. The result shows that these two regulators are both highly expressed in AML compared to those in the healthy group. miRNA-93 is a member of the miR-106b-25 cluster, which plays an essential regulatory function in promoting oncogenes' expression and inhibiting the expression of apoptotic proteins [58]. Studies have shown that the overexpression of miRNA-93 can promote osteosarcoma proliferation and angiogenesis [59]. Besides, experiments on leukemia cells in vitro found that the high expression of miRNA-93 is closely related to the increase of VEGF. The proliferation of VEGF expression level is also clinically associated with AML patients' prognosis [50]. These related results further reflect the potential biological functions of the two biomarkers. Their regulatory relationship could be an essential molecular mechanism that induced tumor cell proliferation and microangiogenesis and even mediates the pathogenesis of AML [60]. Unfortunately, we have not yet found research reports on the exact mechanism of the specific regulatory relationship between miR-93-5p and VEGF. However, after predicting target genes through the TargetScan Human database (http://www.targetscan.org), we discovered that miRNA-93 might be targeting hypoxia-inducible factor 1α (HIF-1α) affecting the expression of VEGF [61]. At the same time, studies have found that the miRNA-93 consensus sequence also exists in the 3′UTR region of VEGF mRNA, which inspires our next research: miRNA-93 may mediate the occurrence development of AML by regulating the expression of HIF-1α/VEGF [22]. However, the cell phenotype produced by miR-93 regulating the expression of HIF-1α/VEGF in AML and whether its expression characteristics are related to the treatment and prognosis of AML are scientific issues worthy of further study.
MiR-93-5p may be associated with the translational signaling of AML and a broader spectrum of hematological malignancies. The mechanistic study revealed that miR-93 was found to inhibit the phosphorylation of AKT (pAKT) [62]. In contrast, miR-93 promoted the proliferation, invasion, progression, and metastasis of cancer cells through activation of PI3K/AKT signaling [16, 63, 64]. Also, overexpression of miR-93 has associated with drug resistance in cancer cells through the miR-93/PTEN/AKT signaling pathway [65]. Besides, the PI3K-Akt-mTOR signaling pathway is upregulated in AML cells, ultimately contributing to metabolic reprogramming of AML [66]. Similarly, dysregulated mammalian target of rapamycin (mTOR) promotes AML. mTOR plays a central role in AML and a broader spectrum of hematological cancers. It was found that the rapamycin derivatives inhibit AKT signaling in primary AML cells both in vitro and in vivo, supporting the therapeutic potential of mTOR inhibition strategies in leukemias and multiple myeloma dissemination and angiogenesis [67, 68]. Interestingly, we also got the mTOR pathway is enriched in the dysfunctional modules (Figure 10) of AML. It was stated that mTOR is implicated in leukemic cell growth, tumor-associated angiogenesis, and VEGF expression in AML [69, 70]. The persistently secreted VEGF from myeloid cells and the elevated levels were detected in the AML microenvironment [56], which is one of the important pathophysiological processes. Since inhibition of mTOR complex 2 restrains tumor angiogenesis, mTORC2 is an advanced stage of a translational application being a theragnostic target [68] and also promotes cancer via the formation of new vessels that are essential for the growth and energy production of cancer cells. Altogether, miR-93 may be associated with regulating the miR-93/AKT/mTOR/VEGF pathway in AML, and clinical investigation will be warranted. However, our findings still need more clinical samples and broader prospective studies to validate further.
5. Conclusions
In summary, our work provides comprehensive and novel insights into the pathogenesis of AML. By constructing a coexpression module of miR-93-5p targeted and AML-related genes and verifying the expression of clinical samples, we initially explored the molecular mechanism of miR-93-5p targeting and regulating VEGF-mediated pathogenesis of AML. Further, we laid a theoretical foundation for the research on targeting miR-93-5p to treat AML.
Acknowledgments
This study was supported by the research funds from the Natural Science Foundation of Xinjiang Uygur autonomous region (Grant no. 2019D01C309).
Data Availability
The data used in this study can be available as follows: TCGA-AML cohort is downloaded from the The Cancer Genome Atlas (TCGA) database (https://portal.gdc.cancer.gov/). The National Biotechnology Information Center Gene (NCBI-Gene) database (https://www.ncbi.nlm.nih.gov/gene) and the Human Online Mendelian Genetic (OMIM) database (https://omim.org/) were utilized for collecting the set of genes.
Ethical Approval
All research was conducted with integrity and in line with the generally accepted ethical principles and approved by the Research Ethics Committee of The First Affiliated Hospital of Xinjiang Medical University (reference no. 220200320). The study was performed following the principles of the Declaration of Helsinki.
Consent
All the participants provided written informed consent to participate in this study. The abovementioned ethics committee approved this consent procedure. All personal information related to the samples involved in the study was anonymized.
Conflicts of Interest
The authors declare that there are no conflicts of interest regarding the publication of this paper.
Authors' Contributions
Jie Wang and Yun Wu contributed equally to this work. All authors have contributed to the research concept, design, and interpretation of the data. Jie Wang acquired and analyzed the data. Jie Wang, Yun Wu, and Xuan-sheng Ding drafted the manuscript. Nazim Uddin, Jian-hua Wang, and Jian-hua Yang were responsible for the work's integrity as a whole. Jian-ping Hao and Rong Chen were accountable for the recruitment of patients and collection of biological samples. Dai-qin Xiong and Nan Ding were responsible for clinical verification. All authors reviewed and approved the final version of the document.
Supplementary Materials
The graphical abstract of the manuscript is included in the supplementary file.
References
- 1.Short N. J., Rytting M. E., Cortes J. E. Acute myeloid leukaemia. The Lancet. 2018;392(10147):593–606. doi: 10.1016/s0140-6736(18)31041-9. [DOI] [PMC free article] [PubMed] [Google Scholar]
- 2.Medinger M., Passweg J. R. Acute myeloid leukaemia genomics. British Journal of Haematology. 2017;179(4):530–542. doi: 10.1111/bjh.14823. [DOI] [PubMed] [Google Scholar]
- 3.Sung H., Ferlay J., Siegel R. L., et al. Global cancer statistics 2020: GLOBOCAN estimates of incidence and mortality worldwide for 36 cancers in 185 countries. CA: A Cancer Journal for Clinicians. 2021:1–41. doi: 10.3322/caac.21660. [DOI] [PubMed] [Google Scholar]
- 4.Abdel-Wahab O., Levine R. L. Mutations in epigenetic modifiers in the pathogenesis and therapy of acute myeloid leukemia. Blood. 2013;121(18):3563–3572. doi: 10.1182/blood-2013-01-451781. [DOI] [PMC free article] [PubMed] [Google Scholar]
- 5.Luo H., Qin Y., Reu F., et al. Microarray-based analysis and clinical validation identify ubiquitin-conjugating enzyme E2E1 (UBE2E1) as a prognostic factor in acute myeloid leukemia. Journal of Hematology & Oncology. 2016;9(1):p. 125. doi: 10.1186/s13045-016-0356-0. [DOI] [PMC free article] [PubMed] [Google Scholar]
- 6.Medinger M., Lengerke C., Passweg J. Novel prognostic and therapeutic mutations in acute myeloid leukemia. Cancer Genomics & Proteomics. 2016;13(5):317–329. [PMC free article] [PubMed] [Google Scholar]
- 7.Beaton M., Peterson G. J., Brien K. Acute myeloid leukemia: advanced practice management from presentation to cure. Journal of the Advanced Practitioner in Oncology. 2020;11(8):836–844. doi: 10.6004/jadpro.2020.11.8.4. [DOI] [PMC free article] [PubMed] [Google Scholar]
- 8.Bartel D. P. MicroRNAs: genomics, biogenesis, mechanism, and function. Cell. 2004;116(2):281–297. doi: 10.1016/s0092-8674(04)00045-5. [DOI] [PubMed] [Google Scholar]
- 9.Pradhan A. K., Emdad L., Das S. K., Sarkar D., Fisher P. B. The enigma of miRNA regulation in cancer. Advances in Cancer Research. 2017;135:25–52. doi: 10.1016/bs.acr.2017.06.001. [DOI] [PubMed] [Google Scholar]
- 10.Lee Y., Kim M., Han J., et al. MicroRNA genes are transcribed by RNA polymerase II. The EMBO Journal. 2004;23(20):4051–4060. doi: 10.1038/sj.emboj.7600385. [DOI] [PMC free article] [PubMed] [Google Scholar]
- 11.Mardani R., Jafari Najaf Abadi M. H., Motieian M., et al. MicroRNA in leukemia: tumor suppressors and oncogenes with prognostic potential. Journal of Cellular Physiology. 2019;234(6):8465–8486. doi: 10.1002/jcp.27776. [DOI] [PubMed] [Google Scholar]
- 12.Drusco A., Croce C. M. MicroRNAs and cancer: a long story for short RNAs. Advances in Cancer Research. 2017;135:1–24. doi: 10.1016/bs.acr.2017.06.005. [DOI] [PubMed] [Google Scholar]
- 13.Ley T. J., Miller C., Ding L., et al. Genomic and epigenomic landscapes of adult de novo acute myeloid leukemia. The New England Journal of Medicine. 2013;368(22):2059–2074. doi: 10.1056/NEJMoa1301689. [DOI] [PMC free article] [PubMed] [Google Scholar]
- 14.Yeh C. H., Moles R., Nicot C. Clinical significance of microRNAs in chronic and acute human leukemia. Molecular Cancer. 2016;15(1):p. 37. doi: 10.1186/s12943-016-0518-2. [DOI] [PMC free article] [PubMed] [Google Scholar]
- 15.Yeung M. L., Yasunaga J.-I., Bennasser Y., et al. Roles for microRNAs, miR-93 and miR-130b, and tumor protein 53-induced nuclear protein 1 tumor suppressor in cell growth dysregulation by human T-cell lymphotrophic virus 1. Cancer Research. 2008;68(21):8976–8985. doi: 10.1158/0008-5472.can-08-0769. [DOI] [PMC free article] [PubMed] [Google Scholar]
- 16.Li N., Miao Y., Shan Y., et al. MiR-106b and miR-93 regulate cell progression by suppression of PTEN via PI3K/Akt pathway in breast cancer. Cell Death & Disease. 2017;8(5) doi: 10.1038/cddis.2017.119.e2796 [DOI] [PMC free article] [PubMed] [Google Scholar]
- 17.Xin L. M., Juan L., Ming X., et al. miR-93-5p transferred by exosomes promotes the proliferation of esophageal cancer cells via intercellular communication by targeting PTEN. Biomedical and Environmental Sciences: BES. 2018;31(3):171–185. doi: 10.3967/bes2018.023. [DOI] [PubMed] [Google Scholar]
- 18.Guan H., Li W., Li Y., et al. MicroRNA-93 promotes proliferation and metastasis of gastric cancer via targeting TIMP2. PLoS One. 2017;12(12) doi: 10.1371/journal.pone.0189490.e0189490 [DOI] [PMC free article] [PubMed] [Google Scholar]
- 19.Fang L., Deng Z., Shatseva T., et al. MicroRNA miR-93 promotes tumor growth and angiogenesis by targeting integrin-β8. Oncogene. 2011;30(7):806–821. doi: 10.1038/onc.2010.465. [DOI] [PubMed] [Google Scholar]
- 20.Yang W., Bai J., Liu D., et al. MiR-93-5p up-regulation is involved in non-small cell lung cancer cells proliferation and migration and poor prognosis. Gene. 2018;647:13–20. doi: 10.1016/j.gene.2018.01.024. [DOI] [PubMed] [Google Scholar]
- 21.Hao J., Jin X., Shi Y., Zhang H. miR-93-5p enhance lacrimal gland adenoid cystic carcinoma cell tumorigenesis by targeting BRMS1L. Cancer Cell International. 2018;18:p. 72. doi: 10.1186/s12935-018-0552-9. [DOI] [PMC free article] [PubMed] [Google Scholar]
- 22.Fabbri E., Montagner G., Bianchi N., et al. MicroRNA miR-93-5p regulates expression of IL-8 and VEGF in neuroblastoma SK-N-AS cells. Oncology Reports. 2016;35(5):2866–2872. doi: 10.3892/or.2016.4676. [DOI] [PubMed] [Google Scholar]
- 23.Zhang S., He Y., Liu C., et al. miR-93-5p enhances migration and invasion by targeting RGMB in squamous cell carcinoma of the head and neck. Journal of Cancer. 2020;11(13):3871–3881. doi: 10.7150/jca.43854. [DOI] [PMC free article] [PubMed] [Google Scholar]
- 24.Ahadi A. A systematic review of microRNAs as potential biomarkers for diagnosis and prognosis of gastric cancer. Immunogenetics. 2021;73:155–161. doi: 10.1007/s00251-020-01201-6. [DOI] [PubMed] [Google Scholar]
- 25.Li L., Zhu L., Wang Y., et al. Profiling of microRNAs in AML cells following overexpression or silencing of the VEGF gene. Oncology Letters. 2017;13(1):105–110. doi: 10.3892/ol.2016.5412. [DOI] [PMC free article] [PubMed] [Google Scholar]
- 26.Chang L., Zhou G., Soufan O., Xia J. miRNet 2.0: network-based visual analytics for miRNA functional analysis and systems biology. Nucleic Acids Research. 2020;48(W1):W244–W251. doi: 10.1093/nar/gkaa467. [DOI] [PMC free article] [PubMed] [Google Scholar]
- 27.Huang H. Y., Lin Y. C., Li J., et al. miRTarBase 2020: updates to the experimentally validated microRNA-target interaction database. Nucleic Acids Research. 2020;48(D1):D148–148D154. doi: 10.1093/nar/gkz896. [DOI] [PMC free article] [PubMed] [Google Scholar]
- 28.Karagkouni D., Paraskevopoulou M. D., Chatzopoulos S., et al. DIANA-TarBase v8: a decade-long collection of experimentally supported miRNA-gene interactions. Nucleic Acids Research. 2018;46(D1):D239–D245. doi: 10.1093/nar/gkx1141. [DOI] [PMC free article] [PubMed] [Google Scholar]
- 29.Xiao F., Zuo Z., Cai G., Kang S., Gao X., Li T. miRecords: an integrated resource for microRNA-target interactions. Nucleic Acids Research. 2009;37:D105–D110. doi: 10.1093/nar/gkn851. [DOI] [PMC free article] [PubMed] [Google Scholar]
- 30.Brown G. R., Hem V., Katz K. S., et al. Gene: a gene-centered information resource at NCBI. Nucleic Acids Research. 2015;43(D1):D36–D42. doi: 10.1093/nar/gku1055. [DOI] [PMC free article] [PubMed] [Google Scholar]
- 31.Amberger J. S., Hamosh A. Searching online mendelian inheritance in man (OMIM): a knowledgebase of human genes and genetic phenotypes. Current Protocols in Bioinformatics. 2017;58:1.2.1–1.2.12. doi: 10.1002/cpbi.27. [DOI] [PMC free article] [PubMed] [Google Scholar]
- 32.Szklarczyk D., Morris J. H., Cook H., et al. The STRING database in 2017: quality-controlled protein-protein association networks, made broadly accessible. Nucleic Acids Research. 2017;45(D1):D362–D368. doi: 10.1093/nar/gkw937. [DOI] [PMC free article] [PubMed] [Google Scholar]
- 33.Cooper L. A., Demicco E. G., Saltz J. H., Powell R. T., Rao A., Lazar A. J. PanCancer insights from the cancer genome atlas: the pathologist’s perspective. The Journal of Pathology. 2018;244(5):512–524. doi: 10.1002/path.5028. [DOI] [PMC free article] [PubMed] [Google Scholar]
- 34.Feltrin A. S., Tahira A. C., Simões S. N., Brentani H., Martins D. C., Jr. Assessment of complementarity of WGCNA and NERI results for identification of modules associated to schizophrenia spectrum disorders. PLoS One. 2019;14(1) doi: 10.1371/journal.pone.0210431.e0210431 [DOI] [PMC free article] [PubMed] [Google Scholar]
- 35.Zhao W., Langfelder P., Fuller T., Dong J., Li A., Hovarth S. Weighted gene coexpression network analysis: state of the art. Journal of Biopharmaceutical Statistics. 2010;20(2):281–300. doi: 10.1080/10543400903572753. [DOI] [PubMed] [Google Scholar]
- 36.Subramanian A., Tamayo P., Mootha V. K., et al. Gene set enrichment analysis: a knowledge-based approach for interpreting genome-wide expression profiles. Proceedings of the National Academy of Sciences. 2005;102(43):15545–15550. doi: 10.1073/pnas.0506580102. [DOI] [PMC free article] [PubMed] [Google Scholar]
- 37.Chin C.-H., Chen S.-H., Wu H.-H., Ho C.-W., Ko M.-T., Lin C.-Y. cytoHubba: identifying hub objects and sub-networks from complex interactome. BMC Systems Biology. 2014;8(4):p. S11. doi: 10.1186/1752-0509-8-s4-s11. [DOI] [PMC free article] [PubMed] [Google Scholar]
- 38.Lin W., Wu S., Chen X., et al. Characterization of hypoxia signature to evaluate the tumor immune microenvironment and predict prognosis in glioma groups. Frontiers in Oncology. 2020;10:p. 796. doi: 10.3389/fonc.2020.00796. [DOI] [PMC free article] [PubMed] [Google Scholar]
- 39.Jeong S.-H., Kim R. B., Park S. Y., et al. Nomogram for predicting gastric cancer recurrence using biomarker gene expression. European Journal of Surgical Oncology. 2020;46(1):195–201. doi: 10.1016/j.ejso.2019.09.143. [DOI] [PubMed] [Google Scholar]
- 40.Arber D. A., Orazi A., Hasserjian R., et al. The 2016 revision to the World Health Organization classification of myeloid neoplasms and acute leukemia. Blood. 2016;127(20):2391–2405. doi: 10.1182/blood-2016-03-643544. [DOI] [PubMed] [Google Scholar]
- 41.Walter R. B., Othus M., Burnett A. K., et al. Significance of FAB subclassification of “acute myeloid leukemia, NOS” in the 2008 WHO classification: analysis of 5848 newly diagnosed patients. Blood. 2013;121(13):2424–2431. doi: 10.1182/blood-2012-10-462440. [DOI] [PMC free article] [PubMed] [Google Scholar]
- 42.Estey E. Acute myeloid leukemia—many diseases, many treatments. New England Journal of Medicine. 2016;375(21):2094–2095. doi: 10.1056/nejme1611424. [DOI] [PubMed] [Google Scholar]
- 43.Yuasa M., Yamamoto H., Mitsuki T., et al. Prognostic impact of cytogenetic evolution on the outcome of allogeneic stem cell transplantation in patients with acute myeloid leukemia in nonremission: a single-institute analysis of 212 recipients. Biology of Blood and Marrow Transplantation. 2020;26(12):2262–2270. doi: 10.1016/j.bbmt.2020.08.026. [DOI] [PubMed] [Google Scholar]
- 44.Wang Y.-X., Zhang T.-j., Yang D.-q., et al. ReducedmiR-215expression predicts poor prognosis in patients with acute myeloid leukemia. Japanese Journal of Clinical Oncology. 2016;46(4):350–356. doi: 10.1093/jjco/hyv204. [DOI] [PMC free article] [PubMed] [Google Scholar]
- 45.Diaz-Beyá M., Brunet S., Nomdedéu J., et al. MicroRNA expression at diagnosis adds relevant prognostic information to molecular categorization in patients with intermediate-risk cytogenetic acute myeloid leukemia. Leukemia. 2014;28(4):804–812. doi: 10.1038/leu.2013.281. [DOI] [PubMed] [Google Scholar]
- 46.Liu S., Patel S. H., Ginestier C., et al. MicroRNA93 regulates proliferation and differentiation of normal and malignant breast stem cells. PLoS Genetics. 2012;8(6) doi: 10.1371/journal.pgen.1002751.e1002751 [DOI] [PMC free article] [PubMed] [Google Scholar]
- 47.Du Y., Kong C. STAT3 regulates miR93-mediated apoptosis through inhibiting DAPK1 in renal cell carcinoma. Cancer Gene Therapy. 2020;27 doi: 10.1038/s41417-020-00235-y. [DOI] [PubMed] [Google Scholar]
- 48.Shi X., Liu T.-T., Yu X.-N., et al. microRNA-93-5p promotes hepatocellular carcinoma progression via a microRNA-93-5p/MAP3K2/c-Jun positive feedback circuit. Oncogene. 2020;39(35):5768–5781. doi: 10.1038/s41388-020-01401-0. [DOI] [PubMed] [Google Scholar]
- 49.Chu S., Liu G., Xia P., et al. miR-93 and PTEN: key regulators of doxorubicin-resistance and EMT in breast cancer. Oncology Reports. 2017;38(4):2401–2407. doi: 10.3892/or.2017.5859. [DOI] [PubMed] [Google Scholar]
- 50.Zhi F., Cao X., Xie X., et al. Identification of circulating microRNAs as potential biomarkers for detecting acute myeloid leukemia. PLoS One. 2013;8(2) doi: 10.1371/journal.pone.0056718.e56718 [DOI] [PMC free article] [PubMed] [Google Scholar]
- 51.Barbosa K., Li S., Adams P. D., Deshpande A. J. The role of TP53 in acute myeloid leukemia: challenges and opportunities. Genes, Chromosomes and Cancer. 2019;58(12):875–888. doi: 10.1002/gcc.22796. [DOI] [PubMed] [Google Scholar]
- 52.Bosman M. C. J., Schuringa J. J., Vellenga E. Constitutive NF-κB activation in AML: causes and treatment strategies. Critical Reviews in Oncology/hematology. 2016;98:35–44. doi: 10.1016/j.critrevonc.2015.10.001. [DOI] [PubMed] [Google Scholar]
- 53.Takei Y., Kadomatsu K., Yuzawa Y., Matsuo S., Muramatsu T. A small interfering RNA targeting vascular endothelial growth factor as cancer therapeutics. Cancer Research. 2004;64(10):3365–3370. doi: 10.1158/0008-5472.can-03-2682. [DOI] [PubMed] [Google Scholar]
- 54.Chen X.-X., Li Z.-P., Zhu J.-H., Xia H.-T., Zhou H. Systematic analysis of autophagy-related signature uncovers prognostic predictor for acute myeloid leukemia. DNA and Cell Biology. 2020;39(9):1595–1605. doi: 10.1089/dna.2020.5667. [DOI] [PMC free article] [PubMed] [Google Scholar]
- 55.Xu H., Mi R., Fan R., Yin Q., Wei X. Effects of thalidomide combined with interferon on inhibiting kasumi-1 cell proliferation. Advances in Clinical and Experimental Medicine. 2016;25(3):403–408. doi: 10.17219/acem/41048. [DOI] [PubMed] [Google Scholar]
- 56.Sanaat Z., Khalili R., Almasi S., et al. Does chemotherapy change expression of VEGF A&C and MVD in acute myeloid leukemia. International Journal of Hematology-Oncology and Stem Cell Research. 2014;8(3):24–29. [PMC free article] [PubMed] [Google Scholar]
- 57.Deak D., Gorcea-Andronic N., Sas V., et al. A narrative review of central nervous system involvement in acute leukemias. Annals of Translational Medicine. 2021;9(1):p. 68. doi: 10.21037/atm-20-3140. [DOI] [PMC free article] [PubMed] [Google Scholar]
- 58.Mardani R., Jafari Najaf Abadi M. H., Motieian M., et al. MicroRNA in leukemia: tumor suppressors and oncogenes with prognostic potential. Journal of Cellular Physiology. 2019;234(6):8465–8486. doi: 10.1002/jcp.27776. [DOI] [PubMed] [Google Scholar]
- 59.Pan Y., Meng M., Zhang G., Han H., Zhou Q. Oncogenic microRNAs in the genesis of leukemia and lymphoma. Current Pharmaceutical Design. 2014;20(33):5260–5267. doi: 10.2174/1381612820666140128211724. [DOI] [PubMed] [Google Scholar]
- 60.Bhayadia R., Krowiorz K., Haetscher N., et al. Endogenous tumor suppressor microRNA-193b: therapeutic and prognostic value in acute myeloid leukemia. Journal of Clinical Oncology. 2018;36(10):1007–1016. doi: 10.1200/jco.2017.75.2204. [DOI] [PubMed] [Google Scholar]
- 61.Liang H. W., Luo B., Du L. H., et al. Expression significance and potential mechanism of hypoxia‐inducible factor 1 alpha in patients with myelodysplastic syndromes. Cancer Medicine. 2019;8(13):6021–6035. doi: 10.1002/cam4.2447. [DOI] [PMC free article] [PubMed] [Google Scholar]
- 62.Bao C., Chen J., Chen D., et al. MiR-93 suppresses tumorigenesis and enhances chemosensitivity of breast cancer via dual targeting E2F1 and CCND1. Cell Death & Disease. 2020;11(8):p. 618. doi: 10.1038/s41419-020-02855-6. [DOI] [PMC free article] [PubMed] [Google Scholar]
- 63.Jiang L., Wang C., Lei F., et al. miR-93 promotes cell proliferation in gliomas through activation of PI3K/Akt signaling pathway. Oncotarget. 2015;6(10):8286–8299. doi: 10.18632/oncotarget.3221. [DOI] [PMC free article] [PubMed] [Google Scholar]
- 64.Li C., Lyu J., Meng Q. H. MiR-93 promotes tumorigenesis and metastasis of non-small cell lung cancer cells by activating the PI3K/akt pathway via inhibition of LKB1/PTEN/CDKN1A. Journal of Cancer. 2017;8(5):870–879. doi: 10.7150/jca.17958. [DOI] [PMC free article] [PubMed] [Google Scholar]
- 65.Chen Q., Qin R., Fang Y., Li H. Berberine sensitizes human ovarian cancer cells to cisplatin through miR-93/PTEN/akt signaling pathway. Cellular Physiology and Biochemistry. 2015;36(3):956–965. doi: 10.1159/000430270. [DOI] [PubMed] [Google Scholar]
- 66.Nepstad I., Hatfield K. J., Grønningsaeter I. S., Reikvam H. The PI3K-Akt-mTOR signaling pathway in human acute myeloid leukemia (AML) cells. International Journal of Molecular Sciences. 2020;21(8) doi: 10.3390/ijms21082907. [DOI] [PMC free article] [PubMed] [Google Scholar]
- 67.Zeng Z., Sarbassov D. D., Samudio I. J., et al. Rapamycin derivatives reduce mTORC2 signaling and inhibit AKT activation in AML. Blood. 2007;109(8):3509–3512. doi: 10.1182/blood-2006-06-030833. [DOI] [PMC free article] [PubMed] [Google Scholar]
- 68.Lamanuzzi A., Saltarella I., Desantis V., et al. Inhibition of mTOR complex 2 restrains tumor angiogenesis in multiple myeloma. Oncotarget. 2018;9(29):20563–20577. doi: 10.18632/oncotarget.25003. [DOI] [PMC free article] [PubMed] [Google Scholar]
- 69.Song G., Li Y., Jiang G. Role of VEGF/VEGFR in the pathogenesis of leukemias and as treatment targets (review) Oncology Reports. 2012;28(6):1935–1944. doi: 10.3892/or.2012.2045. [DOI] [PubMed] [Google Scholar]
- 70.Böhm A., Aichberger K. J., Mayerhofer M., et al. Targeting of mTOR is associated with decreased growth and decreased VEGF expression in acute myeloid leukaemia cells. European Journal of Clinical Investigation. 2009;39(5):395–405. doi: 10.1111/j.1365-2362.2009.02101.x. [DOI] [PubMed] [Google Scholar]
Associated Data
This section collects any data citations, data availability statements, or supplementary materials included in this article.
Supplementary Materials
The graphical abstract of the manuscript is included in the supplementary file.
Data Availability Statement
The data used in this study can be available as follows: TCGA-AML cohort is downloaded from the The Cancer Genome Atlas (TCGA) database (https://portal.gdc.cancer.gov/). The National Biotechnology Information Center Gene (NCBI-Gene) database (https://www.ncbi.nlm.nih.gov/gene) and the Human Online Mendelian Genetic (OMIM) database (https://omim.org/) were utilized for collecting the set of genes.


