

Abstract
Objective:
To assess whether pre-diagnostic lipid levels are associated with ALS risk.
Methods:
We conducted a matched case-control study nested in five large prospective US cohorts (the Nurses’ Health Study, the Health Professionals Follow-up Study, the Cancer Prevention Study II Nutrition Cohort, the Multiethnic Cohort Study, and the Women’s Health Initiative), and identified 275 individuals who developed ALS during follow-up and had provided blood samples before disease diagnosis. For each ALS case, we randomly selected two controls who were alive at the time of the case diagnosis and matched on cohort, birth year (±1 year), sex, race/ethnicity, fasting status, and time of blood draw. We measured total cholesterol (TC), low-density lipoprotein cholesterol (LDL-C), high-density lipoprotein cholesterol (HDL-C), and triglyceride (TG) levels in the plasma samples, and used conditional logistic regression to estimate associations between lipid levels and ALS risk.
Results:
Higher levels of HDL-C were associated with higher ALS risk in an analysis adjusted for the matching factors (risk ratio [RR] Q4 vs. Q1: 1.78, 95% confidence interval [CI]: 1.18 - 2.69, p-trend: 0.007). The estimate remained similar in a multivariable analysis additionally adjusted for body mass index, physical activity, smoking, alcohol intake, plasma urate levels, and use of cholesterol-lowering drugs (RR Q4 vs. Q1: 1.71, 95% CI: 1.07 - 2.73, p-trend: 0.02). Plasma levels of TC, LDL-C, and TG were not associated with ALS risk.
Conclusions:
Higher pre-diagnostic HDL-C levels, but not levels of other lipids, were associated with a higher risk of ALS.
Keywords: Amyotrophic Lateral Sclerosis, Risk factors in epidemiology, Cohort studies
INTRODUCTION
Amyotrophic lateral sclerosis (ALS) is a progressive adult-onset neurodegenerative disease, for which there is no effective treatment that can halt or reverse progression.1 Some, but not all,2 studies have found a lower occurrence of cardiovascular disease (CVD) in ALS patients3, 4 and their relatives5, 6 compared to controls, which could suggest that a favorable vascular risk profile may be associated with increased ALS susceptibility. This is consistent with observations from prospective studies showing that individuals with higher body mass index (BMI)7–9 and diabetes10–12 have lower ALS risk, and with the report of an inverse association between hypercholesterolemia and ALS risk in a retrospective case-control study.13 In contrast, in a recent prospective study, which included pre-symptomatic blood samples, individuals with higher levels of low-density lipoprotein cholesterol (LDL-C) and apolipoprotein B, a measure of the total number of atherogenic lipoprotein particles,14 were more likely to develop ALS than those with lower LDL-C levels.15 Although this study could not adjust for important potential confounders, such as BMI and smoking, the results were consistent with those observed in recent studies where higher genetically determined LDL-C levels were associated with higher risk of ALS.16–18
As few prospective studies on pre-symptomatic lipid levels and ALS risk exist, we conducted a pooled analysis in five large cohort studies to evaluate the association between specific types of plasma lipids and ALS while adjusting for potential confounders.
METHODS
Study populations
We included participants from five large cohort studies: The Nurses’ Health Study (NHS), the Health Professionals Follow-up Study (HPFS), the Cancer Prevention Study II Nutrition Cohort (CPS-II Nutrition), the Multiethnic Cohort Study (MEC), and the Women’s Health Initiative (WHI). Detailed information on each cohort has previously been described.19–23 Table 1 provides a summary of the characteristics of each cohort.
Table 1:
Study populations
| Cohort study | NHS |
HPFS |
CPS-II Nutrition |
MEC |
WHI |
|---|---|---|---|---|---|
| Year established | 1976 | 1986 | 1992 | 1993 | 1993 |
| Year of blood collection | 1989-1990 | 1993-1995 | 1999-2001 | 2001-2006 | 1993-1998 |
| End of follow-upa | Dec. 2010 | Dec. 2010 | Dec. 2010 | Dec. 2012 | Sep. 2012 |
| Number of participants | |||||
| All, n | 121,700 | 51,529 | 184,194 | 215,251 | 161,809 |
| With blood samples, n | 32,826 | 18,018 | 39,380 | 67,594 | 161,809 |
| ALS cases with blood samples, n | 39 | 26 | 58 | 31 | 121 |
| Sex | |||||
| Women, n (%) | 121,700 (100) | 0 (0) | 97,788 (53.1) | 118,441 (55.0) | 161,809 (100) |
| Men, n (%) | 0 (0) | 51,529 (100) | 86,406 (46.9) | 96,810 (45.0) | 0 (0) |
| Age at baseline | |||||
| Years, range | 30-55 | 40-75 | 50-74 | 45-75 | 50-79 |
End of follow-up for the current study, not for the cohort studies.
NHS: The Nurses’ Health Study; HPFS: The Health Professionals Follow-up Study; CPS-II Nutrition: The Cancer Prevention Study II Nutrition Cohort; MEC: The Multiethnic Cohort Study; WHI: The Women’s Health Initiative.
Standard Protocol Approvals, Registrations, and Patient Consents
All of the studies included were reviewed and approved by the institutional review board representing the institution where each study was conducted.
Endpoint definition
Participants in NHS and HPFS were asked to report whether they had received a diagnosis of ALS on the biennial questionnaire. We requested permission from the participant (or a family member if the participant was deceased at the time of writing) to contact their treating neurologist and to obtain a copy of their medical records if an ALS diagnosis was reported. Further, we asked the treating neurologist to complete a questionnaire on the certainty of the diagnosis (definite, probable, or possible) and the clinical history. A neurologist with experience in ALS made the final confirmation of the diagnoses after reviewing medical records. We only included patients defined as definite or probable cases in the study. If we were unable to obtain a copy of the medical record or the neurologist’s questionnaire to confirm the diagnosis of ALS, only patients with ALS specifically listed on the death certificate were included.
For the other cohorts (CPS-II Nutrition, MEC, and WHI), we searched the National Death Index to identify participants who developed ALS during follow-up. Participants with the code 335.2 (motor neuron disease), according to the International Classification of Diseases, Ninth Revision (ICD-9), listed as the underlying or contributing cause of death, were considered to have had ALS. In a validation study, ALS was the primary diagnosis in 90% of the individuals for whom code 335.2 was listed as the cause or contributory cause of death.24 We assigned the date of onset to three years before the date of death, based on median survival among ALS patients.25
In these five cohort studies, we identified a total of 275 ALS cases with available pre-diagnostic blood samples. If more than one sample was available, the earliest sample was selected for this study. For each of the cases, we randomly selected two controls who were alive at the time of the case diagnosis and matched on cohort, birth year (±1 year), sex, ethnicity, fasting status, and time of blood draw.
Assessment of lipids
The concentrations of total cholesterol (TC), triglycerides (TG), high-density lipoprotein cholesterol (HDL-C), and LDL-C were determined directly using the Roche Cobas 6000 system using reagents and calibrators from Roche Diagnostics (Indianapolis, IN). The day-to-day reproducibility in the laboratory, as reflected by coefficient of variation (CV), was low for TC (132.8 mg/dL: 1.6%, 280.4 mg/dL: 1.7%), TG (84.0 mg/dL:1.8%, 201.8 mg/dL: 1.7%), HDL-C (27.0 mg/dL: 3.3%, 54.9 mg/dL: 1.7%), and LDL-C (90 mg/dL: 3.0%, 106 mg/dL: 2.3%, 129 mg/dL: 2.2%). There was insufficient plasma volume to measure lipid concentrations in one case and three controls, so these participants were excluded.
Assessment of covariates
Information on covariates of interest, including education, BMI, smoking, physical activity, alcohol intake, diabetes status, and use of cholesterol-lowering drugs was collected from questionnaires in each cohort. Participants self-reported a prior diagnosis of type 1 or type 2 diabetes mellitus (DM). We used the nearest covariate data collected before or at the time of blood draw.
Statistical Analyses
We used conditional logistic regression to account for matched study design and estimated odds ratios (ORs) and 95% confidence intervals (CIs) for the association between individual lipids and ALS. As the controls in the study were selected using risk-set sampling, the ORs estimate incidence rate ratios.26 The lipids were modeled both as continuous (per 1 standard deviation [SD] increase) and categorical (quartiles) variables to maximize power and to explore possible nonlinear associations. For the continuous analyses, we standardized the lipids within cohort and sex (mean = 0, SD = 1) to account for possible differences in the processing of the samples in each cohort. For the categorical analyses, we categorized the participants into cohort and sex-specific quartiles based on the distribution among the controls. To test for a linear trend across the quartiles, we assigned the median value to each quartile and modeled this variable continuously. In addition, we also evaluated possible nonlinear associations using penalized splines (P-splines) with default parameters and tested for nonlinearity by comparing models with only the linear term to models with the linear term and the spline terms using the likelihood ratio test (LRT). In addition to individual lipids, we also examined the association between the ratio of LDL-C and HDL-C, as previous studies on lipids and ALS included analyses using this ratio. To assess the influence of potential confounders, we used multivariable models including body mass index (BMI; continuous), smoking status (categorical: never smoker, past smoker, current smoker), alcohol intake (categorical: 0 g/d, 1-4 g/d, 5-14 g/d, 15-29 g/d, ≥ 30 g/d of ethanol), physical activity (categorical: tertiles of metabolic equivalent hours of total physical activity [NHS, HPFS, WHI]; tertiles of the amount of moderate and vigorous physical activity [CPS-II, MEC]), plasma urate levels (categorical; quartiles), and use of cholesterol-lowering drugs (categorical: current user, not current user). We used a missing indicator when data were missing for a covariate. To test for effect modification by sex, fasting status (< 8 vs. ≥ 8 hours), BMI (< 26 vs. ≥ 26; corresponding to below or above median value in the controls), and time interval between blood collection and ALS onset (< 5 vs. ≥ 5 years), we included an interaction term, which was the product of individual lipids and the modifier, in separate models. We used the cut-off of 8 hours for fasting status, as eating 8 hours or longer prior to the lipid profiling do not appear to have significant effects on lipid levels.27 We conducted two sensitivity analyses: 1) excluding individuals with diabetes, as diabetes is associated with dyslipidemia28 and lower ALS risk,11 and 2) excluding individuals with the most extreme lipid levels, defined by levels lower than the fifth percentile and higher than the 95th percentile, to evaluate whether outliers influenced the results.
All analyses were conducted using SAS, version 9.4 software (SAS Institute), and R, version 3.6.0 (the R Foundation) using the survival and ggplot2 packages. P-values were considered significant at values <0.05, and all tests were 2-sided.
Data availability
The datasets analyzed in the current study are not publicly available because of restricted access, but further information about the datasets is available from the corresponding author on request.
Results
We identified 275 individuals who were diagnosed with ALS during follow-up among 319,627 participants who provided blood samples in these 5 cohort studies. Among these, 274 cases and 547 matched controls were included in the analyses. Most of the cases (79.6%) were identified using death certificates. There was a higher proportion of female compared to male participants in our study. The blood samples were drawn a median of 4.8 years (interquartile range [IQR] 1.9 - 7.8) before ALS onset. The cases had a lower BMI at baseline than the controls (Table 2). The other characteristics were similarly distributed.
Table 2:
Selected age-standardized characteristics
| Characteristic |
Cases (n=274) |
Controls (n=547) |
P value |
|---|---|---|---|
| Age* | |||
| Mean – years (SD) | 64.6 (7.2) | 64.6 (7.2) | - |
| Sex – no. (%) | |||
| Male | 75 (27.4) | 150 (27.4) | - |
| Female | 199 (72.6) | 397 (72.6) | |
| Fasting status – no. (%) | |||
| <8 hours | 88 (32.1) | 175 (32.0) | - |
| ≥8 hours | 186 (67.9) | 372 (68.0) | |
| Interval from blood draw to ALS onset | |||
| Median – years (IQR) | 4.8 (1.9-7.8) | - | - |
| Body-mass index | |||
| Mean (SD) | 26.2 (4.3) | 26.9 (5.2) | 0.027 |
| Smoking status – no. (%) | |||
| Never smoker | 123 (44.9) | 263 (48.1) | 0.85 |
| Past smoker | 127 (46.4) | 239 (43.7) | |
| Current smoker | 18 (6.6) | 35 (6.4) | |
| Unknown | 6 (2.2) | 10 (1.8) | |
| Race/Ethnicity – no. (%) | |||
| White | 224 (81.8) | 446 (81.5) | - |
| African American | 21 (7.7) | 39 (7.1) | |
| Hispanic | 8 (2.9) | 17 (3.1) | |
| Asian | 10 (3.7) | 20 (3.7) | |
| Other | 6 (2.2) | 17 (3.1) | |
| Not reported | 5 (1.8) | 8 (1.5) | |
| Education – no. (%) | |||
| < High school | 13 (4.8) | 20 (3.7) | 0.50 |
| High school | 48 (17.7) | 84 (15.4) | |
| > High school | 210 (77.5) | 440 (80.9) | |
| Physical activity – no. (%) | |||
| Low levels | 86 (32.6) | 174 (32.9) | 0.99 |
| Medium level | 79 (29.9) | 157 (29.7) | |
| High level | 99 (37.5) | 198 (37.4) | |
| Diabetes – no. (%) | |||
| Yes | 14 (5.1) | 35 (6.4) | 0.46 |
| No | 260 (94.9) | 512 (93.6) | |
| Alcohol intake – no. (%) | |||
| 0 gr/d | 60 (22.9) | 109 (20.7) | 0.49 |
| 1-4 gr/d | 107 (40.8) | 230 (43.6) | |
| 5-14 gr/d | 47 (17.9) | 107 (20.3) | |
| 15-29 gr/d | 32 (12.2) | 46 (8.7) | |
| ≥ 30 gr/d | 16 (6.1) | 35 (6.6) | |
| Cholesterol lowering drug – no. (%) | |||
| Yes | 38 (13.9) | 55 (10.0) | 0.10 |
| No | 236 (86.1) | 492 (90.0) | |
| Plasma urate | |||
| Mean - mg/dl (SD) | 4.98 (1.33) | 5.17 (1.39) | 0.061 |
Values are standardized to the age distribution of the study population. Values of polytomous variables may not sum up to 100% due to rounding. P-values are not given for matching factors (age, sex, race/ethnicity, and fasting status), as these are similar in the two groups by design.
Value is not age-adjusted.
Higher levels of HDL-C were associated with higher risk of ALS (Table 3). In the analysis adjusted for matching factors (age, sex, fasting status, race/ethnicity), the RR comparing the highest vs. lowest quartile was 1.78 (95% CI: 1.18 - 2.69, p-trend: 0.007). The estimate remained similar in a multivariable model additionally adjusted for BMI, physical activity, smoking, alcohol intake, plasma urate levels, and use of cholesterol-lowering drugs (RR top vs. bottom quartile: 1.71, 95% CI: 1.07-2.73, p-trend: 0.02). Higher levels of HDL-C were also associated with higher ALS risk when HDL-C was modeled as a continuous variable (multivariable-adjusted RR per 1 SD increase: 1.22, 95% CI: 1.04-1.43). None of the other lipids was associated with ALS risk. There was no evidence of a nonlinear relationship for HDL-C, TC, or LDL-C with ALS risk (p from LRT > 0.05; Figure 1), but evidence of a nonlinear association was found for TG (p from LRT = 0.009; Figure 1).
Table 3:
Risk ratios and 95% confidence intervals for ALS according to pre-diagnostic serum lipid levels including all participants
| Q1 |
Q2 |
Q3 |
Q4 |
P-trend |
1 SD increase |
|
|---|---|---|---|---|---|---|
| TC | ||||||
| Cases/controls, n | 60/136 | 78/138 | 66/139 | 70/134 | ||
| Model 1 | 1.00 (ref) | 1.29 (0.85-1.97) | 1.09 (0.71-1.67) | 1.19 (0.78-1.82) | 0.53 | 1.04 (0.90-1.21) |
| Model 2 | 1.00 (ref) | 1.37 (0.88-2.12) | 1.14 (0.73-1.77) | 1.24 (0.80-1.92) | 0.46 | 1.06 (0.91-1.23) |
| TG | ||||||
| Cases/controls, n | 87/135 | 60/138 | 60/138 | 67/136 | ||
| Model 1 | 1.00 (ref) | 0.68 (0.45-1.02) | 0.68 (0.45-1.02) | 0.76 (0.51-1.14) | 0.20 | 0.93 (0.81-1.08) |
| Model 2 | 1.00 (ref) | 0.66 (0.44-1.01) | 0.68 (0.44-1.05) | 0.79 (0.52-1.22) | 0.31 | 0.95 (0.82-1.11) |
| HDL-C | ||||||
| Cases/controls, n | 56/135 | 62/137 | 57/139 | 99/136 | ||
| Model 1 | 1.00 (ref) | 1.11 (0.72-1.72) | 0.99 (0.64-1.53) | 1.78 (1.18-2.69) | 0.007 | 1.22 (1.06-1.40) |
| Model 2 | 1.00 (ref) | 1.02 (0.64-1.63) | 0.87 (0.54-1.39) | 1.71 (1.07-2.73) | 0.020 | 1.22 (1.04-1.43) |
| LDL-C | ||||||
| Cases/controls, n | 70/135 | 66/138 | 68/138 | 70/136 | ||
| Model 1 | 1.00 (ref) | 0.92 (0.61-1.40) | 0.95 (0.63-1.45) | 1.00 (0.66-1.50) | 0.90 | 0.99 (0.86-1.15) |
| Model 2 | 1.00 (ref) | 0.92 (0.60-1.40) | 0.95 (0.62-1.47) | 1.09 (0.72-1.67) | 0.56 | 1.02 (0.88-1.19) |
| LDL-C/HDL-C | ||||||
| Cases/controls, n | 81/135 | 76/138 | 59/138 | 58/136 | ||
| Model 1 | 1.00 (ref) | 0.92 (0.62-1.38) | 0.72 (0.48-1.09) | 0.72 (0.48-1.09) | 0.061 | 0.87 (0.75-1.01) |
| Model 2 | 1.00 (ref) | 0.91 (0.60-1.38) | 0.72 (0.46-1.12) | 0.79 (0.50-1.23) | 0.21 | 0.91 (0.77-1.07) |
Model 1: Adjusted for matching factors (age, sex, fasting status, and time of blood draw).
Model 2: Additionally adjusted for BMI, physical activity, smoking, alcohol intake, plasma urate levels, and use of cholesterol lowering drugs.
TC: Total cholesterol; TG: Triglycerides; HDL-C: High-density lipoprotein Cholesterol; LDL-C: Low-density lipoprotein Cholesterol;
BMI: Body mass index.
Figure 1.
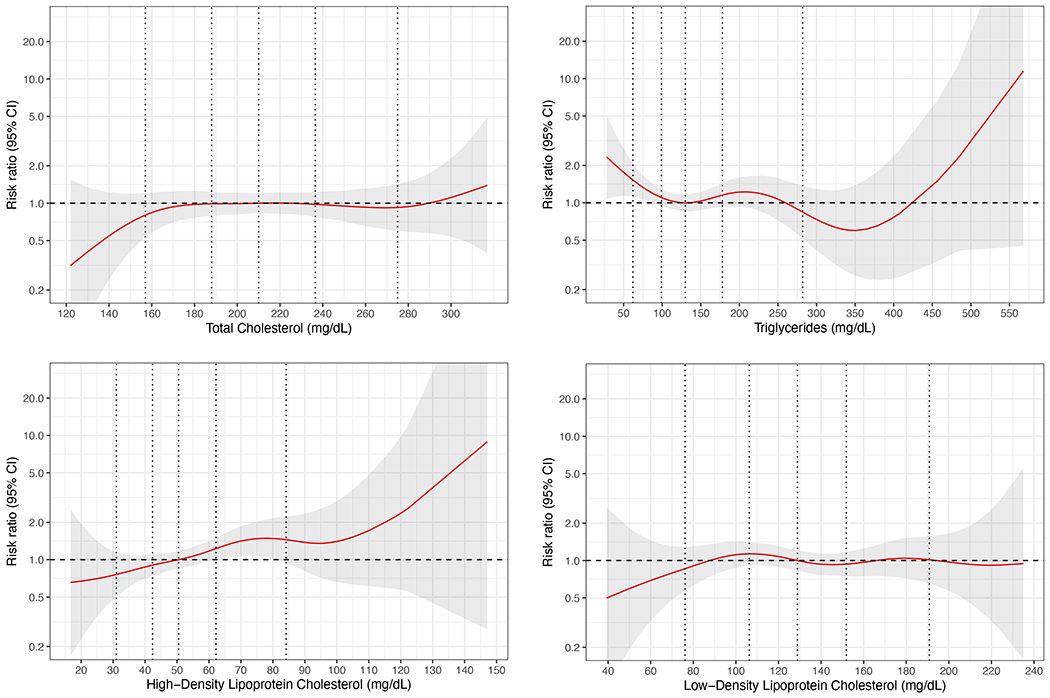
The association of prediagnostic lipid levels with ALS risk using penalized splines (P-splines).
* The red lines represent the risk ratio for ALS according to changes in prediagnostic lipid levels relative to the median level in controls. The shaded regions represent 95% confidence intervals. The vertical lines correspond to the fifth, 25th, 50th, 75th, and 95th percentile for each type of lipid among the controls. The figures are adjusted for body mass index, physical activity, smoking, alcohol intake, plasma urate levels, use of cholesterol lowering drugs, and matching factors (age, sex, fasting status, and time of blood draw).
There was significant effect modification by sex in the association between TG levels and ALS risk (p for effect modification = 0.003), in which higher levels TG were associated with lower ALS risk in men, but not in women (Table 4). Findings for other lipids did not vary significantly by sex, but the risk estimates were higher both for HDL-C and LDL-C in men compared to women. There was no effect modification by BMI for any of the lipids (data not shown). As fasting status can affect blood levels of TG, and, to a lesser extent, of TC and LDL-C,29 we repeated the analyses for these lipids, including only fasting participants (n = 186 cases). In these multivariable analyses, we found a non-significant increase in ALS risk in individuals in the highest quartile of TC (RR top vs. bottom quartile: 1.49, 95% CI: 0.87-2.55, p-trend: 0.21) and LDL-C (RR top vs. bottom quartile: 1.35, 95% CI: 0.80-2.28, p-trend: 0.31), but not for TG (RR top vs. bottom quartile: 0.83, 95% CI: 0.49-1.41, p-trend: 0.43). There was a significant effect modification by fasting for TC (p = 0.038), but not for any of the other lipids.
Table 4:
Risk ratios and 95% confidence intervals for ALS according to prediagnostic serum lipid levels including all participants stratified on sex.
| Q1 |
Q2 |
Q3 |
Q4 |
P-trend |
1 SD increase |
|
|---|---|---|---|---|---|---|
| TC | ||||||
| Men | ||||||
| Cases/controls, n | 12/37 | 27/38 | 20/39 | 16/36 | ||
| RR (95% CI)a | 1.00 (ref) | 2.54 (0.98-6.59) | 2.01 (0.75-5.40) | 1.90 (0.68-5.32) | 0.30 | 1.29 (0.90-1.84) |
| Women | ||||||
| Cases/controls, n | 48/99 | 51/100 | 46/100 | 54/98 | ||
| RR (95% CI)a | 1.00 (ref) | 1.16 (0.69-1.96) | 1.05 (0.62-1.78) | 1.24 (0.75-2.06) | 0.46 | 1.06 (0.88-1.27) |
| TG | P for interaction: 0.83 | |||||
| Men | ||||||
| Cases/controls, n | 29/37 | 16/38 | 21/38 | 9/37 | ||
| RR (95% CI)a | 1.00 (ref) | 0.53 (0.21-1.36) | 0.88 (0.36-2.14) | 0.22 (0.08-0.66) | 0.013 | 0.57 (0.38-0.87) |
| Women | ||||||
| Cases/controls, n | 58/98 | 44/100 | 39/100 | 58/99 | ||
| RR (95% CI)a | 1.00 (ref) | 0.77 (0.47-1.26) | 0.64 (0.38-1.08) | 1.05 (0.64-1.74) | 0.74 | 1.06 (0.89-1.27) |
| HDL-C | P for interaction: 0.003 | |||||
| Men | ||||||
| Cases/controls, n | 10/37 | 21/37 | 16/39 | 28/37 | ||
| RR (95% CI)a | 1.00 (ref) | 1.99 (0.74-5.37) | 1.31 (0.44-3.92) | 2.82 (1.02-7.76) | 0.098 | 1.41 (1.01-1.98) |
| Women | ||||||
| Cases/controls, n | 46/98 | 41/100 | 41/100 | 71/99 | ||
| RR (95% CI)a | 1.00 (ref) | 0.89 (0.51-1.54) | 0.81 (0.47-1.41) | 1.59 (0.92-2.78) | 0.063 | 1.21 (1.00-1.46) |
| LDL-C | P for interaction: 0.34 | |||||
| Men | ||||||
| Cases/controls, n | 12/37 | 18/38 | 24/38 | 21/37 | ||
| RR (95% CI)a | 1.00 (ref) | 1.50 (0.57-3.93) | 3.46 (1.20-9.94) | 3.13 (1.11-8.82) | 0.019 | 1.42 (0.97-2.08) |
| Women | ||||||
| Cases/controls, n | 58/98 | 48/100 | 44/100 | 49/99 | ||
| RR (95% CI)a | 1.00 (ref) | 0.86 (0.52-1.42) | 0.77 (0.46-1.30) | 0.95 (0.58-1.58) | 0.81 | 0.97 (0.81-1.17) |
| LDL-C/HDL-C | P for interaction: 0.29 | |||||
| Men | ||||||
| Cases/controls, n | 22/37 | 15/38 | 21/38 | 17/37 | ||
| RR (95% CI)a | 1.00 (ref) | 0.71 (0.29-1.75) | 0.98 (0.38-2.51) | 0.96 (0.38-2.42) | 0.85 | 0.98 (0.70-1.38) |
| Women | ||||||
| Cases/controls, n | 59/98 | 61/100 | 38/100 | 41/99 | ||
| RR (95% CI)a | 1.00 (ref) | 1.02 (0.62-1.69) | 0.62 (0.36-1.06) | 0.75 (0.43-1.29) | 0.13 | 0.89 (0.74-1.09) |
| P for interaction: 0.88 |
The multivariable model is adjusted for BMI, physical activity, smoking, alcohol intake, plasma urate levels, use of cholesterol lowering drugs, and matching factors (age, sex, fasting status, and time of blood draw).
TC: Total cholesterol; TG: Triglycerides; HDL-C: High-density lipoprotein Cholesterol; LDL-C: Low-density lipoprotein Cholesterol;
BMI: Body mass index; RR: Risk ratio; CI: Confidence interval.
In analyses stratified on the interval between blood draw and ALS onset, the association between HDL-C levels and ALS risk was similar in models restricted to participants with blood samples obtained 5 years or more before ALS onset and participants with blood samples obtained less than 5 years before ALS onset (Table 5). Higher levels of TC were associated with a higher ALS risk in an analysis restricted to blood samples obtained 5 years or more before ALS onset (multivariable-adjusted RR comparing highest vs. lowest quartile: 2.15, 95% CI. 1.10-4.18, p-trend: 0.059), but not in the analysis restricted to blood samples obtained closer to the disease onset. Similarly, higher levels of LDL-C were positively associated with ALS risk in the analysis restricted to blood samples obtained 5 years of more before ALS onset, although the estimated did not reach statistical significance. We repeated the analyses using a time interval of 2 years as cut-off instead of 5 years, and observed no significant differences in risk estimates in participants with an interval of less than two years compared to those with an interval of 2 years and more between blood sample collection and ALS onset (p for interaction was > 0.05 for all lipids).
Table 5:
Risk ratios and 95% confidence intervals for ALS according to prediagnostic serum lipid levels including all participants stratified on interval between blood draw and ALS onset.
| Q1 |
Q2 |
Q3 |
Q4 |
P-trend |
1 SD increase |
|
|---|---|---|---|---|---|---|
| TC | ||||||
| < 5 years | ||||||
| Cases/controls, n | 36/66 | 43/77 | 35/68 | 29/75 | ||
| RR (95% CI)a | 1.00 (ref) | 1.03 (0.56-1.89) | 0.98 (0.55-1.74) | 0.72 (0.38-1.35) | 0.37 | 0.91 (0.73-1.13) |
| ≥ 5 years | ||||||
| Cases/controls, n | 24/70 | 35/61 | 31/71 | 41/59 | ||
| RR (95% CI)a | 1.00 (ref) | 1.78 (0.90-3.55) | 1.38 (0.68-2.83) | 2.15 (1.10-4.18) | 0.059 | 1.26 (0.99-1.59) |
| TG | P for interaction: 0.058 | |||||
| < 5 years | ||||||
| Cases/controls, n | 47/64 | 33/68 | 33/76 | 30/78 | ||
| RR (95% CI)a | 1.00 (ref) | 0.68 (0.38-1.24) | 0.62 (0.34-1.12) | 0.56 (0.30-1.02) | 0.036 | 0.89 (0.72-1.10) |
| ≥ 5 years | ||||||
| Cases/controls, n | 40/71 | 27/70 | 27/62 | 37/58 | ||
| RR (95% CI)a | 1.00 (ref) | 0.70 (0.37-1.31) | 0.74 (0.39-1.42) | 1.17 (0.61-2.24) | 0.51 | 1.04 (0.81-1.33) |
| HDL-C | P for interaction: 0.20 | |||||
| < 5 years | ||||||
| Cases/controls, n | 31/74 | 37/73 | 28/74 | 47/65 | ||
| RR (95% CI)a | 1.00 (ref) | 1.10 (0.59-2.04) | 0.75 (0.39-1.43) | 1.57 (0.81-3.03) | 0.25 | 1.20 (0.95-1.50) |
| ≥ 5 years | ||||||
| Cases/controls, n | 25/61 | 25/64 | 29/65 | 52/71 | ||
| RR (95% CI)a | 1.00 (ref) | 0.85 (0.40-1.82) | 1.08 (0.53-2.23) | 1.85 (0.90-3.79) | 0.037 | 1.25 (0.99-1.59) |
| LDL-C | P for interaction: 0.95 | |||||
| < 5 years | ||||||
| Cases/controls, n | 37/67 | 36/76 | 40/72 | 30/71 | ||
| RR (95% CI)a | 1.00 (ref) | 0.77 (0.42-1.41) | 1.04 (0.58-1.85) | 0.82 (0.44-1.51) | 0.83 | 0.91 (0.73-1.13) |
| ≥ 5 years | ||||||
| Cases/controls, n | 33/68 | 30/62 | 28/66 | 40/65 | ||
| RR (95% CI)a | 1.00 (ref) | 0.97 (0.52-1.83) | 0.84 (0.42-1.67) | 1.40 (0.75-2.62) | 0.33 | 1.15 (0.91-1.45) |
| LDL-C/HDL-C | P for interaction: 0.19 | |||||
| < 5 years | ||||||
| Cases/controls, n | 42/61 | 36/75 | 36/75 | 29/75 | ||
| RR (95% CI)a | 1.00 (ref) | 0.61 (0.33-1.13) | 0.68 (0.37-1.25) | 0.64 (0.34-1.21) | 0.21 | 0.89 (0.70-1.12) |
| ≥ 5 years | ||||||
| Cases/controls, n | 39/74 | 40/63 | 23/63 | 29/61 | ||
| RR (95% CI)a | 1.00 (ref) | 1.23 (0.67-2.25) | 0.62 (0.30-1.29) | 0.96 (0.48-1.89) | 0.59 | 0.93 (0.73-1.19) |
| P for interaction: 0.72 |
The multivariable model is adjusted for BMI, physical activity, smoking, alcohol intake, plasma urate levels, use of cholesterol lowering drugs, and matching factors (age, sex, fasting status, and time of blood draw).
TC: Total cholesterol; TG: Triglycerides; HDL-C: High-density lipoprotein Cholesterol; LDL-C: Low-density lipoprotein Cholesterol;
BMI: Body mass index; RR: Risk ratio; CI: Confidence interval.
In a sensitivity analysis, we excluded participants who had diabetes at the time of blood draw, as diabetes has been associated with higher cholesterol levels and a lower risk of ALS. However, the estimates remained similar in these analyses. For HDL-C, the multivariable-adjusted RR comparing the highest vs. lowest quartile was 1.82 (95% CI: 1.11-3.00, p-trend: 0.018). Further, in a second analysis, we excluded participants with the most extreme lipid levels to evaluate whether outliers had affected our results. The multivariable-adjusted RR comparing the highest vs. lowest quartile of HDL-C was 1.74 (95% CI: 1.01-2.99, p-trend: 0.03), which was similar to the estimate in the main analysis. The results for the other lipids also remained similar (data not shown).
Discussion
In this prospective study, nested in a source population comprising 5 large cohort studies with 275 incident ALS cases, we found a significant association between higher pre-diagnostic levels of HDL-C and risk of ALS. The association was most pronounced in men, but did not vary with the time interval between blood draw and ALS onset. Further, the association was robust to the adjustment of potential confounding factors. Other lipids, including LDL-C, TG, and TC, were not associated with ALS risk in our study.
Our results are not consistent with those obtained in the only previous longitudinal study of pre-symptomatic lipid levels and ALS risk,15 in which higher levels of LDL-C, but not HDL-C, were associated with higher disease risk. The lack of association between HDL-C and ALS risk is further supported by the results of a Mendelian randomization study.18 This could suggest that our findings on HDL-C are affected by confounding or other sources of bias30; however, our results were robust when we adjusted for a large number of possible confounders and in sensitivity analyses. Alternatively, the inconsistency of the association between HDL-C and ALS risk across studies could be related to the heterogeneity of HDL. While HDL-C usually is measured as the total concentration of cholesterol carried in HDL particles, at least 16 subtypes of HDL exist,31 and these have different biological functions,32 and may vary in different populations. Further, the mean age at blood sample collection was higher in our study than in the previous longitudinal study, and a higher proportion of the patients in our study therefore had lipid measurements closer to ALS onset. This may also have contributed to the conflicting findings, as the association may vary according to time to ALS onset.
In analyses restricted to blood samples collected more than 5 years before ALS onset, we observed that both higher levels of TC and LDL-C were associated with an increased ALS, although the latter association did not reach statistical significance. As these analyses are less prone to reverse causation (e.g., by preclinical disease processes in ALS), they could suggest that TC and LDL-C represent risk factors for the disease. This could be consistent with the results from the previous longitudinal study15 and the Mendelian randomization studies,16–18 which found an association between LDL-C and ALS risk. If LDL-C is a risk factor, then we may have been underpowered to detect a significant association in our analyses.
Our findings for HDL-C are consistent with those from previous studies suggesting that a favorable vascular risk profile, or some of its individual components, is a marker of ALS susceptibility. Several of the risk factors that most consistently have been associated with lower ALS risk in longitudinal studies, such as higher BMI7–9 and diabetes,10–12 are also associated with higher CVD risk.33, 34 Further, the occurrence of CVD appears lower both in premorbid ALS patients3, 4 and their relatives,5, 6 although these results were obtained in retrospective studies that were prone to selection and recall bias. While these observations could suggest that specific risk factors have opposite effects on the development of ALS and CVD, they could also be consistent with a broader hypothesis where a shared genetic profile between the two diseases explains the associations.35
ALS is characterized by an impaired energy metabolism, which may contribute to the pathogenesis of the disease. Many patients have an increased energy expenditure consistent with a hypermetabolic state,36–38 indicating that ALS is a systemic disease affecting the overall energy homeostasis. Metabolic alterations correlate with survival time,38–40 and the impaired energy metabolism may therefore represent targets for intervention that can delay the progression of the disease. This is consistent with results from a small phase II trial, where a high-caloric diet was associated with improved survival.41 Still, some patients lost weight even when consuming considerably more than their estimated energy requirement, which could indicate that a high-caloric diet is not targeted enough to compensate fully for the hypermetabolic state. More knowledge on the specific parts of the energy metabolism that are altered in the earliest stages in ALS may offer opportunities for interventions that can delay the progression of the disease.
Our study has several strengths. The nested case-control design makes it unlikely that there were any systematic differences between cases and controls in their source population, procedures of blood collection and processing, or the circumstances of blood collection. As the blood samples from cases and controls were analyzed at the same time, blindly, and in random order, it is unlikely that there were any artefactual differences in the measured lipid levels. Further, as the participants in all of the cohorts completed comprehensive questionnaires on a range of lifestyle factors, we were able to adjust for a great number of potential confounders in our analyses.
Our study also has some limitations. While we included participants from 5 large cohort studies, we only identified 275 ALS cases, which may have limited our statistical power to detect significant differences, especially in the subgroup analyses. This challenge is inherent to the difficulty of conducting prospective studies, which are less prone to bias compared to retrospective studies,42 of a rare disease like ALS. Our study included only 27% male participants, which represents an atypical ALS population, as the disease is more common in men than in women.43 The unusual distribution is mainly due to the inclusion of participants from WHI, who are all females and all contributed with blood samples. We did not have information on clinical covariates related to ALS diagnosis and genetic risk factors, and could therefore not evaluate whether there were differences according to subtypes of ALS (e.g., according to the presence of strong genetic risk factors). Further, because of the lack of clinical information, we used death certificates to identify individuals who developed ALS in WHI, CPS-II, and MEC, which may have led to misclassification of ALS in some participants, as death certificates may have insufficient information to capture ALS. Still, in validation studies, the sensitivity and positive predictive value for the use of death certificates for ALS have been reported to be 84 to 85% and 65 to 82%, respectively,44, 45 indicating that it is an adequate, but not ideal, tool to capture patients with ALS in epidemiological studies. In the cohorts where participants self-reported their diagnosis (NHS and HPFS), we may have missed some ALS cases if they were lost to follow-up. Lastly, as is inherent to any observational study, we cannot exclude the possibility that the results may be affected by residual or unmeasured confounding that we could not account for.
In this study, we found that higher pre-diagnostic levels of HDL-C, but not the levels of other lipids, were associated with a higher risk of ALS.
Acknowledgements
We would like to thank the participants and staff of the NHS, HPFS, MEC, CPS-II, and WHI for their valuable contributions.
Short list of WHI Investigators: Program Office: (National Heart, Lung, and Blood Institute, Bethesda, Maryland) Jacques Rossouw, Shari Ludlam, Joan McGowan, Leslie Ford, and Nancy Geller. Clinical Coordinating Center: (Fred Hutchinson Cancer Research Center, Seattle, WA) Garnet Anderson, Ross Prentice, Andrea LaCroix, and Charles Kooperberg. Investigators and Academic Centers: (Brigham and Women’s Hospital, Harvard Medical School, Boston, MA) JoAnn E. Manson; (MedStar Health Research Institute/Howard University, Washington, DC) Barbara V. Howard; (Stanford Prevention Research Center, Stanford, CA) Marcia L. Stefanick; (The Ohio State University, Columbus, OH) Rebecca Jackson; (University of Arizona, Tucson/Phoenix, AZ) Cynthia A. Thomson; (University at Buffalo, Buffalo, NY) Jean Wactawski-Wende; (University of Florida, Gainesville/Jacksonville, FL) Marian Limacher; (University of Iowa, Iowa City/Davenport, IA) Jennifer Robinson; (University of Pittsburgh, Pittsburgh, PA) Lewis Kuller; (Wake Forest University School of Medicine, Winston-Salem, NC) Sally Shumaker; (University of Nevada, Reno, NV) Robert Brunner. Women’s Health Initiative Memory Study: (Wake Forest University School of Medicine, Winston-Salem, NC) Mark Espeland.
Funding
This study was supported by a grant from the National Institute of Neurological Diseases and Stroke (R01 NS045893) awarded to Alberto Ascherio. The NHS is funded by the National Institutes of Health through grants UM1 CA186107 and R01 CA49449. The HPFS cohort is funded by the National Institutes of Health through grant U01 CA167552. The American Cancer Society, Inc. supports the maintenance and follow-up of the Cancer Prevention Studies. The MEC cohort is funded by the National Institutes of Health through U01 CA164973. The WHI program is funded by the National Heart, Lung, and Blood Institute, National Institutes of Health, U.S. Department of Health and Human Services through contracts, HHSN268201600018C, HHSN268201600001C, HHSN268201600002C, HHSN268201600003C, and HHSN268201600004C. The content is solely the responsibility of the authors and does not necessarily represent the official views of the National Institutes of Health.
Biographies
Biographical notes
Kjetil Bjornevik, MD, PhD, is a Research Scientist in the Neuroepidemiology Research Group at the Harvard T.H. Chan School of Public Health. He received his medical degree and PhD from the University of Bergen, Norway. His main research area of interest is how environmental exposures affect the risk and progression of neurological diseases.
Éilis J. O’Reilly, ScD, received her doctorate in epidemiology from Harvard TH Chan School of Public Health. She currently holds a senior lectureship at the School of Public Health, University College Cork, and is visiting scientist at Harvard TH Chan School of Public Health. Her areas of interest include neuroepidemiology, nutritional epidemiology, biomarkers, and epidemiological methods.
Marianna Cortese, MD, PhD, is a Research Associate in the Neuroepidemiology Research Group at the Harvard T.H. Chan School of Public Health. She obtained her medical degree in 2013 from the University of Heidelberg in Germany and her Ph.D. in Epidemiology in 2017 at the University of Bergen in Norway. Her current work is focused on understanding risk factors of the onset and progression of multiple sclerosis and other neurodegenerative and neurodevelopmental diseases.
Jeremy Furtado, ScD, is the Director of the Nutritional Biomarker Laboratory and a Senior Research Scientist at the Harvard T.H. Chan School of Public Health. His work is focusing on conducting nutrition-focused research studies, including projects on HDL subtypes and their individual association with cardiovascular disease.
Laurence N. Kolonel, MD PhD, is Emeritus Professor of Public Health at University of Hawaii Cancer Center, former director of the Cancer Research Center of Hawai‘I and PI of the Multi-Ethnic Cohort Study. He is an internationally recognized and awarded scholar in the field of chronic disease epidemiology.
Loic Le Marchand, MD PhD, is Professor in the Cancer Epidemiology Program at University of Hawaii Cancer Center, and Clinical Professor of Public Health at John A. Burns School of Medicine, University of Hawaii at Manoa, and PI of the Multi-Ethnic Cohort Study. His main research investigates the interactions between genetic and lifestyle factors responsible for the cancer risk differences that exist among ethnic/racial groups in Hawaii and California, with the goal of advancing our understanding of the causes, mechanisms and prevention of cancer.
Marjorie L. McCullough, ScD, is senior scientific director, epidemiology research, and co-PI of the CPS-II cohort. She conducts research on diet and cancer prevention and survival in the American Cancer Society cohorts, and is an Associate Adjunct Professor at Emory University in the departments of Epidemiology, Global Health (Rollins School of Public Health) and in the Nutrition and Health Sciences Program (Division of Biological Sciences).
Sabrina Paganoni, MD, PhD, is an Assistant Professor at Harvard Medical School and works as a physician scientist at the Healey Center for ALS at Massachusetts General Hospital and at Spaulding Rehabilitation Hospital. Her research focuses on developing new treatments for ALS. She designed and is currently leading several ALS clinical trials that include novel endpoints and biomarkers and innovative trial designs. She is currently the co- Principal Investigator of the HEALEY ALS Platform Trial.
Michael A. Schwarzschild, MD, PhD, is a Professor of Neurology at Harvard Medical School. He is an Associate in Neurology at Massachusetts General Hospital where he also directs the Molecular Neurobiology Laboratory.
Aladdin H. Shadyab, PhD, is an Assistant Professor in the Department of Family Medicine and Public Health at the University of California, San Diego School of Medicine. His research focuses on geriatrics, longevity, and aging. He has expertise in the health of older women and has authored more than 70 scientific publications on lifestyle and genetic factors associated with chronic diseases, successful aging, and longevity.
JoAnn E. Manson, MD, DrPH, holds professorships in epidemiology at Harvard TH Chan School of Public Health and in Medicine at Harvard Medical School. She is Chief in the Division of Preventive Medicine at Brigham and Women’s Hospital, Boston. She has an extensive record of publication in chronic disease epidemiology and prevention, and is PI of the Women’s Health Initiative Study.
Alberto Ascherio, MD, DrPH, is Professor of Epidemiology and Nutrition at the Harvard T.H. Chan School of Public Health. He directs the Neuroepidemiology Research Group, with the purpose of identifying causes, risk factors (positive and negative), and biomarkers of susceptibility and early diagnosis of multiple sclerosis (MS), Parkinson’s disease (PD), and amyotrophic lateral sclerosis (ALS).
Footnotes
Declaration of Interest Statement
Dr. Kjetil Bjornevik reports no disclosures.
Dr. Éilis J. O’Reilly reports no disclosures.
Dr. Marianna Cortese reports no disclosures.
Dr. Jeremy D. Furtado reports no disclosures.
Dr. Laurence N. Kolonel reports no disclosures.
Dr. Loic Le Marchand reports no disclosures.
Dr. Marjorie L. McCullough reports no disclosures.
Dr. Sabrina Paganoni reports research grants from Amylyx Pharmaceuticals, Revalesio Corporation, the ALS Association, ALS Finding a Cure, the American Academy of Neurology, the Salah Foundation, the Spastic Paraplegia Foundation.
Dr. Michael A. Schwarzschild reports no disclosures.
Dr. Aladdin H. Shadyab reports being a consultant for Rancho BioSciences, LLC.
Dr. JoAnn E. Manson reports no disclosures.
Dr. Alberto Ascherio reports no disclosures.
References
- 1.van Es MA, Hardiman O, Chio A, et al. Amyotrophic lateral sclerosis. Lancet 2017;390:2084–2098. [DOI] [PubMed] [Google Scholar]
- 2.Kioumourtzoglou MA, Seals RM, Gredal O, Mittleman MA, Hansen J, Weisskopf MG. Cardiovascular disease and diagnosis of amyotrophic lateral sclerosis: A population based study. Amyotroph Lateral Scler Frontotemporal Degener 2016;17:548–554. [DOI] [PMC free article] [PubMed] [Google Scholar]
- 3.Turner MR, Wotton C, Talbot K, Goldacre MJ. Cardiovascular fitness as a risk factor for amyotrophic lateral sclerosis: indirect evidence from record linkage study. J Neurol Neurosurg Psychiatry 2012;83:395–398. [DOI] [PubMed] [Google Scholar]
- 4.Korner S, Kollewe K, Ilsemann J, et al. Prevalence and prognostic impact of comorbidities in amyotrophic lateral sclerosis. Eur J Neurol 2013;20:647–654. [DOI] [PubMed] [Google Scholar]
- 5.Huisman MH, de Jong SW, Verwijs MC, et al. Family history of neurodegenerative and vascular diseases in ALS: a population-based study. Neurology 2011;77:1363–1369. [DOI] [PubMed] [Google Scholar]
- 6.Visser AE, Seelen M, Hulsbergen A, et al. Exploring the fitness hypothesis in ALS: a population-based case-control study of parental cause of death and lifespan. J Neurol Neurosurg Psychiatry 2017;88:550–556. [DOI] [PubMed] [Google Scholar]
- 7.O’Reilly EJ, Wang M, Adami HO, et al. Prediagnostic body size and risk of amyotrophic lateral sclerosis death in 10 studies. Amyotroph Lateral Scler Frontotemporal Degener 2018;19:396–406. [DOI] [PMC free article] [PubMed] [Google Scholar]
- 8.Aberg M, Nyberg J, Robertson J, et al. Risk factors in Swedish young men for amyotrophic lateral sclerosis in adulthood. J Neurol 2018;265:460–470. [DOI] [PMC free article] [PubMed] [Google Scholar]
- 9.Nakken O, Meyer HE, Stigum H, Holmoy T. High BMI is associated with low ALS risk: A population-based study. Neurology 2019;93:e424–e432. [DOI] [PubMed] [Google Scholar]
- 10.Mariosa D, Kamel F, Bellocco R, Ye W, Fang F. Association between diabetes and amyotrophic lateral sclerosis in Sweden. Eur J Neurol 2015;22:1436–1442. [DOI] [PMC free article] [PubMed] [Google Scholar]
- 11.Kioumourtzoglou MA, Rotem RS, Seals RM, Gredal O, Hansen J, Weisskopf MG. Diabetes Mellitus, Obesity, and Diagnosis of Amyotrophic Lateral Sclerosis: A Population-Based Study. JAMA Neurol 2015;72:905–911. [DOI] [PMC free article] [PubMed] [Google Scholar]
- 12.D′Ovidio F, d′Errico A, Carna P, Calvo A, Costa G, Chio A. The role of premorbid diabetes on developing amyotrophic lateral sclerosis. Eur J Neurol 2018;25:164–170. [DOI] [PubMed] [Google Scholar]
- 13.Seelen M, van Doormaal PT, Visser AE, et al. Prior medical conditions and the risk of amyotrophic lateral sclerosis. J Neurol 2014;261:1949–1956. [DOI] [PubMed] [Google Scholar]
- 14.Contois JH, McConnell JP, Sethi AA, et al. Apolipoprotein B and cardiovascular disease risk: position statement from the AACC Lipoproteins and Vascular Diseases Division Working Group on Best Practices. Clin Chem 2009;55:407–419. [DOI] [PubMed] [Google Scholar]
- 15.Mariosa D, Hammar N, Malmstrom H, et al. Blood biomarkers of carbohydrate, lipid, and apolipoprotein metabolisms and risk of amyotrophic lateral sclerosis: A more than 20-year follow-up of the Swedish AMORIS cohort. Ann Neurol 2017;81:718–728. [DOI] [PubMed] [Google Scholar]
- 16.Chen X, Yazdani S, Piehl F, Magnusson PKE, Fang F. Polygenic link between blood lipids and amyotrophic lateral sclerosis. Neurobiol Aging 2018;67:202 e201–202 e206. [DOI] [PubMed] [Google Scholar]
- 17.Bandres-Ciga S, Noyce AJ, Hemani G, et al. Shared polygenic risk and causal inferences in amyotrophic lateral sclerosis. Ann Neurol 2019;85:470–481. [DOI] [PMC free article] [PubMed] [Google Scholar]
- 18.Zeng P, Zhou X. Causal effects of blood lipids on amyotrophic lateral sclerosis: a Mendelian randomization study. Hum Mol Genet 2019;28:688–697. [DOI] [PMC free article] [PubMed] [Google Scholar]
- 19.Bao Y, Bertoia ML, Lenart EB, et al. Origin, Methods, and Evolution of the Three Nurses’ Health Studies. Am J Public Health 2016;106:1573–1581. [DOI] [PMC free article] [PubMed] [Google Scholar]
- 20.Rimm EB, Giovannucci EL, Willett WC, et al. Prospective study of alcohol consumption and risk of coronary disease in men. Lancet 1991;338:464–468. [DOI] [PubMed] [Google Scholar]
- 21.Calle EE, Rodriguez C, Jacobs EJ, et al. The American Cancer Society Cancer Prevention Study II Nutrition Cohort: rationale, study design, and baseline characteristics. Cancer 2002;94:2490–2501. [DOI] [PubMed] [Google Scholar]
- 22.Kolonel LN, Henderson BE, Hankin JH, et al. A multiethnic cohort in Hawaii and Los Angeles: baseline characteristics. Am J Epidemiol 2000;151:346–357. [DOI] [PMC free article] [PubMed] [Google Scholar]
- 23.Anderson GL, Manson J, Wallace R, et al. Implementation of the Women′s Health Initiative study design. Ann Epidemiol 2003;13:S5–17. [DOI] [PubMed] [Google Scholar]
- 24.Weisskopf MG, McCullough ML, Calle EE, Thun MJ, Cudkowicz M, Ascherio A. Prospective study of cigarette smoking and amyotrophic lateral sclerosis. Am J Epidemiol 2004;160:26–33. [DOI] [PubMed] [Google Scholar]
- 25.Traxinger K, Kelly C, Johnson BA, Lyles RH, Glass JD. Prognosis and epidemiology of amyotrophic lateral sclerosis: Analysis of a clinic population, 1997–2011. Neurol Clin Pract 2013;3:313–320. [DOI] [PMC free article] [PubMed] [Google Scholar]
- 26.Knol MJ, Vandenbroucke JP, Scott P, Egger M. What do case-control studies estimate? Survey of methods and assumptions in published case-control research. Am J Epidemiol 2008;168:1073–1081. [DOI] [PubMed] [Google Scholar]
- 27.Nordestgaard BG, Langsted A, Mora S, et al. Fasting is not routinely required for determination of a lipid profile: clinical and laboratory implications including flagging at desirable concentration cut-points-a joint consensus statement from the European Atherosclerosis Society and European Federation of Clinical Chemistry and Laboratory Medicine. Eur Heart J 2016;37:1944–1958. [DOI] [PMC free article] [PubMed] [Google Scholar]
- 28.Haffner SM, American Diabetes A. Dyslipidemia management in adults with diabetes. Diabetes Care 2004;27 Suppl 1:S68–71. [DOI] [PubMed] [Google Scholar]
- 29.Sidhu D, Naugler C. Fasting time and lipid levels in a community-based population: a cross-sectional study. Arch Intern Med 2012;172:1707–1710. [DOI] [PubMed] [Google Scholar]
- 30.Smith GD, Ebrahim S. ‘Mendelian randomization’: can genetic epidemiology contribute to understanding environmental determinants of disease? Int J Epidemiol 2003;32:1–22. [DOI] [PubMed] [Google Scholar]
- 31.Furtado JD, Yamamoto R, Melchior JT, et al. Distinct Proteomic Signatures in 16 HDL (High-Density Lipoprotein) Subspecies. Arterioscler Thromb Vasc Biol 2018;38:2827–2842. [DOI] [PMC free article] [PubMed] [Google Scholar]
- 32.Sacks FM, Jensen MK. From High-Density Lipoprotein Cholesterol to Measurements of Function: Prospects for the Development of Tests for High-Density Lipoprotein Functionality in Cardiovascular Disease. Arterioscler Thromb Vasc Biol 2018;38:487–499. [DOI] [PMC free article] [PubMed] [Google Scholar]
- 33.Emerging Risk Factors C, Wormser D, Kaptoge S, et al. Separate and combined associations of body-mass index and abdominal adiposity with cardiovascular disease: collaborative analysis of 58 prospective studies. Lancet 2011;377:1085–1095. [DOI] [PMC free article] [PubMed] [Google Scholar]
- 34.Emerging Risk Factors C, Sarwar N, Gao P, et al. Diabetes mellitus, fasting blood glucose concentration, and risk of vascular disease: a collaborative meta-analysis of 102 prospective studies. Lancet 2010;375:2215–2222. [DOI] [PMC free article] [PubMed] [Google Scholar]
- 35.Turner MR. Is cardiovascular fitness a risk factor for ALS? J Neurol Neurosurg Psychiatry 2017;88:538. [DOI] [PubMed] [Google Scholar]
- 36.Desport JC, Preux PM, Magy L, et al. Factors correlated with hypermetabolism in patients with amyotrophic lateral sclerosis. Am J Clin Nutr 2001;74:328–334. [DOI] [PubMed] [Google Scholar]
- 37.Desport JC, Torny F, Lacoste M, Preux PM, Couratier P. Hypermetabolism in ALS: correlations with clinical and paraclinical parameters. Neurodegener Dis 2005;2:202–207. [DOI] [PubMed] [Google Scholar]
- 38.Steyn FJ, Ioannides ZA, van Eijk RPA, et al. Hypermetabolism in ALS is associated with greater functional decline and shorter survival. J Neurol Neurosurg Psychiatry 2018;89:1016–1023. [DOI] [PMC free article] [PubMed] [Google Scholar]
- 39.Desport JC, Preux PM, Truong TC, Vallat JM, Sautereau D, Couratier P. Nutritional status is a prognostic factor for survival in ALS patients. Neurology 1999;53:1059–1063. [DOI] [PubMed] [Google Scholar]
- 40.Jawaid A, Murthy SB, Wilson AM, et al. A decrease in body mass index is associated with faster progression of motor symptoms and shorter survival in ALS. Amyotroph Lateral Scler 2010;11:542–548. [DOI] [PubMed] [Google Scholar]
- 41.Wills AM, Hubbard J, Macklin EA, et al. Hypercaloric enteral nutrition in patients with amyotrophic lateral sclerosis: a randomised, double-blind, placebo-controlled phase 2 trial. Lancet 2014;383:2065–2072. [DOI] [PMC free article] [PubMed] [Google Scholar]
- 42.Giovannucci E, Stampfer MJ, Colditz GA, et al. A comparison of prospective and retrospective assessments of diet in the study of breast cancer. Am J Epidemiol 1993;137:502–511. [DOI] [PubMed] [Google Scholar]
- 43.Kiernan MC, Vucic S, Cheah BC, et al. Amyotrophic lateral sclerosis. Lancet 2011;377:942–955. [DOI] [PubMed] [Google Scholar]
- 44.Stickler DE, Royer JA, Hardin JW. Accuracy and usefulness of ICD-10 death certificate coding for the identification of patients with ALS: results from the South Carolina ALS Surveillance Pilot Project. Amyotroph Lateral Scler 2012;13:69–73. [DOI] [PubMed] [Google Scholar]
- 45.Kioumourtzoglou MA, Seals RM, Himmerslev L, Gredal O, Hansen J, Weisskopf MG. Comparison of diagnoses of amyotrophic lateral sclerosis by use of death certificates and hospital discharge data in the Danish population. Amyotroph Lateral Scler Frontotemporal Degener 2015;16:224–229. [DOI] [PMC free article] [PubMed] [Google Scholar]
Associated Data
This section collects any data citations, data availability statements, or supplementary materials included in this article.
Data Availability Statement
The datasets analyzed in the current study are not publicly available because of restricted access, but further information about the datasets is available from the corresponding author on request.