Abstract
Coronavirus is a fatal disease that affects mammals and birds. Usually, this virus spreads in humans through aerial precipitation of any fluid secreted from the infected entity’s body part. This type of virus is fatal than other unpremeditated viruses. Meanwhile, another class of coronavirus was developed in December 2019, named Novel Coronavirus (2019-nCoV), first seen in Wuhan, China. From January 23, 2020, the number of affected individuals from this virus rapidly increased in Wuhan and other countries. This research proposes a system for classifying and analyzing the predictions obtained from symptoms of this virus. The proposed system aims to determine those attributes that help in the early detection of Coronavirus Disease (COVID-19) using the Adaptive Neuro-Fuzzy Inference System (ANFIS). This work computes the accuracy of different machine learning classifiers and selects the best classifier for COVID-19 detection based on comparative analysis. ANFIS is used to model and control ill-defined and uncertain systems to predict this globally spread disease’s risk factor. COVID-19 dataset is classified using Support Vector Machine (SVM) because it achieved the highest accuracy of 100% among all classifiers. Furthermore, the ANFIS model is implemented on this classified dataset, which results in an 80% risk prediction for COVID-19.
Keywords: COVID-19, SVM, ANFIS, Machine learning, Detection, Risk prediction
Introduction
Health maintenance and improvement are the key to living a healthy life [20, 21, 38, 41, 49], but the outbreak of COVID-19 has become the biggest threat to human existence. COVID-19 is a fatal widespread disease instigated by a recently discovered COVID-191. This disease occurred at the end of 2019 in the Wuhan region of China. This revised version of Covid-19 is produced by a new adherent of the coronavirus family. The findings show that Covid-19 is spread from person to person that causes serious respiratory problems among the affected ones [5, 29, 37]. It has been admitted a plague by the World Health Organization (WHO). Covid-19 is currently evolving global challenges, and like other pandemics, it weakens the health system and poses a substantial risk to the global economy. The Covid-19 has affected the world economy and society [16, 45, 58].
The Establishment and consultants of China alert an outbreak of an unknown form of pneumonia in China’s cities (i.e., Wuhan and Hubei) to the WHO on December 31, 2019. A novel rinsing of COVID-19 was consequently quarantined from the patient on January 7, 2020. The ultimate source from where the virus spread is unknown. WHO put forward the possible continual human-to-human transmission on January 2020 [36]. In the beginning, COVID-19 was spreading only in different regions of China. However, then it starts to spread in different associated countries of China. When this virus starts spreading, there were 600 cases confirmed in China [36] and now more than 424,000 people are infected globally. Several people who globally died because of this virus have been mounted from 18,9002. WHO determined the most common symptoms of this virus are tiredness, fever, and dry cough. The persons with these mild symptoms can be recovered without any necessity of special treatment and medications. However, some patients came forward with more symptoms: runny nose, sore throat, nasal congestion, aches, pain, or diarrhea. Typically, 80% of people who get infected with COVID-19 have mild symptoms of cold3.
The effective strategy for limiting transmission of the virus is self-quarantined (or self-isolation) following the emergence of symptoms [14]. The National Health Service (NHS) concluded some cases with symptoms, i.e., high fever, continuous cough. This is a form of viral pneumonia, so antibiotics are not treating patients well. NHS suggests anyone with these kinds of symptoms should self-isolate themselves for 7 to 14 days4. The main contributions of this paper are:
We present a study of the increasing effect of the COVID-19 pandemic.
The death rate and risk level of COVID-19 can be minimized if detected at an early stage. Therefore, we propose an ANFIS based predictive model for predicting the risk level of COVID-19.
The COVID-19 dataset is analyzed and classified based on the consultants’ latest suggestions and the current situation.
This paper provides the classification results based on parameters for predicting the risk factors of Covid-19 using ANFIS.
The machine learning classifiers are also implemented and the best classifier for this dataset is selected based on a comparative analysis of machine learning classifiers.
Results show that the proposed system effectively recognizes COVID-19 individuals and predicts the risk factor of Covid-19.
The rest of the paper is organized as follows. In Sect. 2, the recent work related to COVID-19 is covered. Section 3 provides the proposed system for the prediction of COVID-19 using classification models described further. The evaluation and experimental results are discussed in Sect. 4, along with a comparative analysis of the classification algorithms. Finally, the paper is concluded in Sect. 5.
Literature review
According to the worldwide pandemic situation 2020, COVID-19 is spreading globally. A large number of people have been affected by this virus5. A good number of researchers have predicted the type of algorithm to combat this virus. In [19] the classifier SVM and mutual information (MI) techniques were applied for data classification of genes. The authors claimed that the SVM classifier accomplished the best mean accuracy rate. Furthermore, authors in [8] used the fuzzy KNN approach on the dataset of Parkinson’s disease and generated a diagnostic system that makes better decisions in clinical diagnosis. A statistical learning model was established in 2020 to help doctors forecast patients with Covid-19 for respiratory failure that requires mechanical ventilation. The accuracy of 84% was predicted from moderate to severe respiratory failure [12]. Authors in [26] used Naïve Bayes classifies to improve the accuracy of predicting heart disease risk. Different machine learning techniques [2], i.e., Artificial Neural Network (ANN), Random Forest (RF), and K-means clustering techniques were implemented for the prediction of diabetes. The ANN technique provides the best accuracy rate of 75.7% in the prediction of diabetes that helps the experts in the diagnosis of diabetes.
In [23], a small amount of data from various hospitals was collected and trained using deep learning models and block-chain-federating learning. The proposed solution detects the pattern of Covid-19 using CT-imaging. The trained model provides the best accurate prediction. Similarly, the authors in [44, 54] used blockchain for a patient-centric framework for Blockchain-enabled healthcare applications. In [52] some researchers also implanted machine learning techniques for predicting hypertension outcomes based on medical data. In [9], the author used four classification algorithms (SVM, DT, RF, and XGBoost) to meet the system’s accuracy level. XGBoost produces the best results among the four classifiers and provides a system accuracy of 94.36% [9, 24]. In [18], the authors implanted an ANFIS model to estimate landslide susceptibility. They implemented this model for the training and validation of the dataset. The predictive model ANFIS model is presented to predict landslides, so the individual can implement this model in different land sliding circumstances [18]. In 2017, the author proposed a system based on SVM and fuzzy to block pornographic contents on the web. The proposed system automatically blocks and detects the adult contents for parent’s convenience [3]. SVM was also used in the statistical learning approach. This type of learning approach implements SVM in a case study where it classifies the hypothesis test data and computes the error rate by using the Gaussian-density function [1, 13]. The sentimental analysis of Twitter data related to the progress of Covid-19 was perceived in 2020. The tweets were classified using machine learning classification methods. Classification accuracy of 91% was observed [40].
Quality of Service (QoS) is an essential factor for the service of cloud computing. The QoS data contains, by default, non-linear property, so it is difficult to build a QoS data prediction model. In [28] the researchers implemented an intelligent technique ANN and proposed a novel QoS prediction approach that presents experimental results on the large scale of QoS service data and guarantees the sustainability of the system. Fuzzy is used for security purposes in mobile computing and cloud computing. Authors in [34] trained ANFIS to predict human brain activity so that it can be used for real cases [42]. Authors in [17, 22, 43] also focused on enhancing the privacy of the individuals’ medical information. Backtracking Search algorithm (BSA) and ANFIS model are used for simulating the Ontario electricity price accurately. The simulation results have been compared for analyzing the best-optimized model between ANN and ANFIS [32].
Authors in [25] implemented a linear Kernel SVM for classification and prediction of social networking data. The accuracy results for the social Internet of Things (IoT) prediction model were from 80 to 90%. The hybrid proposed model was established in [27] using deep learning and classical machine learning for mask detection. SVM, DTs, and other collections of machine learning algorithms were selected for the investigation. SVM achieved the highest accuracy of 99.64% among the other algorithms. Authors in [25] proposed a medical expert system to detect heart-related problems. In this system, electrocardiography (ECG) signals are used for data preprocessing, and algorithms like SVM and other classifiers are handled in removing noise and extracting HRV features [50]. Authors in [53] used the ANFIS model in his proposed work for Cooperative Localization (CL) on the dataset verified by lake trials. The Fuzzy SVM was also implemented for facial emotion recognition in [57]. The authors proposed an expert system in 2019 to diagnose heart disease based on various parameters.
Proposed system
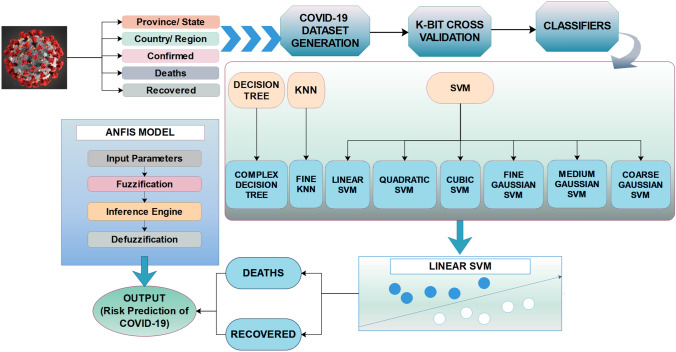
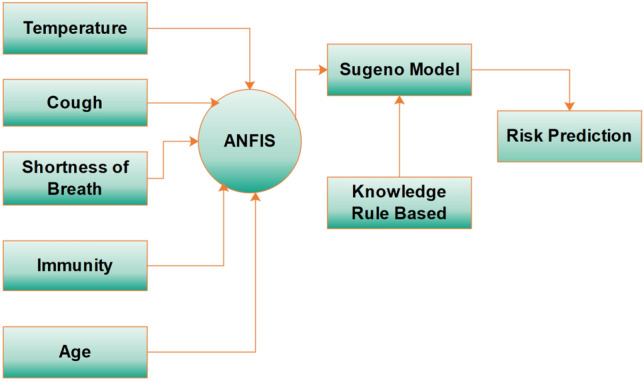
The proposed model shows the classification and identification of parameters of COVID-19 for early detection of COVID-19, with the help of machine learning classifiers and ANFIS. First, the dataset is classified and compared using DT, KNN, and SVM classifiers. Then, the ANFIS predictive model is trained to predict this COVID-19 risk. Figure 1 shows the flow of the proposed system.
Fig. 1.
Proposed System for COVID-19 Risk Prediction
Dataset collection
We use the COVID-19 dataset published on Kaggle6. This dataset contains five attributes that indicate the number of confirmed cases, recovered and death cases infected with the virus. These attributes are applied for the classification and identification of parameters of COVID-19. The dataset collected is trained using classifiers to categorize the patients that died from this virus and the patients recovered from the virus. The dataset contains 1001 cities belonging to three of the attributes confirmed, recovered, and death. The proposed system is for patients recovered from this virus. The risk factor of the globally spread disease is predicted from the ANFIS model. The dataset contains five attributes that classify the data between two classes in ’0’ and ’1’. 0 represents the ’death cases’ by a province/ state, and 1 represents the ’recovered cases’ of this fatal virus.
Table 1 shows the attributes of the dataset description. The dataset contains the total number of states where COVID-19 spread in the human population and the total number of confirmed cases, death cases, and recovered cases in these states collectively.
Table 1.
Attributes of dataset
| Sr.no | Attributes |
|---|---|
| 1 | Province/state |
| 2 | Country/region |
| 3 | Confirmed |
| 4 | Deaths |
| 5 | Recovered |
Data preprocessing
The COVID-19 dataset contains many missing values; for eliminating the missing values, the interpolation method is used. The missing values are filled with the mean, median, or mode values of the respective feature. The dataset also consists of duplicate values. We remove these duplicate values for the best results from all attributes.
Table 2 shows the dataset containing 1001 instances of COVID-19. Furthermore, the feature extraction phase is implemented on the dataset. Feature extraction converts raw data into numerical features. The best features from the dataset are extracted based on histogram graphs. The features ’death cases’ and ’recovered cases’ have the highest probability of data in the COVID-19 dataset.
Table 2.
Dataset description of COVID-19
| No. of rows | No. of columns | Total data | |
|---|---|---|---|
| COVID-19 dataset | 1001 | 5 | 5005 |
Machine learning models
This section presents the machine learning models used for risk prediction.
Decision Tree (DT): It is a supervised machine learning technique that splits the dataset into two or more classes to solve the classification [7]. DT represents a tree with internal nodes that denotes a test of an attribute, each branch represents an outcome of the test, and each of the leaf nodes holds the class label. DT can be trained on both continuous and binary variables. There are different kinds of DT graphs, linear DT, medium DT, and complex DT. The dataset is classified using all these DT classifiers.
K-Nearest Neighbour (KNN): is used to train the dataset and classify the dataset based on similarity and distance measures. KNN points with the distance metrics and several nearest neighbors [55]. In this paper, the nearest neighbors are determined based on Euclidean Distance (ED) shown in Eq. (1).
| 1 |
KNN is further divided into six kinds: fine KNN, medium KNN, coarse KNN, cosine KNN, cubic KNN, and weighted KNN.
Support Vector Machine (SVM): It is a supervised learning approach that processes and classifies nonlinear, high-dimensional, and unbalanced data. SVM algorithm process risk minimization [11]. SVM is good to be trained on a large dataset [46, 47]. Data are classified by using different types of SVM classifiers. The COVID-19 dataset contains values less than 1000 and some extreme values greater than 4000. In a SVM classifier [56], let the training set be , where xi is an input vector and its label. The partition hyperplane can be defined as
| 2 |
In Eq. (2), b is the offset of the hyperplane; is the normal vector of the partition hyperplane. The Eq. (3) is shown below
| 3 |
The Lagrange function can be defined in Eq. (4) :
| 4 |
For hyperplane, dataset D is the set of n couples of elements ( ,) shown below in Eq. (5).
| 5 |
SVM is divided into different types, linear SVM, quadratic SVM, cubic SVM, fine Gaussian SVM, medium Gaussian SVM, and coarse Gaussian SVM.
Adaptive Neuro-Fuzzy Inference System (ANFIS): ANN gives a linear model based on fuzzy rules and expert systems close to human-like expert system [15]. Whereas ANFIS is a combinational model of FIS and ANN [33]. As ANFIS is a hybrid system, so its learning ability is more efficient than FIS models. It creates a valuable competency relationship between input and output [10]. The nodes in the same layer of the architecture perform the same functionality. Thus, the ANFIS implements on the collected dataset to generate a predictive linear expert model to compute the risk prediction level of COVID-19. In this paper, the ANFIS model is used because its learning ability is more efficient than the FIS model [4, 35]. It creates a valuable competency relationship between input and output. The descriptions of the ANFIS layers are as follows:
Layer 1: helps in generating membership functions for each of the nodes. If x is sent as an input, it generates a membership function as A(x). Here, A represents the linguistic label (low, medium, high) that associates with the function of each node shown in Eq. (6).
| 6 |
Layer 2: Every node in layer two is represented with a circle. This layer multiplies signals that it receives and sends the product as an output shown in Eq. (7).
| 7 |
The output that it gives is the firing strength of the rule.
Layer 3: In this layer, the nodes are depicted by a circle shape with label N. Here, the ith node calculates the ratio of the firing strength of the rule to the sum of firing strength of the rules in Eq. (8).
| 8 |
The output of this layer is called the normalized firing strength.
Layer 4: This layer multiplies the output generated by Layer 3 with the Sugeno Model’s output.
| 9 |
In Eq. (9) p, q, r represents the parameter set. The parameters in this layer are known as consequent parameters.
Layer 5: This layer is known as the final layer. It provides summation of all signals that it receives. It is represented by a circle node with the label shown in Eq. (10)
| 10 |
The dataset is passed through all these layers of ANFIS. This helps the model in giving the most accurate risk prediction of this disease.
Evaluation and results
Results are evaluated using the performance measures, where the test data were evaluated using the K-fold cross-validation method. This method computes the accuracy using the number of observations and k-fold validation. It also makes predictions on the input data according to the number of validation folds. For this data, the number of validation folds is 5. The suitable classifier for the dataset is selected based on the Performance Measures.
Table 3 presents the performance measures: accuracy, sensitivity, specificity, and f-measures.
Table 3.
Classification performance using accuracy measure
| Measures | Explanation |
|---|---|
| Accuracy | It measures the accuracy level of predicted instances |
| Sensitivity | It measures the completeness and sensitivity level of the classifier |
| Precision | It refers to how close measurements are to each other |
| ROC curve | It is used to compare the usefulness of the test results |
| Confusion matrix | Displays the total number of observations of data in each cell |
| Scatter plot | Represents the scattered location of data on the x and y axis |
| Specificity | Measures the classifier’s specificity |
| F-Measure | Represents the weighted average of precision and sensitivity |
Machine learning for COVID-19
According to the result, the evaluation of DT classifiers is shown in Table 4 where all classifiers have the same specificity of 13.78% because their true and negative values are the same. At the same time, the performance comparison is based on performance measure sensitivity. Sensitivity computes the completeness level of the classifier, so the sensitivity of all DT classifiers is 96.00%. Other accuracy measures, precision, and F-measure are also 96.00% for all DT classifiers because of the same TN, FP, FN, and TP values.
Table 4.
Comparison of DT performance measures (%)
| DT | Specificity | Sensitivity | Precision | F-Measure | Accuracy |
|---|---|---|---|---|---|
| Linear | 13.78 | 96.00 | 96.00 | 96.00 | 96.00 |
| Medium | 13.78 | 96.00 | 96.00 | 96.00 | 96.00 |
| Complex | 13.78 | 96.00 | 96.00 | 96.00 | 96.00 |
Figure 2 shows the confusion matrix of DT representing the TN, FP, FN, and TP values of the current classifier. Roc curves show the true and false-positive rates for the currently selected, trained classifier. Figure 3 shows one negative class and one area means 100% of the ROC graph is under the curve. ROC curve for the complex DT is shown in Fig. 3.
Fig. 2.
Confusion matrix of complex DT classifier
Fig. 3.
ROC Curve for complex DT
KNN is further divided into six origins, i.e., fine, medium, coarse, cosine, cubic, and weighted. Table (5) shows the positive and negative values of all types of KNN.
Table 5.
True and negative values of KNN
| KNN | TN | FP | FN | TP |
|---|---|---|---|---|
| Fine | 194 | 31 | 31 | 744 |
| Medium | 193 | 32 | 42 | 733 |
| Coarse | 142 | 83 | 41 | 734 |
| Cosine | 96 | 129 | 37 | 738 |
| Cubic | 198 | 27 | 37 | 738 |
| Weighted | 195 | 30 | 27 | 748 |
As a result, the coarse KNN achieved the highest specificity measure. The coarse KNN achieved 57.33% specificity of the dataset shown in Table 6. The fine KNN achieved the highest 96.52% completeness of the dataset among all KNN classifiers measured through specificity. The medium KNN shows the highest precision measurement of 96.52%, and the highest accuracy level of predicted instances is measured through the fine KNN shown below. Fine KNN achieved the highest F-measure that represents the weighted average of precision and sensitivity of the dataset. Based on all KNN classifiers’ performance comparisons, fine KNN achieved the highest accuracy among all KNN classifiers. Therefore, the fine KNN classifier is selected for the best optimized KNN model.
Table 6.
Comparison of KNN performance measures (%)
| KNN | Specificity | Sensitivity | Precision | F-Measure | Accuracy |
|---|---|---|---|---|---|
| Fine | 13.33 | 96.52 | 96.14 | 96.33 | 94.30 |
| Medium | 12.00 | 94.58 | 96.47 | 95.85 | 93.60 |
| Coarse | 57.33 | 94.71 | 85.12 | 89.89 | 83.40 |
| Cosine | 36.89 | 95.23 | 89.84 | 92.21 | 87.60 |
| Cubic | 14.22 | 95.23 | 95.82 | 95.19 | 92.60 |
| Weighted | 13.78 | 96.00 | 96.00 | 96.00 | 93.80 |
Figure 4 shows the confusion matrix of fine KNN representing the TN, FP, FN, and TP values of the fine KNN Classifier. Roc curves show the true and false-positive rates of the fine KNN Classifier. Figure 5 shows that there is 1 negative class and the 0.915914 area of the ROC graph is under the curve of the positive predictive class.
Fig. 4.
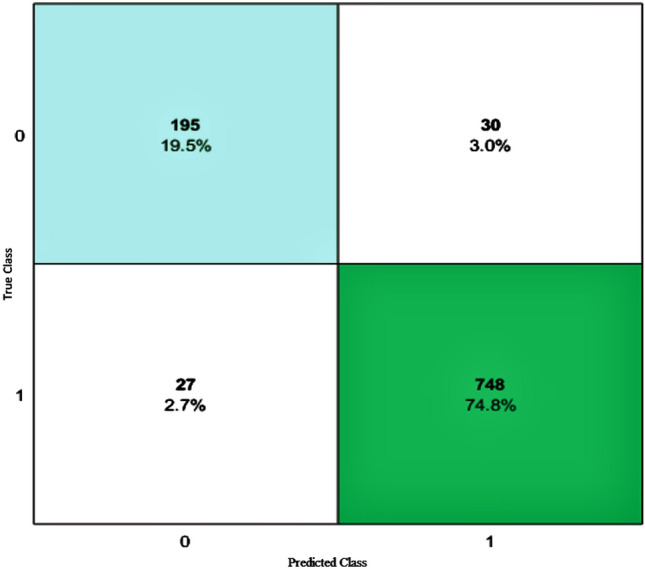
Confusion matrix of fine KNN classifier
Fig. 5.
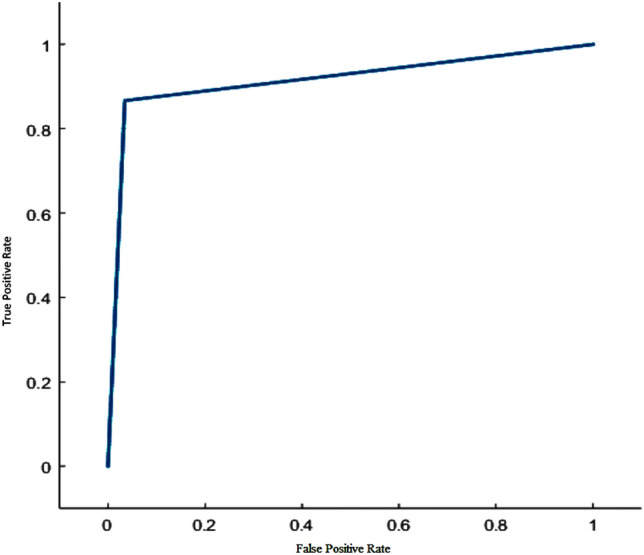
ROC curve for fine KNN classifier
SVM also divides further, i.e., linear, quadratic, cubic, fine Gaussian, medium Gaussian, and coarse Gaussian [6]. Table 7 shows the TN, FP, FN, and TP values for SVM Classifier.
Table 7.
True and negative values of SVM
| SVM | TN | FP | FN | TP |
|---|---|---|---|---|
| Linear | 225 | 0 | 0 | 775 |
| Quadratic | 197 | 28 | 770 | 5 |
| Cubic | 173 | 52 | 30 | 745 |
| Fine Gaussian | 84 | 141 | 15 | 760 |
| Medium Gaussian | 50 | 175 | 14 | 761 |
| Coarse Gaussian | 19 | 206 | 3 | 772 |
Fine Gaussian SVM achieved the highest specificity of the dataset among all subdivided SVM classifiers that 37.33%. Completeness of the dataset is measured to specificity, that is, 98.06% as shown in Table 8. Precision measures the accuracy of the dataset, and fine Gaussian SVM results in 93.48% precision. The cubic SVM computes the highest weighted average through F-Measure, which is 94.78%, while linear SVM achieves the highest accuracy of 100%. The linear SVM classifier is the most appropriate and optimized SVM model for the COVID-19 dataset based on the best accuracy.
Table 8.
Comparison of SVM performance measures
| SVM | Specificity | Sensitivity | Precision | F-Measure | Accuracy |
|---|---|---|---|---|---|
| Linear | 0.00 | 1.00 | 1.00 | 1.00 | 100.00 |
| Quadratic | 12.44 | 0.65 | 15.15 | 1.25 | 20.2 |
| Cubic | 23.11 | 96.12 | 93.48 | 94.78 | 91.8 |
| Fine Gaussian | 37.33 | 98.06 | 84.35 | 90.69 | 84.4 |
| Medium Gaussian | 22.22 | 98.19 | 81.30 | 88.95 | 81.1 |
| Coarse Gaussian | 8.44 | 99.61 | 78.94 | 87.93 | 79.1 |
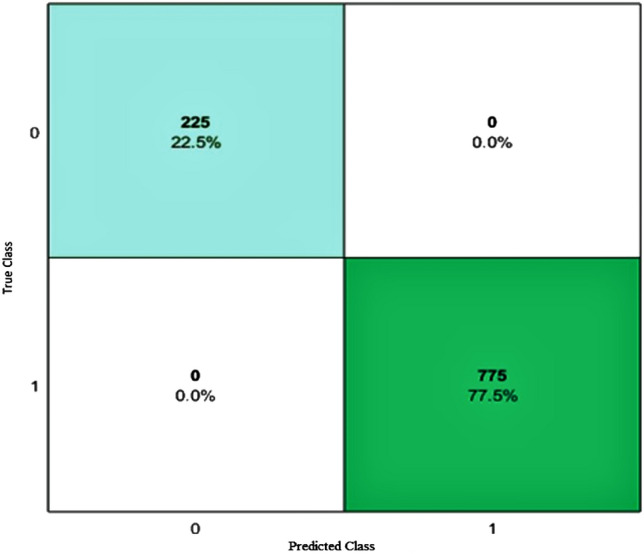
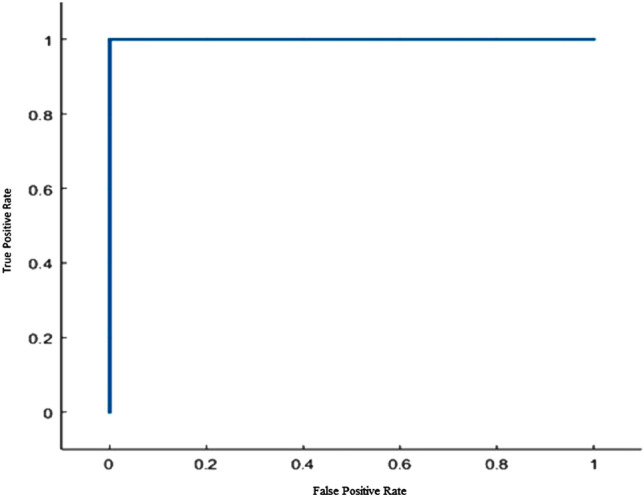
Figure 6 shows the confusion matrix of SVM with the total number of observations made by the linear SVM Classifier in each cell that represents through TN, FP, FN, and TP values of the classifier. ROC curves show the true and false-positive rates for the currently selected, trained classifier. Figure 7 shows one negative class, and 1 area means 100% of the ROC graph is under the positive predictive class curve. Therefore, linear SVM predicted the 100% values positively on the COVID dataset. The linear SVM achieved the best 100% results in the classification dataset. Furthermore, the risk prediction level is determined according to the data classified by the classifiers.
Fig. 6.
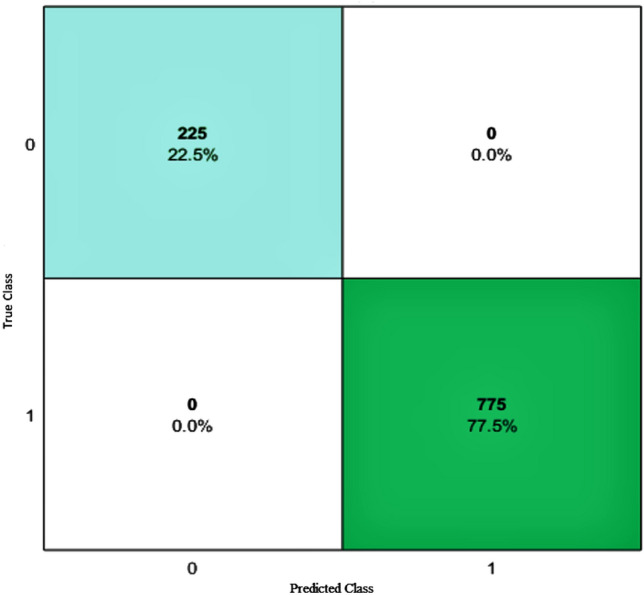
Confusion matrix of linear SVM classifier
Fig. 7.
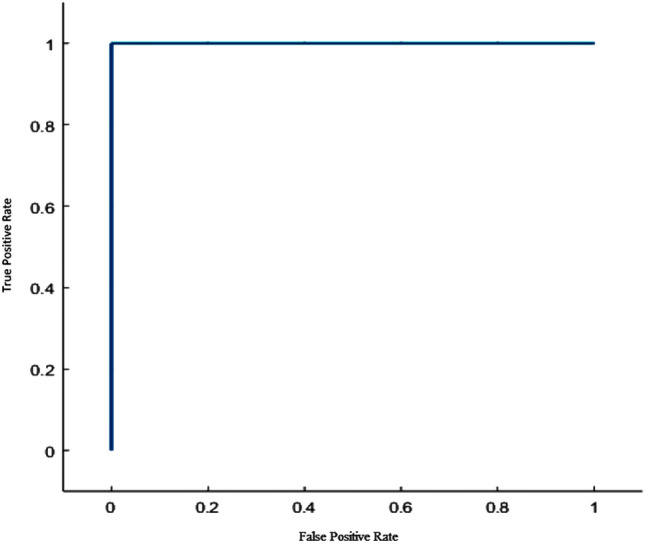
ROC Curve for linear SVM classifier
ANFIS for COVID-19
With the help of SVM, the correctly predicted values separate from the dataset. These positive values are used in the generation of input parameters of the COVID-19 dataset for ANFIS. After seeing the recovered classified cases of COVID-19, a new dataset is generated for the COVID-19 risk predictive model. The data comprises inputs that are the COVID-19 parameters, i.e., temperature (low, high, medium), cough (low, high, medium), shortness of breath (low, high, medium), age (low, high, medium), Immunity (low, high, medium). These parameters and datasets are generated with help from different websites and expert advice. The output parameter comprises risk prediction (low, medium, high). The collected input parameters are based on the symptoms of COVID-19 specified by the consultants.
Table 9 shows that the input parameters are assigned with linguistic variables and specified ranges.
Table 9.
Linguistic labels for fuzzy variables
| Sr. No. | Parameters | Linguistic labels | Ranges |
|---|---|---|---|
| 1 | Temperature | Low, medium, high | [80,97], [92,100], [97,104] |
| 2 | Cough | Low, medium, high | [0.1, 0.4], [0.2, 0.8], [0.4, 1] |
| 3 | Shortness_of_Breath | Low, medium, high | [0.1, 0.4], [0.2, 0.8], [0.4, 1] |
| 4 | Age | Low, medium, high | [1, 40], [35, 65], [40, 85] |
| 5 | Immunity | Low, medium, high | [0.1, 0.4], [0.2, 0.8], [0.4, 1] |
Table 10 comprises the input data used for making rules and further preprocessing. The data values of cough, shortness of breath, and Immunity are assumed in the form of a percentage (i.e., 0.3x100=30%). The sample data spaces consist of 300 instances of data. About 70% of the sample data is used for training and 30% is used for testing. Sugeno FIS model always computes predictions in the form of numeric data [39].
Table 10.
Input data collection
| Temperature | Cough | Shortness of Breath | Immunity | Age |
|---|---|---|---|---|
| 100 | 0.3 | 0.4 | 0.9 | 20 |
| 100 | 0.2 | 0.8 | 0.5 | 6 |
| 101 | 0.2 | 0.5 | 0.6 | 12 |
| 102 | 0.4 | 0.9 | 1 | 24 |
| 100 | 0.5 | 0.8 | 0.9 | 28 |
| 99 | 0.6 | 1 | 0.7 | 35 |
| 100 | 0 | 0.4 | 0.4 | 70 |
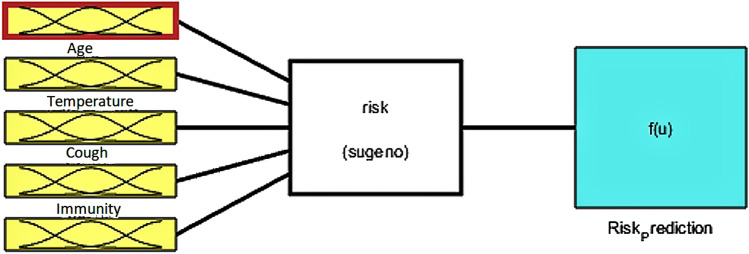
Figure 8 represents the proposed Sugeno FIS model for COVID-19 risk prediction that describes temperature, cough, Immunity, shortness of breath, the adage took as input parameters and their linkage with the ANFIS Sugeno model [59] and generated rules for finding the risk prediction, while Fig. 9 represents the proposed ANFIS predictive model. The research paper’s predictive model is shown by loading the input parameters of COVID-19 to input the variables, using the applicable rules for the defuzzification of data to find the risk prediction as an output.
Fig. 8.
Sugeno FIS model
Fig. 9.
ANFIS predictive model
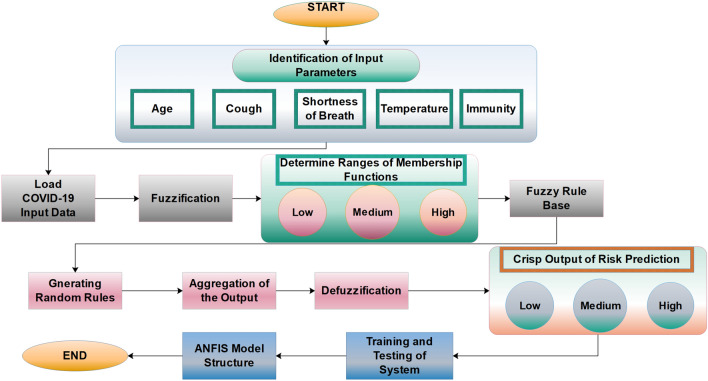
The steps of the fuzzy inference system for calculating the risk prediction are given below:
Identifying the input parameter that helps in the estimation of the disease.
Load the data values of the input parameters.
The parameters are assigned to linguistic variables.
Assigning ranges of the variables and plot their membership functions.
Knowledge base containing information base and control rule base.
Generating rules according to the input parameters that affect the system.
Graphical representation of the rules.
Aggregation of generated random rules output.
Defuzzification of the interface.
Surface Viewer of the input and output parameters.
Train and test data.
Generate ANFIS structure model.
The proposed system implements all these steps and predicts the risk level of the people affected with COVID-19. Training data is loaded for the training of the Sugeno-based ANFIS risk prediction model. Almost 70% of the whole data is loaded into MATLAB.
Generating ANFIS: Next, we implement the ANFIS of the selected Sugeno model, after defining inputs, parameters, and output variables [48]. The ANFIS model’s structure consists of input parameters, membership functions of input, and fuzzy rules that are the fuzzy logic’s backbone. The Sugeno model is developed in a fuzzy inference system by taking temperature, cough, immersion, shortness of breath, and age as inputs, and risk prediction is selected as the output as shown in Fig. 10.
Fig. 10.
Sugeno model showing input and output
In fuzzy, a fuzzy set’s membership function summarizes the indicator function for the sets’ classification. It represents the degree of truth of the addition of the evaluation. We select each input and define the membership function for each parameter. Compared to Mamdani FIS, the Sugeno membership parameters select automatically. The membership functions are defined, the type of input membership functions, and the type of output membership functions.
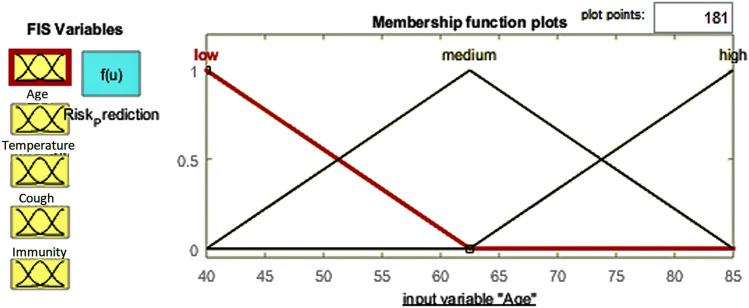
In Fig. 11, three membership functions are estimated for the suitable ranges of input values (low, medium, and high) of the COVID risk prediction. Each of the parameters defines three membership functions (low, medium, and high) to predict the risk factor [30]. For each parameter, the ranges are defined for low, medium, and high as their membership plot [51].
Fig. 11.
Membership function of temperature associating inputs with outputs
The membership function helps in the prediction of risk define within specific ranges.
After defining the membership ranges, the function rules are defined based on the if-then rule if the risk is detected. There are 215 rules in the rule editor. The output of each rule generated combines four input variables and three membership functions. Rule sets are illustrated below.
IF (age is low) and (temperature is low) and (cough is low) and (shortness_of_breath is low) and (Immunity is low) THEN (risk_prediction is high)
IF (age is low) and (temperature is low) and (cough is low) and (shortness_of_breath is low) and (Immunity is medium) THEN (risk_prediction is medium)
IF (age is medium) and (temperature is low) and (cough is medium) and (shortness_of_breath is low) and (Immunity is high) THEN (risk_prediction is low)
IF (age is medium) and (temperature is low) and (cough is medium) and (shortness_of_breath is low) and (Immunity is high) THEN (risk_prediction is low)
IF (age is high) and (temperature is medium) and (cough is high) and (shortness_of_breath is medium) and (Immunity is medium) THEN (risk_prediction is high)
The rules are randomly generated based on the symptoms that detect the disease, i.e., the person whose age is below 11 or above 70 has low Immunity; low Immunity leads to a higher risk of virus infection. Sugar cancer heart patients also need strict precautions because they have a low immune system. Fuzzy IF/THEN rules with variations in output are shown in Tables 11,12 and 13. The rules are made for each of the five input parameters with their 3 membership functions to the power 3 equals 125 rules generated in the FIS.
Table 11.
Fuzzy if/then rules when output is low
| Age | Temperature | Cough | Shortness_of_breath | Immunity | Risk_prediction |
|---|---|---|---|---|---|
| Medium | Medium | Medium | Low | Medium | Low |
| Low | High | Low | Low | Medium | Low |
| High | Medium | Low | Medium | High | Low |
Table 12.
Fuzzy if/then rules when output is medium
| Age | Temperature | Cough | Shortness_of_breath | Immunity | Risk_prediction |
|---|---|---|---|---|---|
| Medium | Medium | High | Low | Medium | Medium |
| Low | High | Medium | Low | Medium | Medium |
| High | High | High | Medium | High | Medium |
Table 13.
Fuzzy if/then rules when output is high
| Age | Temperature | Cough | Shortness_of_breath | Immunity | Risk_prediction |
|---|---|---|---|---|---|
| Low | High | Medium | Medium | Low | High |
| Medium | Low | High | High | Medium | High |
| High | Medium | High | Medium | Low | High |
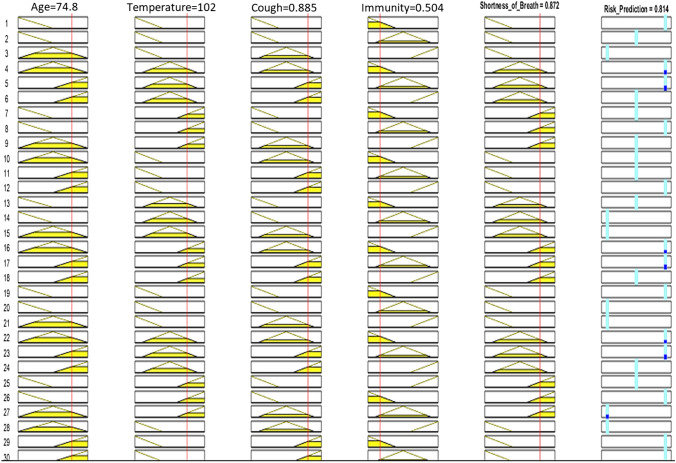
The rules are generated in the Fuzzy Inference. The rule viewer predicts the shape of membership functions that effects the final results. The rule viewer is shown in Fig. 12.
Fig. 12.
Fuzzy rule base of risk predictor
In Tables 11,12 and 13 the membership function (low, medium and high) is shown for IF/THEN rules for input and output parameters.
For training and testing of data, 70% of the data is used for training data while 30% is used for testing [31]. The given training data of the risk prediction is shown in Fig. 13 while the error tolerance for the training of data is 0.0014794.
Fig. 13.
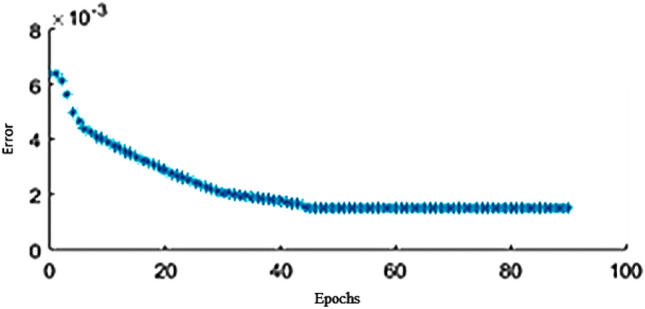
Training data of proposed solution
The 30%–35% of the dataset is a load for testing. The proposed solution’s average testing error is 4.155, shown in Fig. 14. The testing is done by loading the file to test FIS. Figure 15 shows the surface viewer of the output. The training data overlaps with the testing data to check if the possible values are correct. The overlapping data shows the correctness of the following procedure.
Fig. 14.
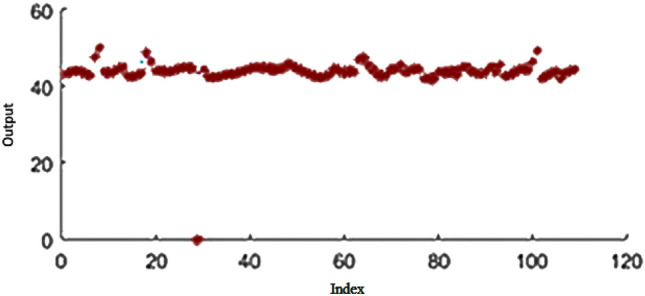
Testing of proposed solution
Fig. 15.
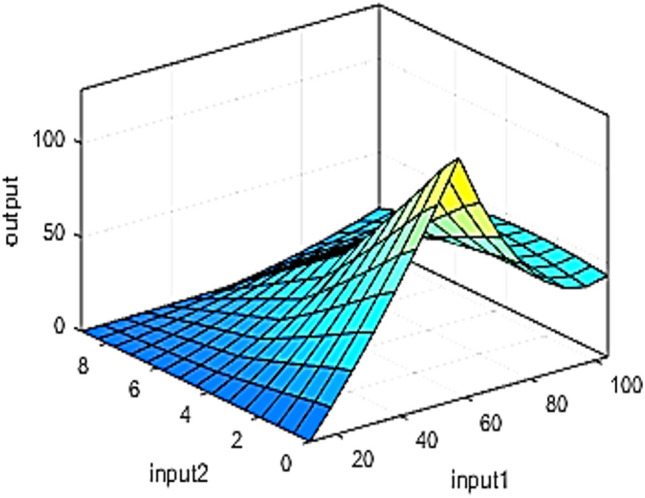
Surface viewer of risk test
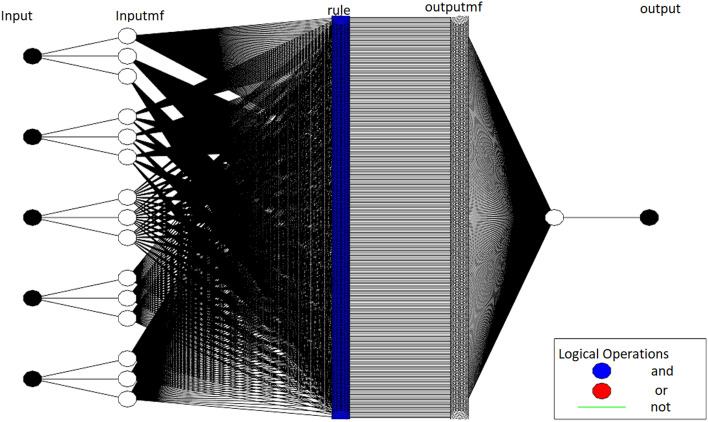
Figure 16 represents the ANFIS structure after training and testing the data.
Fig. 16.
ANFIS structure of risk prediction
Comparative analysis
The comparative analysis of the classification algorithm is shown in Table 14. Table 14 shows the accuracy measure of each classifier. Comparing these measures concludes that SVM achieved the highest accuracy of 100% compared to the DT and KNN for the COVID-19 dataset. SVM achieved the completeness level of this dataset at 100%. Accuracy measure by precision is also 100%. This shows that the SVM 100% accurately classifies the dataset compared to other classifiers. The Table shows each classifier’s best origin’s Performance Measures, i.e., linear SVM, fine KNN, and complex DT. SVM is the best classifier for the COVID-19 dataset that achieved the best accuracy level for classification. The proposed model reaches high prediction and classification accuracy with classification techniques (DT, KNN, SVM).
Table 14.
Comparison of classification algorithms
| Classifier | Accuracy | Precision | Sensitivity | Specificity | F-Measure |
|---|---|---|---|---|---|
| DT | 96.00 | 96.00 | 96.00 | 13.78 | 96.00 |
| KNN | 94.80 | 96.145 | 96.52 | 57.33 | 96.33 |
| SVM | 100.00 | 100.00 | 100.00 | 0.00 | 100.00 |
Conclusion
COVID-19 is a global health threat and virus that can infect a person through respiratory droplets formed from the infected person’s body. This increasing number of death rates can also affect the countries’ economy and set up a pandemic situation. In this paper, different machine learning classification algorithms such as DT, KNN, and SVM are tested on COVID data and comparatively analyzed based on their training data Performance Measures. ANFIS is used to model and control ill-defined and uncertain systems to predict this globally spread disease’s risk factor. COVID-19 dataset is classified using Support Vector Machine (SVM) because it achieved the highest accuracy of 100% among all classifiers. Furthermore, the ANFIS model is implemented on this classified dataset, which results in an 80% risk prediction for COVID-19. In the future, we shall apply the algorithm to the new variant of COVID-19 data seen in other parts of the world.
Footnotes
Publisher's Note
Springer Nature remains neutral with regard to jurisdictional claims in published maps and institutional affiliations.
Contributor Information
Celestine Iwendi, Email: celestine.iwendi@ieee.org.
Kainaat Mahboob, Email: muhammad199785@gmail.com.
Zarnab Khalid, Email: zarnabkhalid19@gmail.com.
Abdul Rehman Javed, Email: abdulrehman.cs@au.edu.pk.
Muhammad Rizwan, Email: Muhammad.rizwan@kinnaird.edu.pk.
Uttam Ghosh, Email: uttam.ghosh@vanderbilt.edu.
References
- 1.Al-Nasheri A, Muhammad G, Alsulaiman M, Ali Z, Malki KH, Mesallam TA, Ibrahim MF. Voice pathology detection and classification using auto-correlation and entropy features in different frequency regions. IEEE Access. 2017;6:6961–6974. doi: 10.1109/ACCESS.2017.2696056. [DOI] [Google Scholar]
- 2.Alam TM, Iqbal MA, Ali Y, Wahab A, Ijaz S, Baig TI, Hussain A, Malik MA, Raza MM, Ibrar S, et al. A model for early prediction of diabetes. Inform. Med. Unlocked. 2019;16:100204. doi: 10.1016/j.imu.2019.100204. [DOI] [Google Scholar]
- 3.Ali F, Khan P, Riaz K, Kwak D, Abuhmed T, Park D, Kwak KS. A fuzzy ontology and svm-based web content classification system. IEEE Access. 2017;5:25781–25797. doi: 10.1109/ACCESS.2017.2768564. [DOI] [Google Scholar]
- 4.Ali, R., Qidwai, U., Ilyas, S.K., Akhtar, N., Alboudi, A., Ahmed, A., Inshasi, J.: Adaptive neuro-fuzzy inference system for prediction of surgery time for ischemic stroke patients. Int. J. Integrated Eng. 11(3) (2019)
- 5.Bhattacharya S, Maddikunta PKR, Pham QV, Gadekallu TR, Chowdhary CL, Alazab M, Piran MJ, et al. Deep learning and medical image processing for coronavirus (covid-19) pandemic: a survey. Sustain. Cities Soc. 2021;65:102589. doi: 10.1016/j.scs.2020.102589. [DOI] [PMC free article] [PubMed] [Google Scholar]
- 6.Boopathi, V., Subramaniyam, S., Malik, A., Lee, G., Manavalan, B.: Yang DC (2019) macppred: a support vector machine-based meta-predictor for identification of anticancer peptides. Int. J. Mol. Sci. 20(8) (1964). 10.3390/ijms20081964 [DOI] [PMC free article] [PubMed]
- 7.Brunello A, Marzano E, Montanari A, Sciavicco G. J48ss: A novel decision tree approach for the handling of sequential and time series data. Computers. 2019;8(1):21. doi: 10.3390/computers8010021. [DOI] [Google Scholar]
- 8.Cai, Z., Gu, J., Wen, C., Zhao, D., Huang, C., Huang, H., Tong, C., Li, J., Chen, H.: An intelligent parkinson’s disease diagnostic system based on a chaotic bacterial foraging optimization enhanced fuzzy knn approach. Comput. Math. Methods Med. 2018, (2018) [DOI] [PMC free article] [PubMed]
- 9.Chang W, Liu Y, Xiao Y, Yuan X, Xu X, Zhang S, Zhou S. A machine-learning-based prediction method for hypertension outcomes based on medical data. Diagnostics. 2019;9(4):178. doi: 10.3390/diagnostics9040178. [DOI] [PMC free article] [PubMed] [Google Scholar]
- 10.Dehghani M, Riahi-Madvar H, Hooshyaripor F, Mosavi A, Shamshirband S, Zavadskas EK, Kw Chau. Prediction of hydropower generation using grey wolf optimization adaptive neuro-fuzzy inference system. Energies. 2019;12(2):289. doi: 10.3390/en12020289. [DOI] [Google Scholar]
- 11.Ding W. Svm-based feature selection for differential space fusion and its application to diabetic fundus image classification. IEEE Access. 2019;7:149493–149502. doi: 10.1109/ACCESS.2019.2944899. [DOI] [Google Scholar]
- 12.Ferrari D, Milic J, Tonelli R, Ghinelli F, Meschiari M, Volpi S, Faltoni M, Franceschi G, Iadisernia V, Yaacoub D, et al. Machine learning in predicting respiratory failure in patients with covid-19 pneumonia–challenges, strengths, and opportunities in a global health emergency. PloS One. 2020;15(11):e0239172. doi: 10.1371/journal.pone.0239172. [DOI] [PMC free article] [PubMed] [Google Scholar]
- 13.Górriz JM, Ramírez J, Suckling J, Illán IA, Ortiz A, Martínez-Murcia FJ, Segovia F, Salas-Gonzalez D, Wang S. Case-based statistical learning: a non-parametric implementation with a conditional-error rate svm. IEEE Access. 2017;5:11468–11478. doi: 10.1109/ACCESS.2017.2714579. [DOI] [Google Scholar]
- 14.Grant, M.C., Geoghegan, L., Arbyn, M., Mohammed, Z., McGuinness, L., Clarke, E.L., Wade, R.: The prevalence of symptoms in 24,410 adults infected by the novel coronavirus (sars-cov-2; covid-19): A systematic review and meta-analysis of 148 studies from 9 countries. Available at SSRN 3582819, (2020) [DOI] [PMC free article] [PubMed]
- 15.Ishak KEHK, Ayoub MA. Predicting the efficiency of the oil removal from surfactant and polymer produced water by using liquid-liquid hydrocyclone: Comparison of prediction abilities between response surface methodology and adaptive neuro-fuzzy inference system. IEEE Access. 2019;7:179605–179619. doi: 10.1109/ACCESS.2019.2955492. [DOI] [Google Scholar]
- 16.Iwendi C, Bashir AK, Peshkar A, Sujatha R, Chatterjee JM, Pasupuleti S, Mishra R, Pillai S, Jo O. Covid-19 patient health prediction using boosted random forest algorithm. Front. Publ. Health. 2020;8:357. doi: 10.3389/fpubh.2020.00357. [DOI] [PMC free article] [PubMed] [Google Scholar]
- 17.Iwendi C, Moqurrab SA, Anjum A, Khan S, Mohan S, Srivastava G. N-sanitization: A semantic privacy-preserving framework for unstructured medical datasets. Comput. Commun. 2020;161:160–171. doi: 10.1016/j.comcom.2020.07.032. [DOI] [Google Scholar]
- 18.Jaafari A, Panahi M, Pham BT, Shahabi H, Bui DT, Rezaie F, Lee S. Meta optimization of an adaptive neuro-fuzzy inference system with grey wolf optimizer and biogeography-based optimization algorithms for spatial prediction of landslide susceptibility. Catena. 2019;175:430–445. doi: 10.1016/j.catena.2018.12.033. [DOI] [Google Scholar]
- 19.Jafarpisheh N, Teshnehlab M. Cancers classification based on deep neural networks and emotional learning approach. IET Syst. Biol. 2018;12(6):258–263. doi: 10.1049/iet-syb.2018.5002. [DOI] [PMC free article] [PubMed] [Google Scholar]
- 20.Javed AR, Sarwar MU, Beg MO, Asim M, Baker T, Tawfik H. A collaborative healthcare framework for shared healthcare plan with ambient intelligence. Human-Centric Comput. Inform. Sci. 2020;10(1):1–21. doi: 10.1186/s13673-019-0205-6. [DOI] [Google Scholar]
- 21.Javed AR, Fahad LG, Farhan AA, Abbas S, Srivastava G, Parizi RM, Khan MS. Automated cognitive health assessment in smart homes using machine learning. Sustain. Cities Soc. 2021;65:102572. doi: 10.1016/j.scs.2020.102572. [DOI] [Google Scholar]
- 22.Javed, AR., Sarwar, MU., ur Rehman, S., Khan, HU., Al-Otaibi, YD., Alnumay, WS.: Pp-spa: Privacy preserved smartphone-based personal assistant to improve routine life functioning of cognitive impaired individuals. Neural Process. Lett. pp 1–18 (2021b)
- 23.Kumar, R., Khan, AA., Zhang, S., Wang, W., Abuidris, Y., Amin, W., Kumar, J.: Blockchain-federated-learning and deep learning models for covid-19 detection using ct imaging. arXiv preprint arXiv:200706537 (2020) [DOI] [PMC free article] [PubMed]
- 24.Lacson RC, Baker B, Suresh H, Andriole K, Szolovits P, Lacson E., Jr Use of machine-learning algorithms to determine features of systolic blood pressure variability that predict poor outcomes in hypertensive patients. Clin. Kidney J. 2019;12(2):206–212. doi: 10.1093/ckj/sfy049. [DOI] [PMC free article] [PubMed] [Google Scholar]
- 25.Lakshmanaprabu S, Shankar K, Khanna A, Gupta D, Rodrigues JJ, Pinheiro PR, De Albuquerque VHC. Effective features to classify big data using social internet of things. IEEE Access. 2018;6:24196–24204. doi: 10.1109/ACCESS.2018.2830651. [DOI] [Google Scholar]
- 26.Latha CBC, Jeeva SC. Improving the accuracy of prediction of heart disease risk based on ensemble classification techniques. Inform. Med. Unlocked. 2019;16:100203. doi: 10.1016/j.imu.2019.100203. [DOI] [Google Scholar]
- 27.Loey M, Manogaran G, Taha MHN, Khalifa NEM. A hybrid deep transfer learning model with machine learning methods for face mask detection in the era of the covid-19 pandemic. Measurement. 2020;167:108288. doi: 10.1016/j.measurement.2020.108288. [DOI] [PMC free article] [PubMed] [Google Scholar]
- 28.Luo X, Lv Y, Li R, Chen Y. Web service qos prediction based on adaptive dynamic programming using fuzzy neural networks for cloud services. IEEE Access. 2015;3:2260–2269. doi: 10.1109/ACCESS.2015.2498191. [DOI] [Google Scholar]
- 29.MK, M., Srivastava, G., Somayaji, SRK., Gadekallu, TR., Maddikunta, PKR., Bhattacharya, S.: An incentive based approach for covid-19 using blockchain technology. arXiv preprint arXiv:201101468 (2020)
- 30.Nilashi M, Ahmadi H, Shahmoradi L, Ibrahim O, Akbari E. A predictive method for hepatitis disease diagnosis using ensembles of neuro-fuzzy technique. J. Infect. Publ. Health. 2019;12(1):13–20. doi: 10.1016/j.jiph.2018.09.009. [DOI] [PubMed] [Google Scholar]
- 31.Pandit A, Biswal KC. Prediction of earthquake magnitude using adaptive neuro fuzzy inference system. Earth Sci. Inform. 2019;12(4):513–524. doi: 10.1007/s12145-019-00397-w. [DOI] [Google Scholar]
- 32.Pourdaryaei A, Mokhlis H, Illias HA, Kaboli SHA, Ahmad S. Short-term electricity price forecasting via hybrid backtracking search algorithm and anfis approach. IEEE Access. 2019;7:77674–77691. doi: 10.1109/ACCESS.2019.2922420. [DOI] [Google Scholar]
- 33.Prado F, Minutolo MC, Kristjanpoller W. Forecasting based on an ensemble autoregressive moving average-adaptive neuro-fuzzy inference system-neural network-genetic algorithm framework. Energy. 2020;197:117159. doi: 10.1016/j.energy.2020.117159. [DOI] [Google Scholar]
- 34.Prasad D, Bhargavram K, Guptha K. Challenging security issues of mobile cloud computing. IJRDO-J. Comput. Sci. Eng. (ISSN: 2456-1843) 2015;1(7):33–44. [Google Scholar]
- 35.Rajabi, M., Sadeghizadeh, H., Mola-Amini, Z., Ahmadyrad, N.: Hybrid adaptive neuro-fuzzy inference system for diagnosing the liver disorders. arXiv preprint arXiv:191012952 (2019)
- 36.Read, JM., Bridgen, JR., Cummings, DA., Ho, A., Jewell, CP.: Novel coronavirus 2019-ncov: early estimation of epidemiological parameters and epidemic predictions. MedRxiv (2020) [DOI] [PMC free article] [PubMed]
- 37.Reddy GT, Khare N. Hybrid firefly-bat optimized fuzzy artificial neural network based classifier for diabetes diagnosis. Int. J. Intell. Eng. Syst. 2017;10(4):18–27. [Google Scholar]
- 38.Rehman, SU., Javed, AR., Khan, MU., Nazar Awan, M., Farukh, A., Hussien, A.: Personalisedcomfort: a personalised thermal comfort model to predict thermal sensation votes for smart building residents. Enterprise Inform. Syst. pp 1–23 (2020)
- 39.Sabrol, H., Kumar, S.: Plant leaf disease detection using adaptive neuro-fuzzy classification. In: science and information conference, Springer, pp 434–443 (2019)
- 40.Samuel J, Ali G, Rahman M, Esawi E, Samuel Y, et al. Covid-19 public sentiment insights and machine learning for tweets classification. Information. 2020;11(6):314. doi: 10.3390/info11060314. [DOI] [Google Scholar]
- 41.Sarwar, MU., Javed, AR.: Collaborative health care plan through crowdsource data using ambient application. In: 2019 22nd International Multitopic Conference (INMIC), IEEE, pp 1–6 (2019)
- 42.Saucedo JAM, Hemanth JD, Kose U. Prediction of electroencephalogram time series with electro-search optimization algorithm trained adaptive neuro-fuzzy inference system. IEEE Access. 2019;7:15832–15844. doi: 10.1109/ACCESS.2019.2894857. [DOI] [Google Scholar]
- 43.Shabbir M, Shabbir A, Iwendi C, Javed AR, Rizwan M, Herencsar N, Lin JCW. Enhancing security of health information using modular encryption standard in mobile cloud computing. IEEE Access. 2021;9:8820–8834. doi: 10.1109/ACCESS.2021.3049564. [DOI] [Google Scholar]
- 44.Singh, A.P., Pradhan, N.R., Agnihotri, S., Jhanjhi, N., Verma, S., Ghosh, U., Roy, D., et al.: A novel patient-centric architectural framework for blockchain-enabled healthcare applications. IEEE Trans. Ind. Inform.(2020a)
- 45.Singh, PK., Nandi, S., Ghafoor, K., Ghosh, U., Rawat, DB.: Preventing covid-19 spread using information and communication technology. IEEE Consumer Electronics Magazine (2020b)
- 46.Sisodia D, Sisodia DS. Prediction of diabetes using classification algorithms. Proc. Comput. Sci. 2018;132:1578–1585. doi: 10.1016/j.procs.2018.05.122. [DOI] [Google Scholar]
- 47.Sneha N, Gangil T. Analysis of diabetes mellitus for early prediction using optimal features selection. J. Big data. 2019;6(1):13. doi: 10.1186/s40537-019-0175-6. [DOI] [Google Scholar]
- 48.Supatmi, S., Hou, R., Sumitra, I.D.: Study of hybrid neurofuzzy inference system for forecasting flood event vulnerability in indonesia. Comput Intell. Neurosci. 2019, (2019) [DOI] [PMC free article] [PubMed]
- 49.Usman Sarwar, M., Rehman Javed, A., Kulsoom, F., Khan, S., Tariq, U., Kashif Bashir, A.: Parciv: Recognizing physical activities having complex interclass variations using semantic data of smartphone. Software: Practice and Experience (2020)
- 50.Venkatesan C, Karthigaikumar P, Paul A, Satheeskumaran S, Kumar R. Ecg signal preprocessing and svm classifier-based abnormality detection in remote healthcare applications. IEEE Access. 2018;6:9767–9773. doi: 10.1109/ACCESS.2018.2794346. [DOI] [Google Scholar]
- 51.Vlamou E, Papadopoulos B. Fuzzy logic systems and medical applications. AIMS Neurosci. 2019;6(4):266. doi: 10.3934/Neuroscience.2019.4.266. [DOI] [PMC free article] [PubMed] [Google Scholar]
- 52.Vyas, S., Ranjan, R., Singh, N., Mathur, A.: Review of predictive analysis techniques for analysis diabetes risk. In: 2019 Amity International Conference on Artificial Intelligence (AICAI), IEEE, pp 626–631 (2019)
- 53.Xu B, Li S, Razzaqi AA, Zhang J. Cooperative localization in harsh underwater environment based on the mc-anfis. IEEE Access. 2019;7:55407–55421. doi: 10.1109/ACCESS.2019.2913039. [DOI] [Google Scholar]
- 54.Yu, K., Tan, L., Shang, X., Huang, J., Srivastava, G., Chatterjee, P.: Efficient and privacy-preserving medical research support platform against covid-19: A blockchain-based approach. IEEE Consumer Electronics Magazine (2020)
- 55.Yuan J, Douzal-Chouakria A, Yazdi SV, Wang Z. A large margin time series nearest neighbour classification under locally weighted time warps. Knowl. Inform. Syst. 2019;59(1):117–135. doi: 10.1007/s10115-018-1184-z. [DOI] [Google Scholar]
- 56.Zhang, D.: Wavelet transform. in fundamentals of image data mining (2019)
- 57.Zhang YD, Yang ZJ, Lu HM, Zhou XX, Phillips P, Liu QM, Wang SH. Facial emotion recognition based on biorthogonal wavelet entropy, fuzzy support vector machine, and stratified cross validation. IEEE Access. 2016;4:8375–8385. doi: 10.1109/ACCESS.2016.2628407. [DOI] [Google Scholar]
- 58.Zou P, Huo D, Li M. The impact of the covid-19 pandemic on firms: a survey in guangdong province, china. Global Health Res Policy. 2020;5(1):1–10. doi: 10.1186/s41256-020-00166-z. [DOI] [PMC free article] [PubMed] [Google Scholar]
- 59.Erkut İnan İşeri KU, İlhan U. Forecasting measles in the european union using the adaptive neuro-fuzzy inference system. Cyprus J Med Sci. 2019;4(1):34–37. doi: 10.5152/cjms.2019.611. [DOI] [Google Scholar]


