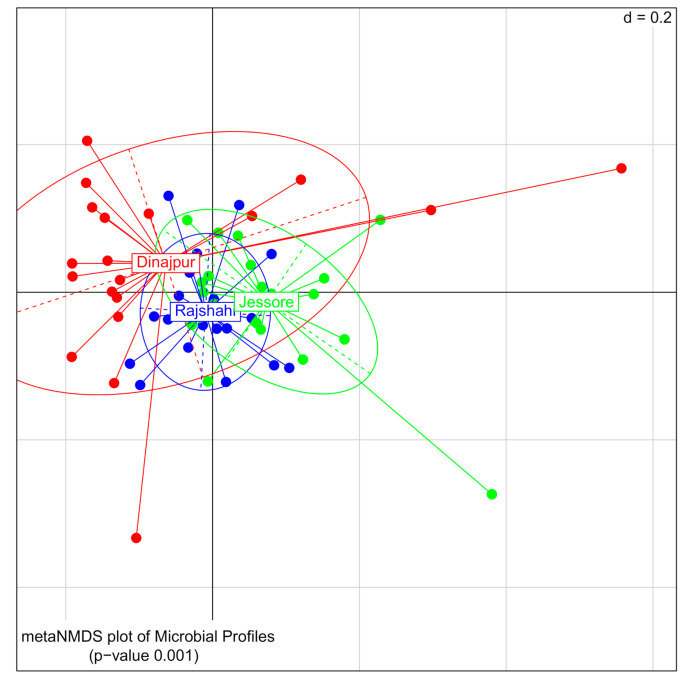
Figure 1.
Nonmetric multidimensional scaling (NMDS) plot of bacterial communities for Z. cucurbitae samples collected from Dinajpur (red), Jessore (green) and Rajshahi (blue) (p < 0.001). The ‘d’ indicates dissimilarity scale of the grid (d = 0.2 mean that the distance between two grid lines represents approximately 20% dissimilarity between the samples).

