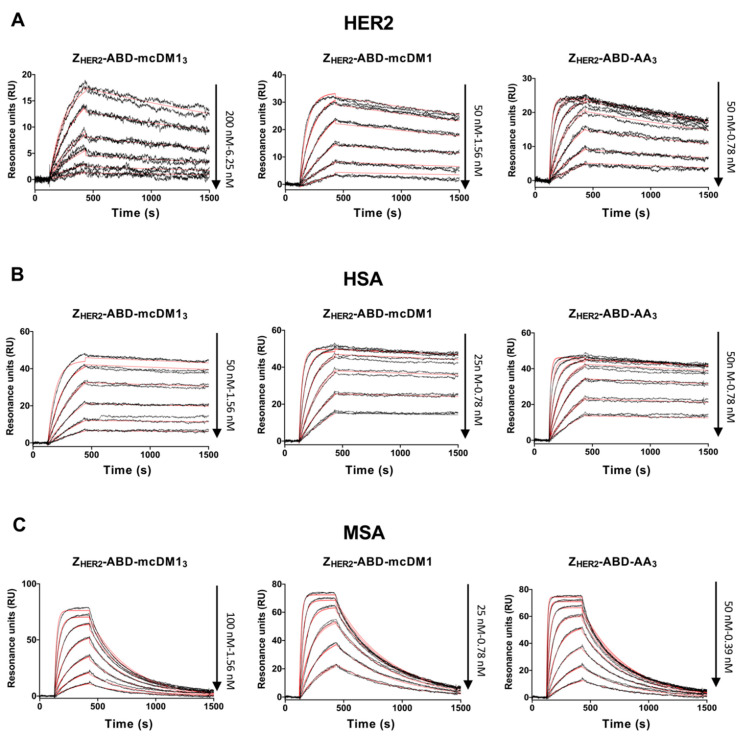
Figure 3.
Biosensor analysis. Two-fold serial dilutions of the conjugates indicated over each panel were sequentially injected over flow-cells with immobilized recombinant HER2 (A), human serum albumin (HSA) (B), and mouse serum albumin (MSA) (C). Each concentration was injected twice, and each panel is an overlay of all recorded sensorgrams for each conjugate. The recorded sensorgrams are displayed in black, and the biosensor’s best fitting of the data is shown in red. The concentrations of the injected dilution series are indicated to the right of each panel.

