

Abstract
Objective
To evaluate the impact of multiparametric magnetic resonance imaging (mpMRI) before confirmatory prostate biopsy in patients under active surveillance (AS).
Materials and Methods
This retrospective study included 170 patients with Gleason grade 6 prostate cancer initially enrolled in an AS program between 2011 and 2019. Prostate mpMRI was performed using a 1.5 tesla (T) magnetic resonance imaging system with a 16-channel phased-array body coil. The protocol included T1-weighted, T2-weighted, diffusion-weighted, and dynamic contrast-enhanced imaging sequences. Uroradiology reports generated by a specialist were based on prostate imaging-reporting and data system (PI-RADS) version 2. Univariate and multivariate analyses were performed based on regression models.
Results
The reclassification rate at confirmatory biopsy was higher in patients with suspicious lesions on mpMRI (PI-RADS score ≥ 3) (n = 47) than in patients with non-suspicious mpMRIs (n = 61) and who did not undergo mpMRIs (n = 62) (66%, 26.2%, and 24.2%, respectively; p < 0.001). On multivariate analysis, presence of a suspicious mpMRI finding (PI-RADS score ≥ 3) was associated (adjusted odds ratio: 4.72) with the risk of reclassification at confirmatory biopsy after adjusting for the main variables (age, prostate-specific antigen density, number of positive cores, number of previous biopsies, and clinical stage). Presence of a suspicious mpMRI finding (adjusted hazard ratio: 2.62) was also associated with the risk of progression to active treatment during the follow-up.
Conclusion
Inclusion of mpMRI before the confirmatory biopsy is useful to stratify the risk of reclassification during the biopsy as well as to evaluate the risk of progression to active treatment during follow-up.
Keywords: Active surveillance, Prostate cancer, Multiparametric prostate magnetic resonance imaging, Confirmatory biopsy reclassification, Progression risk, Active treatment
INTRODUCTION
Prostate cancer (PCa) is the most common non-cutaneous cancer among men in developed regions, with an estimated incidence of 759000 cases and 142000 deaths each year (1).
Prostate-specific antigen (PSA) is the standard serum marker for the diagnosis of PCa (2,3). Although mass screening programs are still considered controversial, a reduction in PCa-specific mortality was reported in a European series (4). Early detection programs are recommended by the European Urological Association (EAU) for men with good performance status, good life expectancy, and well-informed risk-benefit balance (5).
Owing to the natural history of low-risk PCa (6) and an estimated progression rate of less than 6% without treatment after a decade of follow-up (7), there is some concern regarding overdiagnosis and overtreatment in low-risk PCa patients (8).
Active surveillance (AS) programs try to avoid overtreatment in patients with low-grade and low-volume PCa without sacrificing the correct timing for curative treatment (5). A recent comparative study has shown an increase in the metastasis rate and in cancer-specific mortality (9). However, the study protocol during the follow-up of an AS patient was considerably different from the current protocols, which could invalidate the conclusion (9). To improve the safety of AS programs, some tools (10) and risk calculators (11,12) have been explored with mixed results. Further studies and recalibrations are still warranted to increase the widespread use of such programs.
Magnetic resonance imaging (MRI) has evolved as a useful tool to improve the stratification and characterization of PCa candidates for AS (13,14). However, the nature of the MRI protocol and the schedule during the follow-up are still unclear.
Results from different studies have proposed MRI as a predictive marker of disease progression because of a higher proportion of reclassification in patients with suspicious MRI findings (13).
However, the Active Surveillance Magnetic Resonance Imaging Study (ASIST), which was a randomized trial, did not show any differences in the proportion of significant PCa (Gleason grade [GG] ≥ 2) between the addition of MRI before the reclassification biopsy and the standard biopsy approach (15). Nevertheless, during the first two-year follow-up, the rate of progression to significant PCa was lower in the group that underwent MRI examination before the confirmatory biopsy (16).
Considering this background, we aimed to demonstrate the impact of introducing MRI before the confirmatory prostate biopsy in two consecutive cohorts (with and without MRI before the confirmatory biopsy) and to analyze the predictive value of the MRI results.
MATERIALS AND METHODS
Study Design and Population
The present retrospective study was approved by the local ethics committee (N.269 Ref 3644). All patients signed a specific consent for AS and data registry.
Altogether, 170 male patients from a single tertiary-care academic institution who enrolled in an AS program between 2011 and 2019 were included in this study. The median age at diagnosis was 65 years.
MRI was introduced into the AS protocol before the confirmatory biopsy and was recommended for the follow-up biopsies from 2015 onward. The AS cohort was stratified based on the inclusion of MRI before the confirmatory biopsy.
Follow-up protocol required a confirmatory biopsy at 6–12 months and follow-up surveillance biopsies at 18 months, 42 months, and every 3 years thereafter.
The AS protocol inclusion criteria were: PSA level < 10 ng/mL or density of PSA (DPSA) ≤ 0.15 if PSA was 10–20 ng/mL, absence of GG ≥ 4 on the initial biopsy, clinical stage T1–T2a, and two or fewer positive biopsy cores with less than 50% of a core affected on any biopsy.
GG ≥ 2 or an increase in the PCa volume (≥ three affected cores or a percentage of the maximum affected core) was categorized as reclassification/progression. If a target biopsy was positive, it was categorized as a single affected core.
MRI Protocol and Characteristics
Prostate MRI for the confirmatory/reclassification biopsy was performed at 3–6 months after the initial diagnostic biopsy. After the reclassification biopsy, MRI was recommended before any follow-up biopsies.
Prostate MRI examinations were performed using a 1.5 tesla (T) magnetic resonance (MR) system (Magnetom Aera, Siemens Healthineers) using a 16-channel, phased-array body coil. MRI examinations were performed at least 8 weeks after a prior prostate biopsy. The MRI protocol included T1-weighted images (T1WI), T2-weighted images (T2WI), diffusion-weighted images (DWI), and dynamic contrast-enhanced images (DCE).
T1WI sequences were acquired in the axial plane (repetition time [TR], 505 ms; echo time [TE], 10 ms; field of view [FOV], 32.0 cm to include the entire pelvis for the detection of enlarged pelvic lymph nodes, bone metastases, and postbiopsy hemorrhage; slice thickness, 3 mm; and image matrix, 192 × 256).
T2WI sequences were acquired in the axial plane (TR, 4350 ms; TE, 99 ms; FOV, 20.0 cm; image matrix, 310 × 320; and slice thickness, 3 mm) and in the coronal plane (TR, 4000 ms; TE, 99 ms; FOV, 20.0 cm; image matrix, 310 × 320; and slice thickness, 3 mm).
T2-weighted three-dimensional sequences were acquired in the sagittal plane (TR, 1600 ms; TE, 94 ms; FOV, 16.0 cm; image matrix, 248 × 256; and slice thickness, 1 mm).
We obtained DWI with three b-values: 50, 400, and 800 s/mm2. Moreover, an image with a b-value (calculated) of 1400 s/mm2 was also acquired (TR, 3800 ms; TE, 73 ms; FOV, 26.0 cm; slice thickness, 3.5 mm; and image matrix, 114 × 114). Apparent diffusion coefficient maps were calculated using the standard mono-exponential model.
DCE required intravenous injection of gadolinium-based contrast agent gadobutrol (Gadovist®, Bayer AG) in a dose of 0.1 mmoL/kg body weight (equivalent to 0.1 mL Gadovist per kg body weight). The rate of infusion was 3 mL/s. Dynamic T1WI were acquired over the entire gland (TR, 4.80 ms; TE, 2.17 ms; FOV, 22.0 cm; image matrix, 179 × 256; and slice thickness, 2 mm). Perfusion curves were generated with a software for prostate MR reading (Syngo.via, MR prostate, Siemens Healthineers) at the workstation. The duration of the whole MRI examination was 31 minutes per patient.
Lesions were described and localized according to the division of the prostate into sectors in PI-RADS version 2 (17). In the peripheral zone, lesions were measured based on the apparent diffusion coefficient. However, in the transition zone, lesions were measured on T2WI. Finally, a PI-RADS assessment category was described for prostate findings. A team of five expert radiologists analyzed the MRI results.
Prostate Biopsy Technique
An initial 12-core, transrectal systematic biopsy was performed. A systematic saturation biopsy was also obtained for the confirmatory or the follow-up biopsy. The fusion biopsy was performed using an ultrasound system (LOGIQ E9; XDCLEAR) equipped with an end-fire endorectal biopsy probe (IC5-9 D) and an operating bandwidth of 5–9 MHz. At the time of the biopsy, MRI images were fused with the ultrasound images using a sensor-based approach to guide the urologist toward the specific target (18).
Statistical Analysis
Descriptive analyses were performed to describe the clinical parameters (age, body mass index, PSA, prostate volume, DPSA, number of biopsies before the diagnostic biopsy, number of cores on the diagnostic biopsy, number of positive cores on the diagnostic biopsy, total PCa length at the initial biopsy, clinical stage, interval between the diagnostic and the confirmatory biopsies, and reclassification rate). Quantitative variables were presented as median values and interquartile ranges. Qualitative variables were presented as absolute numbers and percentages.
Non-parametric univariate analysis was performed (Kruskal-Wallis test, chi-squared test, linear trend analysis, log-rank test). Univariate and multivariate logistic regression and Cox regression models were also utilized. A Kaplan-Meier survival curve was developed to describe the probability of progression-free survival during the follow-up.
The analyses were performed using SPSS version 17.0 (SPSS Inc.). A 5% significance level (p < 0.05) was used to denote statistically significant differences.
RESULTS
Altogether, 170 patients were evaluated. Among these, 108 patients were included in the MRI protocol and 62 patients were included in the cohort without MRI before the confirmatory biopsy. The median age at diagnosis was 65 years, the median PSA level was 5.30 ng/mL, and the median DPSA was 0.12 ng/mL/cc. The majority of the patients were prostate biopsy-naive at diagnosis (n = 130, 76.5%).
Clinically, 146 (85.9%) patients were diagnosed with stage T1c tumors. Clinical characteristics of the cohort are shown in Table 1. Only one patient died during the follow-up due to a non-cancer-specific cause.
Table 1. Clinical Characteristics of the Cohort.
| Characteristics | All (n = 170)* |
|---|---|
| Age at diagnosis (yr) | 65 (58–69) |
| BMI (kg/m2)† | 27.61 (25.45–30.20) |
| PSA (ng/mL) | 5.30 (4.08–7.09) |
| Prostate volume (cc) | 44 (32.75–62.75) |
| PSA density (ng/mL/cc) | 0.12 (0.08–0.16) |
| Number of biopsies before diagnostic biopsy | |
| 0 | 130 (76.5) |
| 1 | 32 (18.8) |
| 2 | 8 (4.7) |
| Number of cores taken on diagnostic biopsy | 12 (12–13) |
| Number of cores positive for cancer on diagnostic biopsy | 1 (1–2) |
| Total PCa length on initial biopsy (mm) | 1 (1–2) |
| Clinical stage (cT) | |
| T1a | 2 (1.1) |
| T1c | 146 (85.8) |
| T2a | 22 (12.9) |
| Interval between diagnosis and confirmatory biopsy (mo) | 6 (5–8) |
| Reclassification on confirmatory biopsy | 62 (36.5) |
| Progression on follow-up | 91 (53.5) |
| Follow-up (mo) | 34.5 (16–53.2) |
*Values are expressed as median and interquartile range for quantitative variables and as absolute number and percentage for qualitative variables, †n = 76 patients. BMI = body mass index, cT = clinical tumor extension, mo = months, PCa = prostate cancer, PSA = prostate-specific antigen, yr = years
Clinical characteristics stratified according to the cohort group (with or without MRI before the confirmatory biopsy) are shown in Table 2.
Table 2. Comparison between the Clinical Characteristics of the Cohorts according to MRI Findings before Confirmatory Biopsy.
| No MRI (n = 62)* | Total MRI (n = 108)* | P | Suspicious MRI (n = 47)* | Non-Suspicious MRI (n = 61)* | P | |
|---|---|---|---|---|---|---|
| Age at diagnosis (yr) | 65 (58–70) | 65 (59–69) | 0.678 | 67 (62–71) | 63 (57–67) | 0.005 |
| BMI (kg/m2)† | 27.17 (25.20–29.47) | 27.68 (25.46–30.48) | 0.501 | 27.71 (25.98–30.62) | 27.51 (25.38–30.48) | 0.880 |
| PSA (ng/mL) | 5.77 (4.13–7.13) | 4.96 (3.89–6.70) | 0.165 | 5.79 (4.48–7.57) | 4.62 (3.60–5.95) | 0.005 |
| Prostate volume (cc) | 41 (31–51) | 49 (33–68) | 0.096 | 50 (37–62) | 49 (30–70) | 0.731 |
| PSA density (ng/mL/cc) | 0.14 (0.10–0.19) | 0.10 (0.08–0.16) | 0.007 | 0.11 (0.09–0.15) | 0.10 (0.07–0.16) | 0.150 |
| Number of biopsies before diagnostic biopsy | 0.070 | 0.705 | ||||
| 0 | 43 (69.3) | 87 (80.6) | 37 (78.7) | 50 (72.1) | ||
| 1 | 14 (22.6) | 18 (16.7) | 9 (19.1) | 9 (14.8) | ||
| 2 | 5 (8.1) | 3 (2.8) | 2 (2.1) | 2 (3.3) | ||
| Number of cares taken on diagnostic biopsy | 12 (12–16) | 12 (12–12) | 0.120 | 12 (12–12) | 12 (12–12.5) | 0.667 |
| Number of cares positive for PCa on diagnostic biopsy | 1 (1–1) | 1 (1–1)* | 0.016 | 1 (1–2) | 1 (1–2) | 0.950 |
| Total PCa length on initial biopsy (mm) | 1 (1–2) | 1 (1–3)* | 0.006 | 2 (1–3) | 1 (1–2) | 0.430 |
| Clinical stage (cT) | 0.164 | 0.298 | ||||
| T1a | 1 (1.6) | 1 (0.9) | 1 (1.6) | |||
| T1c | 56 (90.3) | 90 (83.3) | 42 (89.4) | 48 (78.7) | ||
| T2a | 5 (8.1) | 17 (15.8) | 5 (10.6) | 12 (19.7) | ||
| Interval between diagnosis and confirmatory biopsy (mo) | 6 (4–7) | 6 (5–6) | 0.009 | 6 (5–9) | 6 (5–6) | 0.718 |
| Reclassification on confirmatory biopsy | 15 (24.1) | 47 (44.4) | 0.012 | 31 (66) | 16 (26.2) | < 0.001 |
| Progression on follow-up | 33 (53.2) | 58 (53.7) | 0.952 | 38 (80.9) | 20 (30.2) | < 0.001 |
*Values are expressed in median and interquartile range for quantitative variables and in absolute number and percentage for qualitative variables, †n = 76 patients (no MRI, n = 17; suspicius MRI, n = 21; non-suspicious MRI, n = 38).
Clinical differences were observed in DPSA (0.10 ng/mL/cc vs. 0.14 ng/mL/cc) and in the rate of reclassification at the confirmatory biopsy (44.4% vs. 24.2%) between the MRI group and the no MRI group. We also observed clinically marginal, but statistically significant differences in the total length of PCa, number of cores, and time to confirmatory biopsy (Table 2).
Among patients in the MRI cohort, 47 patients had suspicious lesions (PI-RADS score ≥ 3) on MRI. These patients also had higher PSA levels than patients with nonsuspicious MRIs (Table 2).
The percentage of reclassification at the confirmatory biopsy was higher in patients with suspicious MRIs (PI-RADS score ≥ 3) than in those of the other two cohorts (patients with non-suspicious MRIs [PI-RADS score ≤ 2] and patients with no MRIs) (p < 0.001) (Fig. 1).
Fig. 1. Distribution of the reclassification pattern at confirmatory biopsy among the cohorts.

mpMRI = multiparametric magnetic resonance imaging, PI-RADS = prostate imaging-reporting and data system
In the univariate logistic regression model used to determine the reclassification risk at the confirmatory biopsy, clinical stage (odds ratio [OR]: 1.07), DPSA (OR: 2.20), number of biopsies before the diagnostic biopsy (OR: 0.36), inclusion of MRI before the reclassification biopsy (OR: 2.41), suspicious findings on MRI (OR: 5.44), number of positive cores on the initial biopsy (OR: 2.54), and total PCa length in the initial biopsy (OR: 1.28) were associated with a higher risk of reclassification and treatment initiation (Table 3).
Table 3. Univariant and Multivariant Analysis for the Association between Baseline Characteristics and Any Grade of Reclassification on Confirmatory Biopsy.
| Univariant Analysis of PCa Reclassification on Confirmatory Biopsy | ||
|---|---|---|
| Characteristics | Unadjusted HR (95% CI) | P |
| Age (yr) | 1.07 (1.02–1.12) | 0.005 |
| BMI (kg/m2)* | 1.05 (0.92–1.21) | 0.419 |
| PSA (ng/mL) | 1.09 (0.97–1.23) | 0.111 |
| DPSA ln (per ng/mL/cc) | 2.20 (1.15–4.24) | 0.017 |
| Clinical stage | 1.06 (0.49–2.30) | 0.865 |
| Number of biopsies before diagnostic biopsy (per n° biopsy) | 0.36 (0.17–0.78) | 0.009 |
| MRI before reclassification biopsy (yes/no) | 2.41 (1.20–4.83) | 0.013 |
| Suspicious MRI (yes/no) | 5.44 (2.37–12.50) | < 0.001 |
| Time to confirmatory biopsy (mo) | 0.98 (0.88–1.09) | 0.982 |
| Number of positive cores on initial biopsy (per n° of positive core) | 2.54 (1.46–4.41) | 0.001 |
| Total PCa length on initial biopsy (mm) | 1.28 (1.06–1.55) | 0.010 |
*n = 76 patients. CI = confidence interval, DPSA ln = Napieirian logarithm of PSA density, OR = odds ratio
In the multivariate logistic regression model, DPSA value (OR: 2.75) and the presence of suspicious findings on MRI (PI-RADS score ≥ 3) (OR: 4.72) remained associated with the risk of reclassification at the confirmatory biopsy in the cohort that underwent MRI examinations (Table 3).
When the univariate logistic regression analysis was employed to calculate the progression risk and the risk of change to active treatment during the follow-up analysis, age (hazard ratio [HR]: 1.05), number of biopsies before the diagnostic biopsy (HR: 0.64), number of positive cores on the diagnostic biopsy (HR: 1.69), use of MRI before the confirmatory biopsy (HR: 2.27), and presence of suspicious findings on MRI (PI-RADS score ≥ 3) (HR: 3.27) were associated with the risk of change to active treatment (Table 4).
Table 4. Univariant and Multivariant Analysis for the Association between Baseline Characteristics and Progression during Follow-Up.
| Univariant Analysis of PCa Progression during Follow-Up | ||
|---|---|---|
| Characteristics | Unadjusted HR (95% CI) | P |
| Age (yr) | 1.05 (1.02–1.08) | 0.001 |
| BMI (kg/m2)* | 1.04 (0.94–1.16) | 0.391 |
| PSA (ng/mL) | 1.06 (0.98–1.14) | 0.098 |
| PSA density (per ng/mL/cc) | 3.77 (0.19–75.05) | 0.384 |
| DPSA ln (per ng/mL/cc) | 1.26 (0.81–1.97) | 0.302 |
| Clinical stage | 1.15 (0.65–2.02) | 0.623 |
| Number of biopsies before diagnostic biopsy (per n° biopsy) | 0.64 (0.42–0.96) | 0.034 |
| Suspicious MRI (yes/no) | 3.27 (1.89–5.64) | < 0.001 |
| Time to confirmatory biopsy (mo) | 0.97 (0.90–1.04) | 0.450 |
| Number of positive cores on initial biopsy (per n° of positive core) | 1.69 (1.24–2.29) | 0.001 |
| Total PCa length on initial biopsy (mm) | 1.09 (0.99–1.20) | 0.064 |
*n = 76 patients.
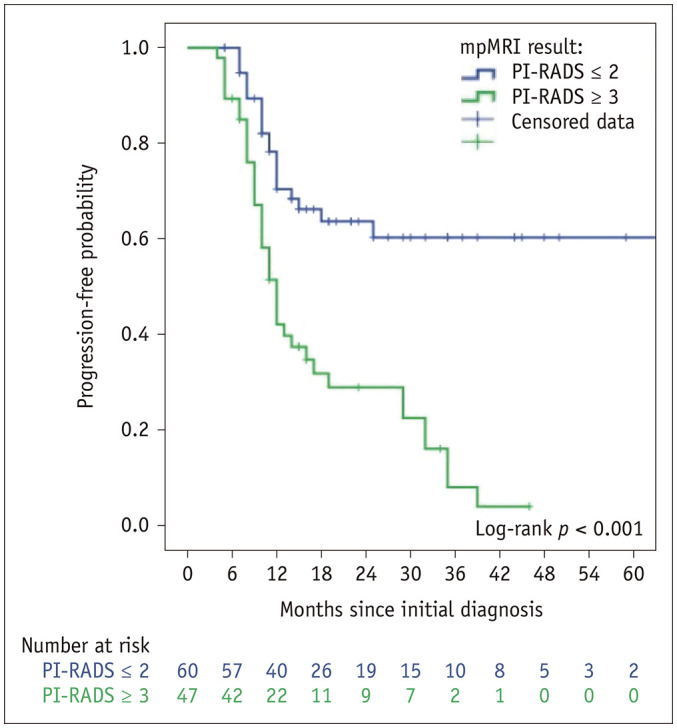
Figure 2 shows the Kaplan-Meier curve for the risk of progression, with stratification according to the MRI results before the confirmatory biopsy.
Fig. 2. Probability of progression-free survival according to the results of MRI performed before the confirmatory biopsy.
After adjusting for the main variables in the multivariate analysis, age (HR: 1.05) and the presence of suspicious findings on MRI (PI-RADS score ≥ 3) (HR: 2.62) remained associated with the risk of progression to active treatment (Table 4).
DISCUSSION
AS program is an accepted alternative management strategy worldwide for low-risk PCa (5,19). However, the follow-up schedule has not been well established and there is a considerable heterogeneity between groups. The inclusion of MRI is now being considered (20,21) and it is strongly recommended by the EAU (5), before the confirmatory biopsy, despite the initial results of the ASIST trial (15). The role of MRI in the follow-up of lesions on the initial MRI and the schedule for the examination during the follow-up have been poorly studied (22). In the present study, we evaluated the impact of MRI before the confirmatory biopsy on the rate of reclassification and progression during the follow-up.
MRI is known to have a very high negative predictive value for significant PCa (23). However, in contrast to the initial results of the ASIST trial (16), several studies have demonstrated the importance of combining standard biopsy with target biopsy for the detection of significant PCa to avoid missing up to 17% of these tumors (24,25,26). Our protocol followed this evidence and combined the target biopsy with an 18-core standard biopsy.
The rate of progression to active treatment in our study was higher than that reported in other studies due to the highly restrictive criteria. Specifically, the number of affected cores without considering the total number obtained in the standard approach was higher than that reported in most of the cohorts (19). In addition, our definition of significant PCa (GG ≥ 2) was different from the definition (GG > 2) in previous studies (25).
Based on the evidence, our criteria have been extended in terms of the volume of GG 1 and the low volume of GG 2 in older patients (27). However, this change did not affect the results of the present study.
The percentage of patients with suspicious lesions on MRI was lower than that reported in other studies (43.5% vs. 59–64%) (28). This difference could be due to the use of a 1.5T MR system, although there has been no evidence of a difference in the negative predictive value (75% vs. 78%) between a 1.5T MR system and a 3T MR system. Nevertheless, a 3T system was associated with better accuracy (74% vs. 83%) (29).
The impact of introducing MRI is evident in our cohort, with a strong influence on the rate of reclassification at the confirmatory biopsy (adjusted OR: 2.59, reclassification rate of 66% in the suspicious MRI group versus 23.3% in the non-suspicious MRI group). These results are consistent with the results previously reported in the literature, with a significant upgrading in the GG when a target biopsy was added to the standard biopsy (30,31,32).
Introduction of early MRI before the reclassification biopsy and prudential waiting for possible confounding changes for 3–6 months after the initial biopsy are clearly necessary to categorize the risk and also to guide the timing of the reclassification biopsy. This course of action is important not only because of the ability of MRI to accurately predict reclassification, but also because of the association between the PI-RADS score and a higher GG (Spearman correlation test: r = 0.36, p < 0.001). Furthermore, baseline MRI should also be useful for the follow-up MRIs advocated by the recent Prostate Cancer Radiological Estimation of Change in Sequential Evaluation (PRECISE) recommendations (33).
Patients with suspicious lesions on MRI showed a faster PCa progression to active treatment in the follow-up than patients without suspicious lesions on MRI (unadjusted HR: 3.27). This result remained significant (HR: 2.62) after adjusting for the main variables usually considered in the nomograms (age, number of previous negative biopsies, number of positives cores, DPSA, clinical stage) (34).
This associated risk can be explained not only by a higher rate of initial reclassification, but also by reclassification based on subsequent follow-up biopsies (Fig. 2). This fact could be attributed to initial incorrect targeting of the lesion or to the evolution or changes in the suspicious lesions during the follow-up. The first hypothesis is based on the need for a learning curve in target biopsies. The accuracy of target biopsy improves with time, as described previously with other platforms (35).
Nevertheless, the data presented in this study demonstrate the high value of MRI in stratifying patient risk before introducing an AS protocol. MRI is also useful in predicting the time from progression to active treatment. This capacity has allowed various groups to propose nomograms to select not only GG 1 patients, but also GG 2 patients for AS (12).
Our results should be analyzed in the context of a tertiary referral center with a dedicated and experienced prostate imaging team with respect to MRI reading and guidance of subsequent biopsies. However, all results reported in the present study should be interpreted with caution because of some limitations. The present study was a retrospective study that included patients from clinical practice. Rigorous adherence to the protocol was not evaluated. It is known that adherence to repeat biopsy decreases with time (36). The use of 1.5T MRI rather than 3T MRI may have decreased the MRI accuracy for significant PCa. However, there are no clear indications regarding the use of a specific magnet during AS. The PI-RADS guidelines have suggested that both 1.5T and 3T scanners can provide adequate diagnostic examinations when acquisition parameters are optimized (33,37). MRI was introduced in the follow-up of both the cohorts, which may have influenced the results during the AS follow-up.
Our results confirm that the inclusion of MRI before the confirmatory biopsy is useful to stratify the risk of reclassification at confirmatory biopsy. Presence of suspicious lesions on MRI (PI-RADS score ≥ 3) is also considered a prognostic factor for reclassification during the follow-up period.
Footnotes
Conflicts of Interest: The authors have no potential conflicts of interest to disclose.
References
- 1.Ferlay J, Soerjomataram I, Dikshit R, Eser S, Mathers C, Rebelo M, et al. Cancer incidence and mortality worldwide: sources, methods and major patterns in GLOBOCAN 2012. Int J Cancer. 2015;136:E359–E386. doi: 10.1002/ijc.29210. [DOI] [PubMed] [Google Scholar]
- 2.Stamey TA, Yang N, Hay AR, McNeal JE, Freiha FS, Redwine E. Prostate-specific antigen as a serum marker for adenocarcinoma of the prostate. N Engl J Med. 1987;317:909–916. doi: 10.1056/NEJM198710083171501. [DOI] [PubMed] [Google Scholar]
- 3.Thompson IM, Pauler DK, Goodman PJ, Tangen CM, Lucia MS, Parnes HL, et al. Prevalence of prostate cancer among men with a prostate-specific antigen level ≤4.0 ng per milliliter. N Engl J Med. 2004;350:2239–2246. doi: 10.1056/NEJMoa031918. [DOI] [PubMed] [Google Scholar]
- 4.Schröder FH, Hugosson J, Roobol MJ, Tammela TL, Ciatto S, Nelen V, et al. Screening and prostate-cancer mortality in a randomized European study. N Engl J Med. 2009;360:1320–1328. doi: 10.1056/NEJMoa0810084. [DOI] [PubMed] [Google Scholar]
- 5.European Association Urology. European Association of Urology Guidelines. 2018 edition. Uroweb.org Web site. 2018. [Accessed March 2, 2019]. https://uroweb.org/guideline/prostate-cancer/
- 6.Albertsen PC, Hanley JA, Fine J. 20-year outcomes following conservative management of clinically localized prostate cancer. JAMA. 2005;293:2095–2101. doi: 10.1001/jama.293.17.2095. [DOI] [PubMed] [Google Scholar]
- 7.Albertsen PC. Observational studies and the natural history of screen-detected prostate cancer. Curr Opin Urol. 2015;25:232–237. doi: 10.1097/MOU.0000000000000157. [DOI] [PubMed] [Google Scholar]
- 8.Loeb S, Bjurlin MA, Nicholson J, Tammela TL, Penson DF, Carter HB, et al. Overdiagnosis and overtreatment of prostate cancer. Eur Urol. 2014;65:1046–1055. doi: 10.1016/j.eururo.2013.12.062. [DOI] [PMC free article] [PubMed] [Google Scholar]
- 9.Neal DE, Metcalfe C, Donovan JL, Lane JA, Davis M, Young GJ, et al. Ten-year mortality, disease progression, and treatment-related side effects in men with localised prostate cancer from the ProtecT randomised controlled trial according to treatment received. Eur Urol. 2020;77:320–330. doi: 10.1016/j.eururo.2019.10.030. [DOI] [PubMed] [Google Scholar]
- 10.Borque-Fernando Á, Rubio-Briones J, Esteban LM, Dong Y, Calatrava A, Gómez-Ferrer Á, et al. Role of the 4Kscore test as a predictor of reclassification in prostate cancer active surveillance. Prostate Cancer Prostatic Dis. 2019;22:84–90. doi: 10.1038/s41391-018-0074-5. [DOI] [PubMed] [Google Scholar]
- 11.Borque-Fernando Á, Rubio-Briones J, Esteban LM, Collado-Serra A, Pallás-Costa Y, López-González PÁ, et al. The management of active surveillance in prostate cancer: validation of the Canary Prostate Active Surveillance Study risk calculator with the Spanish Urological Association Registry. Oncotarget. 2017;8:108451–108462. doi: 10.18632/oncotarget.21984. [DOI] [PMC free article] [PubMed] [Google Scholar]
- 12.Luzzago S, de Cobelli O, Cozzi G, Peveri G, Bagnardi V, Catellani M, et al. A novel nomogram to identify candidates for active surveillance amongst patients with International Society of Urological Pathology (ISUP) Grade Group (GG) 1 or ISUP GG2 prostate cancer, according to multiparametric magnetic resonance imaging findings. BJU Int. 2020;126:104–113. doi: 10.1111/bju.15048. [DOI] [PubMed] [Google Scholar]
- 13.Kasivisvanathan V, Giganti F, Emberton M, Moore CM. Magnetic resonance imaging should be used in the active surveillance of patients with localised prostate cancer. Eur Urol. 2020;77:318–319. doi: 10.1016/j.eururo.2019.11.014. [DOI] [PubMed] [Google Scholar]
- 14.Pepe P, Dibenedetto G, Pepe L, Pennisi M. Multiparametric MRI versus SelectMDx accuracy in the diagnosis of clinically significant PCa in men enrolled in active surveillance. In Vivo. 2020;34:393–396. doi: 10.21873/invivo.11786. [DOI] [PMC free article] [PubMed] [Google Scholar]
- 15.Klotz L, Pond G, Loblaw A, Sugar L, Moussa M, Berman D, et al. Randomized study of systematic biopsy versus magnetic resonance imaging and targeted and systematic biopsy in men on active surveillance (ASIST): 2-year postbiopsy follow-up. Eur Urol. 2020;77:311–317. doi: 10.1016/j.eururo.2019.10.007. [DOI] [PubMed] [Google Scholar]
- 16.Klotz L, Loblaw A, Sugar L, Moussa M, Berman DM, Van der Kwast T, et al. Active surveillance magnetic resonance imaging study (ASIST): results of a randomized multicenter prospective trial. Eur Urol. 2019;75:300–309. doi: 10.1016/j.eururo.2018.06.025. [DOI] [PubMed] [Google Scholar]
- 17.Purysko AS, Rosenkrantz AB, Barentsz JO, Weinreb JC, Macura KJ. PI-RADS version 2: a pictorial update. Radiographics. 2016;36:1354–1372. doi: 10.1148/rg.2016150234. [DOI] [PubMed] [Google Scholar]
- 18.Gómez Gómez E, Valero Rosa J, Carrasco Valiente J, Triviño Tarradas F, Anglada Curado F, López Ruiz D, et al. New approach to guide target prostate biopsy: technique and initial experience. Urology. 2018;121:198–199. doi: 10.1016/j.urology.2017.08.027. [DOI] [PubMed] [Google Scholar]
- 19.Tosoian JJ, Mamawala M, Epstein JI, Landis P, Macura KJ, Simopoulos DN, et al. Active surveillance of grade group 1 prostate cancer: long-term outcomes from a large prospective cohort. Eur Urol. 2020;77:675–682. doi: 10.1016/j.eururo.2019.12.017. [DOI] [PubMed] [Google Scholar]
- 20.Sathianathen NJ, Konety BR, Alarid-Escudero F, Lawrentschuk N, Bolton DM, Kuntz KM. Cost-effectiveness analysis of active surveillance strategies for men with low-risk prostate cancer. Eur Urol. 2019;75:910–917. doi: 10.1016/j.eururo.2018.10.055. [DOI] [PubMed] [Google Scholar]
- 21.Briganti A, Fossati N, Catto JWF, Cornford P, Montorsi F, Mottet N, et al. Active surveillance for low-risk prostate cancer: the European Association of urology position in 2018. Eur Urol. 2018;74:357–368. doi: 10.1016/j.eururo.2018.06.008. [DOI] [PubMed] [Google Scholar]
- 22.Moore CM, Giganti F, Albertsen P, Allen C, Bangma C, Briganti A, et al. Reporting magnetic resonance imaging in men on active surveillance for prostate cancer: the PRECISE recommendations-a report of a European school of oncology task force. Eur Urol. 2017;71:648–655. doi: 10.1016/j.eururo.2016.06.011. [DOI] [PubMed] [Google Scholar]
- 23.Ahmed HU, El-Shater Bosaily A, Brown LC, Gabe R, Kaplan R, Parmar MK, et al. Diagnostic accuracy of multi-parametric MRI and TRUS biopsy in prostate cancer (PROMIS): a paired validating confirmatory study. Lancet. 2017;389:815–822. doi: 10.1016/S0140-6736(16)32401-1. [DOI] [PubMed] [Google Scholar]
- 24.Ma TM, Tosoian JJ, Schaeffer EM, Landis P, Wolf S, Macura KJ, et al. The role of multiparametric magnetic resonance imaging/ultrasound fusion biopsy in active surveillance. Eur Urol. 2017;71:174–180. doi: 10.1016/j.eururo.2016.05.021. [DOI] [PubMed] [Google Scholar]
- 25.Hanna N, Wszolek MF, Mojtahed A, Nicaise E, Wu B, Gelpi-Hammerschmidt FJ, et al. Multiparametric magnetic resonance imaging-ultrasound fusion biopsy improves but does not replace standard template biopsy for the detection of prostate cancer. J Urol. 2019;202:944–951. doi: 10.1097/JU.0000000000000359. [DOI] [PubMed] [Google Scholar]
- 26.Schoots IG, Nieboer D, Giganti F, Moore CM, Bangma CH, Roobol MJ. Is magnetic resonance imaging-targeted biopsy a useful addition to systematic confirmatory biopsy in men on active surveillance for low-risk prostate cancer? A systematic review and meta-analysis. BJU Int. 2018;122:946–958. doi: 10.1111/bju.14358. [DOI] [PubMed] [Google Scholar]
- 27.Carlsson S, Benfante N, Alvim R, Sjoberg DD, Vickers A, Reuter VE, et al. Risk of metastasis in men with grade group 2 prostate cancer managed with active surveillance at a tertiary cancer center. J Urol. 2020;203:1117–1121. doi: 10.1097/JU.0000000000000742. [DOI] [PMC free article] [PubMed] [Google Scholar]
- 28.Elkhoury FF, Simopoulos DN, Marks LS. Targeted prostate biopsy in the era of active surveillance. Urology. 2018;112:12–19. doi: 10.1016/j.urology.2017.09.007. [DOI] [PMC free article] [PubMed] [Google Scholar]
- 29.Cantiello F, Russo GI, Kaufmann S, Cacciamani G, Crocerossa F, Ferro M, et al. Role of multiparametric magnetic resonance imaging for patients under active surveillance for prostate cancer: a systematic review with diagnostic meta-analysis. Prostate Cancer Prostatic Dis. 2019;22:206–220. doi: 10.1038/s41391-018-0113-2. [DOI] [PubMed] [Google Scholar]
- 30.Alberts AR, Roobol MJ, Drost FH, van Leenders GJ, Bokhorst LP, Bangma CH, et al. Risk-stratification based on magnetic resonance imaging and prostate-specific antigen density may reduce unnecessary follow-up biopsy procedures in men on active surveillance for low-risk prostate cancer. BJU Int. 2017;120:511–519. doi: 10.1111/bju.13836. [DOI] [PubMed] [Google Scholar]
- 31.Marliere F, Puech P, Benkirane A, Villers A, Lemaitre L, Leroy X, et al. The role of MRI-targeted and confirmatory biopsies for cancer upstaging at selection in patients considered for active surveillance for clinically low-risk prostate cancer. World J Urol. 2014;32:951–958. doi: 10.1007/s00345-014-1314-5. [DOI] [PubMed] [Google Scholar]
- 32.Margel D, Yap SA, Lawrentschuk N, Klotz L, Haider M, Hersey K, et al. Impact of multiparametric endorectal coil prostate magnetic resonance imaging on disease reclassification among active surveillance candidates: a prospective cohort study. J Urol. 2012;187:1247–1252. doi: 10.1016/j.juro.2011.11.112. [DOI] [PubMed] [Google Scholar]
- 33.Giganti F, Kirkham A, Allen C, Punwani S, Orczyk C, Emberton M, et al. Update on multiparametric prostate MRI during active surveillance: current and future trends and role of the PRECISE recommendations. AJR Am J Roentgenol. 2020 Jul; doi: 10.2214/AJR.20.23985. [Epub] [DOI] [PubMed] [Google Scholar]
- 34.Drost FH, Nieboer D, Morgan TM, Carroll PR, Roobol MJ Movember Foundation's Global Action Plan Prostate Cancer Active Surveillance (GAP) Consortium. Predicting biopsy outcomes during active surveillance for prostate cancer: external validation of the canary prostate active surveillance study risk calculators in five large active surveillance cohorts. Eur Urol. 2019;76:693–702. doi: 10.1016/j.eururo.2019.07.041. [DOI] [PubMed] [Google Scholar]
- 35.Kasabwala K, Patel N, Cricco-Lizza E, Shimpi AA, Weng S, Buchmann RM, et al. The learning curve for magnetic resonance imaging/ultrasound fusion-guided prostate biopsy. Eur Urol Oncol. 2019;2:135–140. doi: 10.1016/j.euo.2018.07.005. [DOI] [PubMed] [Google Scholar]
- 36.Kalapara AA, Verbeek JFM, Nieboer D, Fahey M, Gnanapragasam V, Van Hemelrijck M, et al. Adherence to active surveillance protocols for low-risk prostate cancer: results of the movember foundation's global action plan prostate cancer active surveillance initiative. Eur Urol Oncol. 2020;3:80–91. doi: 10.1016/j.euo.2019.08.014. [DOI] [PubMed] [Google Scholar]
- 37.Turkbey B, Rosenkrantz AB, Haider MA, Padhani AR, Villeirs G, Macura KJ, et al. Prostate imaging reporting and data system version 2.1: 2019 update of prostate imaging reporting and data system version 2. Eur Urol. 2019;76:340–351. doi: 10.1016/j.eururo.2019.02.033. [DOI] [PubMed] [Google Scholar]