

Abstract
Prenatal testosterone (T) excess-induced metabolic dysfunctions involve tissue specific changes in insulin sensitivity with insulin resistant, oxidative and lipotoxic state in liver / muscle and insulin sensitive but inflammatory and oxidative state in visceral adipose tissues (VAT). We hypothesized that mitochondrial dysfunction, endoplasmic reticulum (ER) stress and premature cellular senescence are contributors to the tissue-specific changes in insulin sensitivity. Markers of mitochondrial oxidative phosphorylation (OxPhos), number, and function, ER stress and cellular senescence (telomere length) were assessed in liver, muscle and 4 adipose (VAT, subcutaneous [SAT], epicardiac [ECAT] and perirenal [PRAT]) depots collected from control and prenatal T-treated female sheep at 21 months of age. Prenatal T treatment led to: (a) reduction in mitochondrial number and OxPhos complexes and increase in ER stress markers in muscle; (b) increase in fibrosis with trend towards increase in short telomere fragments in liver (c) depot-specific mitochondrial changes with OxPhos complexes namely increase in SAT and reduction in PRAT and increase in mitochondrial number in ECAT; (d) depot-specific ER stress marker changes with increase in VAT, reduction in SAT, contrasting changes in ECAT and no changes in PRAT; and (d) reduced shorter telomere fragments in SAT, ECAT and PRAT. These changes indicate insulin resistance may be driven by mitochondrial and ER dysfunction in muscle, fibrosis and premature senescence in liver, and depot-specific changes in mitochondrial function and ER stress without involving cellular senescence in adipose tissue. These findings provide mechanistic insights into pathophysiology of metabolic dysfunction among female offspring from hyperandrogenic pregnancies.
Keywords: Mitochondria, Telomere, ER stress, Metabolic Tissues, Oxidative Stress, Insulin Sensitivity
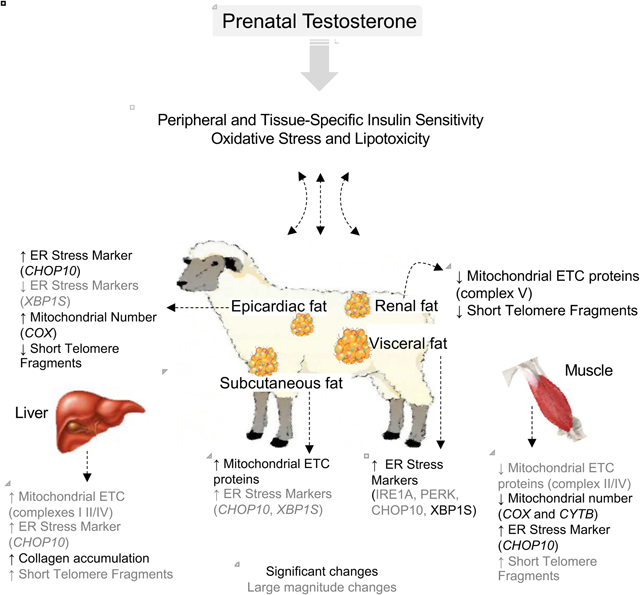
Graphical Abstract
Introduction
Intra-uterine life is a critical period of development as a growing fetus is vulnerable to subtle changes in the intrauterine milieu (Padmanabhan, Cardoso et al. 2016). A multitude of evidence exists in support of the developmental origins of health and disease (DOHaD) hypothesis where adverse conditions during early life program adult onset non communicable diseases (Hanson and Gluckman 2011) in view of the adaptive responses made by the developing individual for survival. In this context, inappropriate exposure to steroids as evident from disease states such as polycystic ovary syndrome (PCOS) or congenital adrenal hyperplasia (CAH), or exposure to environmental endocrine disrupting chemicals or pharmaceuticals (Hakim, Padmanabhan et al. 2016, Padmanabhan, Cardoso et al. 2016) is a risk factor. For instance, prenatal exposure to excess testosterone (T) in rodents (Demissie, Lazic et al. 2008, Roland, Nunemaker et al. 2010, Lazic, Aird et al. 2011), monkeys (Eisner, Dumesic et al. 2000, Bruns, Baum et al. 2007), and sheep (Cardoso and Padmanabhan 2019) lead to adult reproductive and metabolic disorders that parallel those seen in women with PCOS.
Programming of cardiometabolic dysfunctions in female sheep by excess testosterone during prenatal life include insulin resistance, dyslipidemia, hypertension and tissue-specific outcomes (King, Olivier et al. 2007, Padmanabhan, Sarma et al. 2010, Padmanabhan, Veiga-Lopez et al. 2010, Cardoso, Puttabyatappa et al. 2015, Puttabyatappa and Padmanabhan 2017). manifested as: insulin resistance (Lu, Cardoso et al. 2016) and lipotoxicity in liver and muscle (Puttabyatappa, Andriessen et al. 2017), oxidative stress (Puttabyatappa, Andriessen et al. 2017) and metabolic disruptions (Hogg, Wood et al. 2011) in liver, and adipose depot-specific disruptions in inflammatory and oxidative states, markers of adipocyte differentiation, thermogenesis, and insulin signaling (Nada, Thompson et al. 2010, Hogg, Wood et al. 2011, Puttabyatappa, Andriessen et al. 2017, Puttabyatappa, Ciarelli et al. 2019). The contribution of subcellular processes at the mitochondrial and endoplasmic reticulum (ER) level that power the cell’s biochemical reactions and protein biosynthesis to these metabolic tissue- and adipose depot-specific differences are not known.
As a central source of energy production in eukaryotic cells, mitochondria plays a critical role in cell growth, differentiation, cellular signaling, and apoptosis (Elfawy and Das 2019). Mitochondrial DNA (mtDNA) encodes 13 essential proteins forming five protein complexes (complex I-V) of the electron transport chain (ETC) that are important for cellular bioenergetics and leads to biogenesis of reactive oxygen species (ROS). Excessive ROS accumulation can result in oxidative stress, which in itself is a risk factor for mitochondrial dysfunction (Wallace 2005, Wang, Wu et al. 2013, Law, Liao et al. 2018). Excessive accumulation of ROS also impairs protein folding, leads to accumulation of unfolded or misfolded proteins, and drives ER stress by activating the unfolded protein response (UPR) (Fernandez, Ordonez et al. 2015). Oxidative stress / inflammation, such as that induced by prenatal testosterone excess in metabolic tissues (Puttabyatappa, Andriessen et al. 2017, Puttabyatappa, Ciarelli et al. 2019), have been shown to induce ER stress by activating the double-stranded RNA-dependent protein kinase-like ER kinase (PERK), inositol-requiring protein 1 (IRE1), and activating transcription factor 6 (ATF6), transcription factors C/EBP homologous protein (CHOP) and X box-binding protein 1 (XBP1) (Brown, Chan et al. 2014, Nakka, Prakash-Babu et al. 2016).
Lipotoxicity, another adverse metabolic outcome of prenatal T excess (Veiga-Lopez, Moeller et al. 2013, Puttabyatappa, Andriessen et al. 2017), can also negatively impact mitochondrial and ER function. Elevations in free fatty acids interfere with mitochondrial ATP synthesis, inhibit ETC, decrease the inner mitochondrial membrane potential (Abdul-Ghani, Muller et al. 2008, Hirabara, Curi et al. 2010), and affect mitochondrial oxidation of fatty acids leading to exacerbation of free fatty acid accumulation and mitochondrial and ER dysfunctions (Abdul-Ghani, Muller et al. 2008). Considering ER (Fu, Watkins et al. 2012) has a role in maintaining the metabolic and lipid homeostasis (Han and Kaufman 2016), ER stress induced by various stimuli can have an adverse impact on lipid metabolism and mediate lipotoxicity in peripheral metabolic organs that in turn can induce ER stress (Wang, Wei et al. 2006, Cao, Dai et al. 2012). To what extent prenatal T excess-induced dyslipidemia and hepatic and skeletal muscle lipid accumulation and oxidative stress (Veiga-Lopez, Moeller et al. 2013, Puttabyatappa, Andriessen et al. 2017) contribute to the mitochondrial and ER dysfunction remains to be determined. Increase in oxidative stress and lipotoxicity, in addition to modulating mitochondrial function and ER stress, can impair cellular components leading to fibrotic response. In support of this prenatal T-treatment induced increases in lipid accumulation in pancreatic islets (Jackson, Puttabyatappa et al. 2020) and oxidative stress and inflammatory status in VAT (Puttabyatappa, Andriessen et al. 2017, Puttabyatappa, Ciarelli et al. 2019) are associated with increase in collagen.
The metabolic derangements manifested at the level of oxidative stress, lipotoxicity, fibrosis have been shown to have a role in premature aging (Oikawa and Kawanishi 1999, Brack, Lithgow et al. 2000, Estebanez, de Paz et al. 2018, Fakouri, Hou et al. 2019) with accumulation of senescent cells characterizing age-related loss of tissue function (Victorelli and Passos 2017). Prenatal T-treated female sheep manifest premature depletion of ovarian follicular pool a marker of reproductive senescence and cardiometabolic disorders (King, Olivier et al. 2007, Smith, Steckler et al. 2009, Padmanabhan, Sarma et al. 2010, Padmanabhan, Veiga-Lopez et al. 2010, Cardoso, Puttabyatappa et al. 2015, Puttabyatappa and Padmanabhan 2017) such as that evidenced in aged individual raising the possibility that premature cellular senescence may also be involved in metabolic tissue dysfunctions. Shortening of telomeres - DNA repeats associated with proteins that are found at the ends of chromosomes (Harley, Futcher et al. 1990) serve as a marker for assessment of cellular aging. Considering all the above we tested the hypothesis that prenatal exposure to excess T programs mitochondrial and ER dysfunction, induces fibrosis and premature cellular senescence in metabolic tissues of adult female sheep.
Methods
Animals and Prenatal Treatment
Animals were housed, bred, general husbandry and nutrition provided as described previously (Manikkam, Steckler et al. 2006). All animal procedures were performed under the approved protocol of the University of Michigan Institutional Animal Care and Use Committee and met the National Research Council’s recommendations. Prenatal T- treated animals were generated as described previously (Manikkam, Steckler et al. 2006) and involved intramuscular administration of 100mg T propionate (1.2mg/kg; Sigma-Aldrich St. Louis, MO) to pregnant ewes twice weekly from days 30 to 90 of gestation. Only one offspring from each mother was used in the study if twins were involved. Number of animals used were controls n = 5–6 and prenatal T-treated n = 5 for all studies.
Tissue Collection
The female offspring of prenatal T-treated sheep manifest reproductive and metabolic features of women with PCOS (Cardoso and Padmanabhan 2019) that include oligo-anovulation, functional hyperandrogenism and polycystic ovarian morphology. To avoid confounding effects from differing steroid background, all animals were ovariectomized at ~21 months-of-age (the end of the second breeding season) and early follicular phase levels of estradiol was maintained by placing a 1 cm SILASTIC implant (Dow Corning, Midland, MI) filled with crystalline estradiol (which produces circulating concentrations of ~1pg/ml estradiol) subcutaneously as described previously (Goodman, Legan et al. 1981). Tissues were harvested during presumptive follicular phase (~11.3 weeks after ovariectomy) after subjecting to them to an artificial follicular phase protocol, that began with CIDR insertion 2 weeks prior to euthanasia. For induction of artificial follicular phase, animals were implanted with two controlled internal drug-releasing implants containing progesterone (CIDR-G; InterAg, Hamilton, New Zealand; implanted s.c.). Progesterone implants were removed 14 days later and four 30-mm estradiol implants (which produces circulating estradiol concentrations of ~3pg/ml, similar to those seen during the follicular phase in the female sheep) were inserted subcutaneously as described earlier (Goodman, Legan et al. 1981) and animals euthanized 18h later. As such, control and prenatal T-treated animals were both exposed to same postnatal steroidal milieu at the time of the tissue harvest and devoid of differences in endogenous ovarian androgen contribution for over 11 weeks. Animals were euthanized by barbiturate overdose (Fatal Plus; Vortech Pharmaceuticals, Dearborn, MI) during the artificial follicular phase, 18 hours after removal of progesterone implants and insertion of estradiol implants, and tissues were harvested. Liver was obtained from the tip of the left lobe and skeletal muscle sampled from the vastus lateralis. The adipose depots collected were visceral adipose tissue (VAT) from the around the omentum, subcutaneous adipose tissue (SAT) from the sternal region, perirenal adipose tissue (PRAT) from around the kidney and epicardiac adipose tissue (ECAT) from around the heart after opening the pericardium. Tissues were flash-frozen and stored at −80°C until processed. Studies showing effects of prenatal T treatment on reproductive attributes, insulin sensitivity, adipocyte size distribution and adipose depots-specific changes in inflammatory, oxidative stress, and adipocyte differentiation markers from this cohort have been published (Abi Salloum, Herkimer et al. 2012, Padmanabhan, Veiga-Lopez et al. 2015, Lu, Cardoso et al. 2016, Puttabyatappa, Andriessen et al. 2017).
RNA and DNA Isolation
RNA extraction was performed using Trizol reagent (Invitrogen, Carlsbad, CA), DNAse treated, and purified using the RNAeasy kit (Qiagen, Germantown, MD) following the manufacturer’s guidelines. DNA was isolated from frozen tissues using Gentra Puregene Kit (Qiagen) and treated with RNase A (Qiagen) to remove RNA as per manufacturer’s guidelines. Concentrations and nucleic acid quality were measured spectrophotometrically using NanoDrop (Thermo Fisher Scientific, Waltham, MA)
PCR Analysis
RT-PCR:
About 500ng RNA from each tissue was reverse transcribed into cDNA using the SuperScript Vilo cDNA synthesis kit (Invitrogen). Gene expression was assessed by real time RT-PCR on a myiQ iCycler instrument (BioRad, Carlsbad, CA) using SYBRgreen based technique as described previously (Puttabyatappa, Andriessen et al. 2017). Sequences for oligonucleotide primers were based on previous publications or designed using Primer Express software (Life Technologies) and their sequences are shown in Supplemental Table 1. The relative fold change for each transcript was calculated using the ΔΔCT method following normalization to the endogenous reference gene ribosomal protein L19 (RPL19). Reference gene RPL19 was chosen because of its stable expression in the ovine tissues (Vorachek, Hugejiletu et al. 2013, Jiang, Xue et al. 2015) and lack of effect of either prenatal T or bisphenol A treatment on its expression in ovine metabolic tissues used in this study (Supplemental Table 2).
Mitochondrial DNA:
To determine mitochondrial DNA copy number in each of the tissues PCR analysis were carried out as described previously (Jorgensen, Gam et al. 2009, Guo, Nie et al. 2018). PCR primers for amplification of mitochondrial DNA encoded genes cytochrome B (CYTB) and cytochrome C oxidase-1 (COX) were used from previous reports (Jorgensen, Gam et al. 2009, Guo, Nie et al. 2018). PCR was performed using the MyiQ real-time PCR detection system as described above and normalized to genomic DNA primer corresponding to glyceraldehyde 3-phosphate dehydrogenase (GAPDH) (Guo, Nie et al. 2018).
Telomere Length Assay
Telomere length in each of the tissues was assessed using TeloTAGGG™ Telomere Length Assay (Sigma-Aldrich, St Louis, MO) as per manufacturer’s recommendation and described elsewhere (Tarry-Adkins and Ozanne 2018). Briefly, about 1.0 μg DNA was digested with HinfI and RsaI restriction enzymes for 2 h at 37 °C and the restriction enzyme reaction quenched by adding 5× SDS loading buffer (Roche Diagnostics, Mannheim, Germany). The samples were than loaded onto agarose gels containing ethyl bromide (Sigma-Aldrich) and separated by pulsed field gel electrophoresis. The undigested and digested DNA were checked for non-specific degradation and digestion by the restriction enzymes by visualizing under UV light (BioRad). The separated DNA fragments were transferred to nylon membrane (Roche Diagnostics) by Southern blotting, and dioxygenin labelled telomeric repeat length was determined with anti- dioxygenin antibodies using chemiluminescent detection. The densitometry of the telomere signals was analyzed using ImageJ (National Institutes of Health, Bethesda, MD) as described previously (Tarry-Adkins and Ozanne 2018).
Western blot
Tissues were homogenized in radioimmuno precipitation assay buffer (Pierce RIPA buffer; Thermo Scientific) containing protease inhibitors (Roche Diagnostics) and phosphatase inhibitors (Roche Diagnostics). Tissue homogenates were centrifuged at 10,000g for 15 minutes at 4°C, and the whole-cell protein extract was used for the analysis. Equal amounts of protein (40μg) from both control and prenatal T-treated animals blocked by treatment were resolved on two separate SDS-PAGE gels and transferred onto a nitrocellulose membrane (Bio-Rad). Both membranes for each tissue were incubated together in blocking buffer (5%BSA diluted in Tris-buffered saline) for 60 minutes and incubated overnight (4°C) with primary antibodies cocktail (Total OXPHOS Human WB Antibody Cocktail (ab110411) Abcam, Cambridge, MA) to detect members of the mitochondrial oxidative phosphorylation pathway. Levels of proteins and the loading control (beta-tubulin) were determined in the respective membranes after stripping and reblotting. Protein bands from both blots of each tissue were simultaneously visualized using enhanced chemiluminescence (Pierce ECL Western Blotting Substrate; Thermo Scientific), on ProteinSimple FluorChem E system (San Jose, CA). Density of the bands were determined using the ImageJ software (National Institutes of Health).
Collagen Assessment
Since objective assessment of collagen deposition using picrosirius red (PSR) staining was possible only in the liver, a colorimetric assessment of collagen content was performed with all tissues including liver. For PSR staining, liver tissues were fixed overnight in a neutral buffered formaldehyde solution, paraffin embedded and sectioned at 5 μm thickness. Three liver sections 50 microns apart were de-waxed and hydrated and stained with PSR for one hour, washed twice with acidified water, counter stained with hematoxylin, dehydrated three times with 100% ethanol, cleared with xylene, and mounted. Each slide was imaged in five regions, corresponding to the four corners and the center of each tissue section. The percent of PSR stain (relative to the total tissue area analyzed) was determined using ImageJ software. Additionally, the images were evaluated for fibrosis using both Metavir and Ishak scores as described earlier (Suk and Kim 2015).
Acid soluble collagen content in the liver and muscle tissue was measured using sirius red dye binding (Sircol) assay following the protocol described before (Coentro, Capella-Monsonis et al. 2017). The acid-soluble collagen content in the adipose depot, using the same protocol, were previously published (Puttabyatappa, Ciarelli et al. 2019). Briefly, the acid-soluble collagen was extracted from 100 mg tissue homogenates incubated with 0.5 M acetic acid for 4 h at 4 °C and centrifuged to remove tissue debris. The quantity of the soluble collagen thus extracted was determined by its binding to picrosirius red dye by measuring the relative absorbance at 540 nm using a microplate reader (Molecular Devices SpectraMax, San Jose, CA). Collagen content was normalized to total protein content determined using colorimetric protein assay as per manufacturer’s recommendations (BioRad) using protein lysates prepared in parallel from 100 mg of tissue. All samples were assayed at the same time and the intra-assay coefficients of variance for Sircol assay was 3.23 ± 0.87. The measurable range for this assay is 31.25 to 500 μg/mL.
Statistical Analyses
Changes in gene expression, mitochondrial oxidative phosphorylation and telomere length between control and prenatal T-treated groups were analyzed by two-tailed Student’s t test using Prism software (version 7.0, GraphPad Software, La Jolla, CA). A p < 0.05 value was considered significant. Statistical outliers were determined by Grubbs’ test (https://www.graphpad.com/quickcalcs/grubbs1/) and removed from analysis. Additionally, as lack of significance may not be adequate to reject the null hypothesis with studies involving small sample sizes (Amrhein, Greenland et al. 2019) data were also analyzed by Cohen’s effect size analysis. The effect size with Cohen’s d value of 0.8 and above are considered as large magnitude changes which reflect the effect size of difference between the control and prenatal T groups (Cohen 1992, Nakagawa and Cuthill 2007, Padmanabhan, Veiga-Lopez et al. 2015).
Results
Prenatal T Treatment-Induced Changes in Mitochondrial Oxidative Phosphorylation
The mRNA expression of members of ETC succinate dehydrogenase complex subunit D (SDHD), ubiquinol-cytochrome c reductase core protein 2 (UQCRC2), ATPase H+ transporting 1 (ATP6D), coenzyme Q4 (COQ4) and cytochrome C (CYCS) are shown in Figure 1. A large magnitude decrease in UQCRC2 (p = 0.11; Cohen’s d = 2.3) in VAT and COQ4 (p = 0.34; Cohen’s d = 0.8) expression in SAT was evident. In ECAT depot, large magnitude decrease in SDHD (p = 0.10; Cohen’s d = 1.3) and ATP6D (p = 0.17; Cohen’s d = 1.0), a trend towards decrease in UQCRC2 (p = 0.07; Cohen’s d = 1.4) and significant decrease in CYCS (p = 0.01; Cohen’s d = 2.0) was observed. In PRAT depot, large magnitude increase in UQCRC2 (p = 0.16; Cohen’s d = 1.0) and COQ4 (p = 0.35; Cohen’s d = 1.0) were evident.
Figure 1:
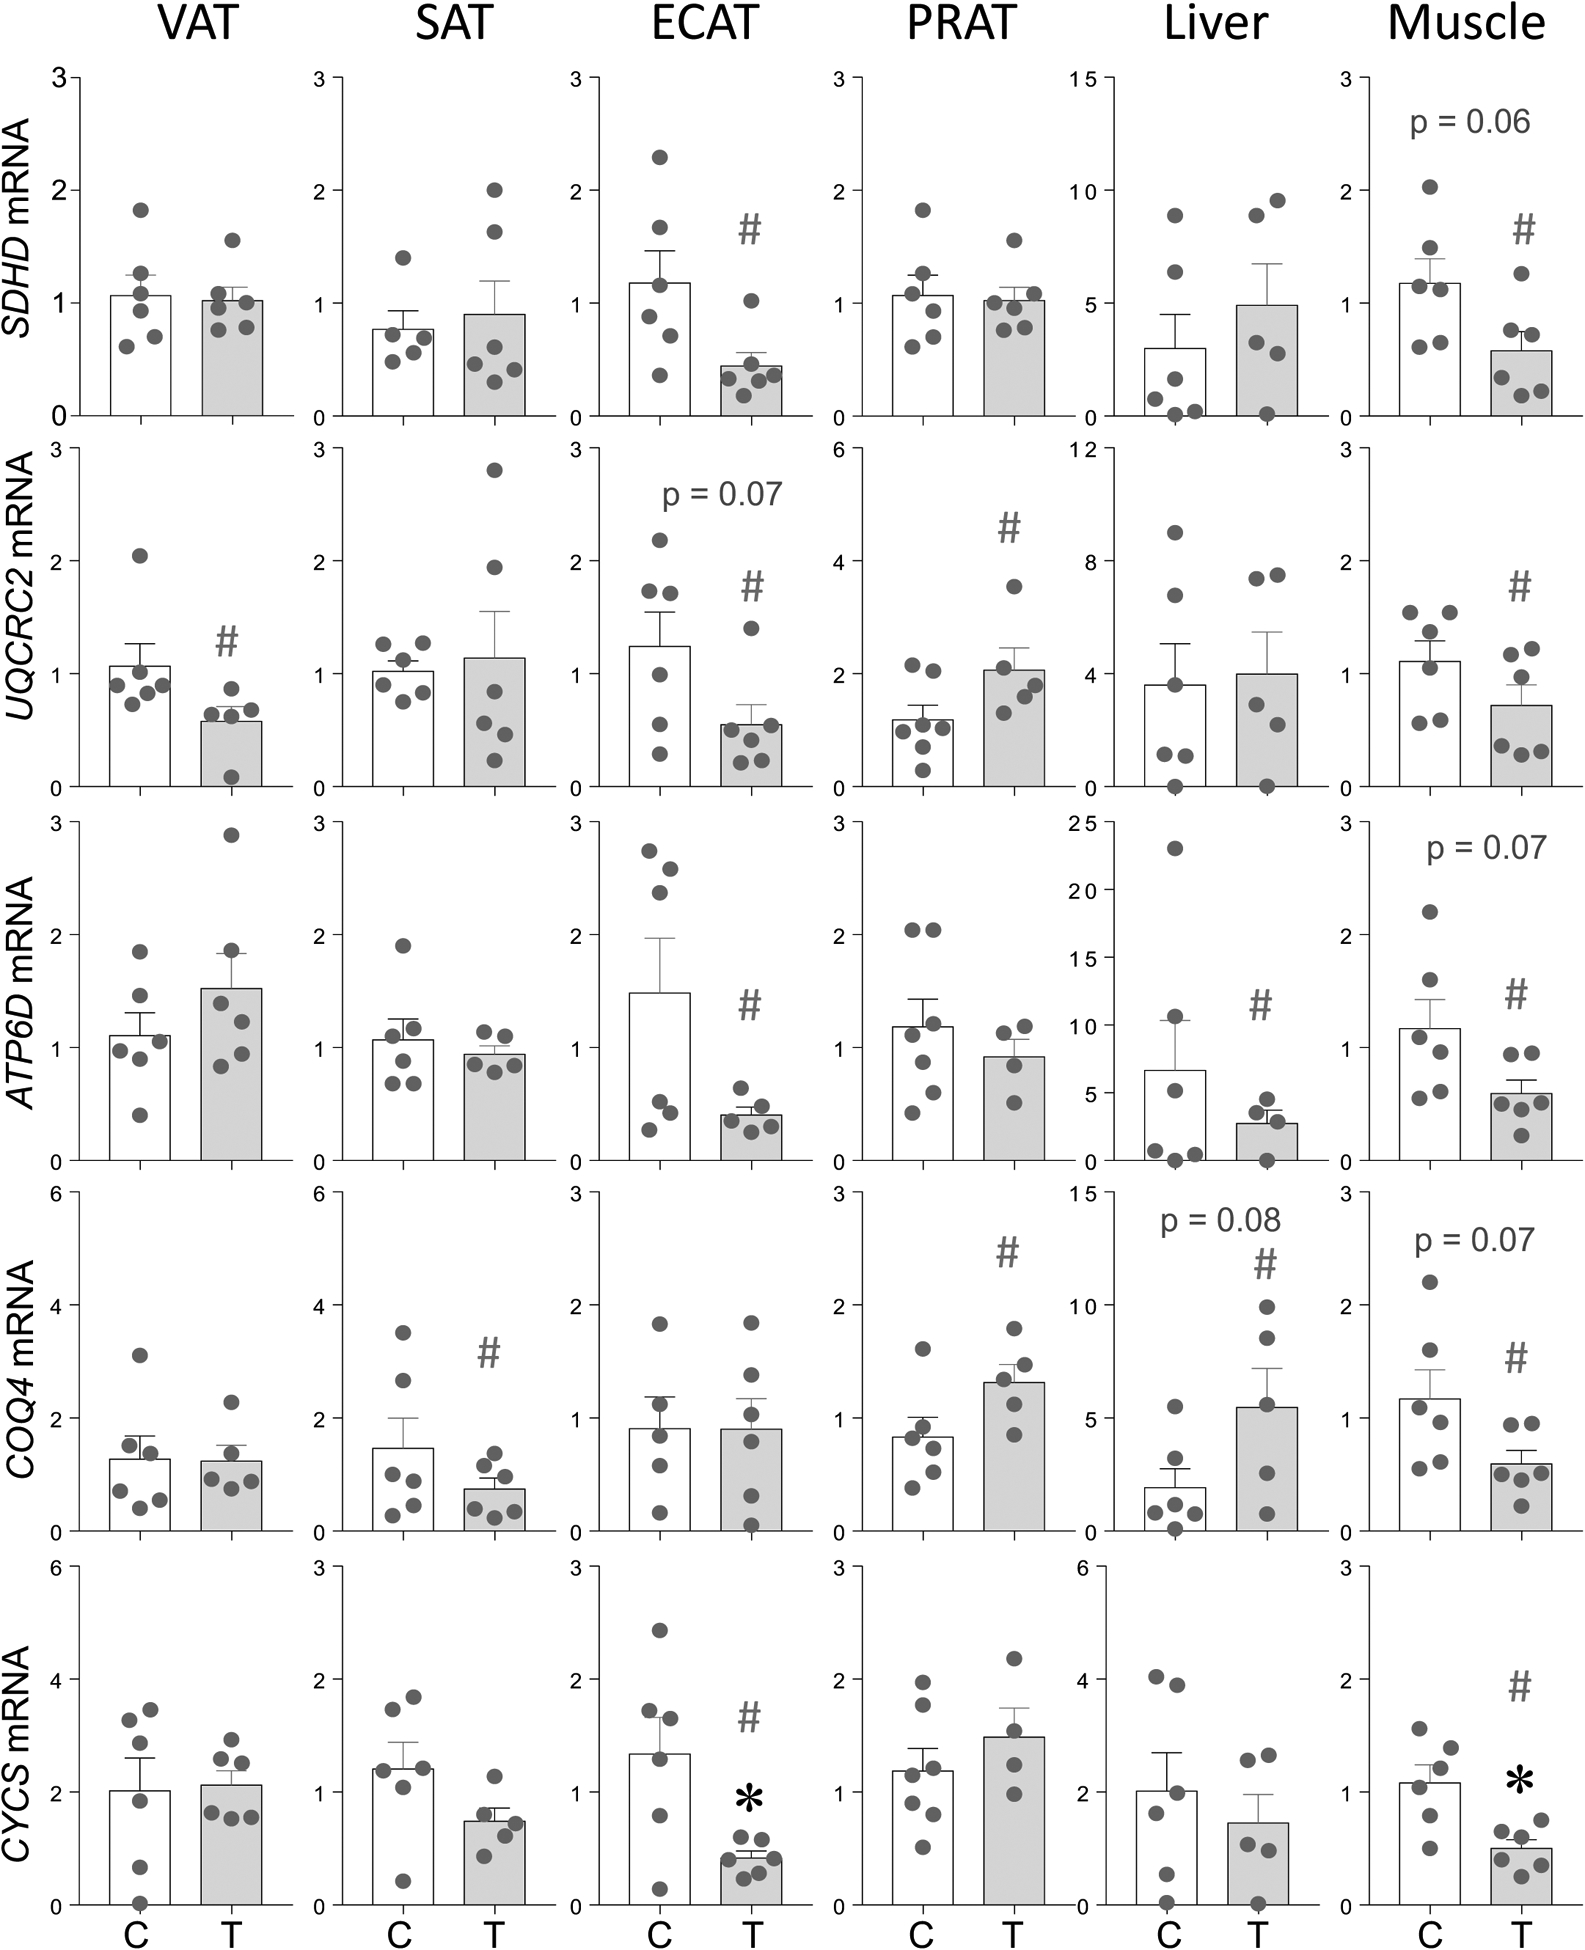
Prenatal T treatment-induced change in mRNA expression of members of ETC SDHD, UQCRC2, ATP6D, COQ4 and CYCS in the VAT, SAT, ECAT, PRAT, liver, and muscle tissues from control (C) and prenatal T-treated (T) groups. Data are presented as mean ± standard error of the relative fold change in mRNA levels. Superscript asterisk indicates significant changes by student t test with * p<0.05 vs control. Hashtag (#) above the histogram indicate large effect size by Cohen’s effect size analysis (d ≥ 0.8).
The expression of ETC members examined showed opposing changes with large magnitude decrease in ATP6D (p = 0.42; Cohen’s d = 0.8) and trend towards increase in COQ4 (p = 0.08; Cohen’s d = 1.1) in liver. In contrast, changes in the ETC members in the skeletal muscle followed a parallel direction. This was manifested as decreased trend in SDHD (p = 0.06; Cohen’s d = 1.3), ATP6D (p = 0.07; Cohen’s d = 1.2) and COQ4 (p = 0.07; Cohen’s d = 1.2), large magnitude decrease in UQCRC2 (p = 0.17; Cohen’s d = 0.9), and significant decrease in CYCS (p = 0.01; Cohen’s d = 1.0) expression.
The immunoblot detection of the ETC protein complexes involved in mitochondrial oxidative phosphorylation and their densitometric analysis in different adipose depots, liver and muscle from control and prenatal T-treated sheep are shown in Figures 2 (see also Supplemental Figure 1) and 3 (see also Supplemental Figure 2). Prenatal T-treatment did not induce any changes (p > 0.05; Cohen’s d < 0.8) in the ETC complexes in VAT and ECAT depots (Figure 2). However, prenatal T treatment-induced a significant (p = 0.05; Cohen’s d = 1.6) increase in ETC complex V and a trend (p = 0.06) towards large magnitude (Cohen’s d = 1.4) increase in complex I in the SAT depot (Figure 2). In contrast, prenatal T treatment-induced significant (p = 0.01; Cohen’s d = 2.0) decrease in levels of ETC complex V in the PRAT depot (Figure 2).
Figure 2:
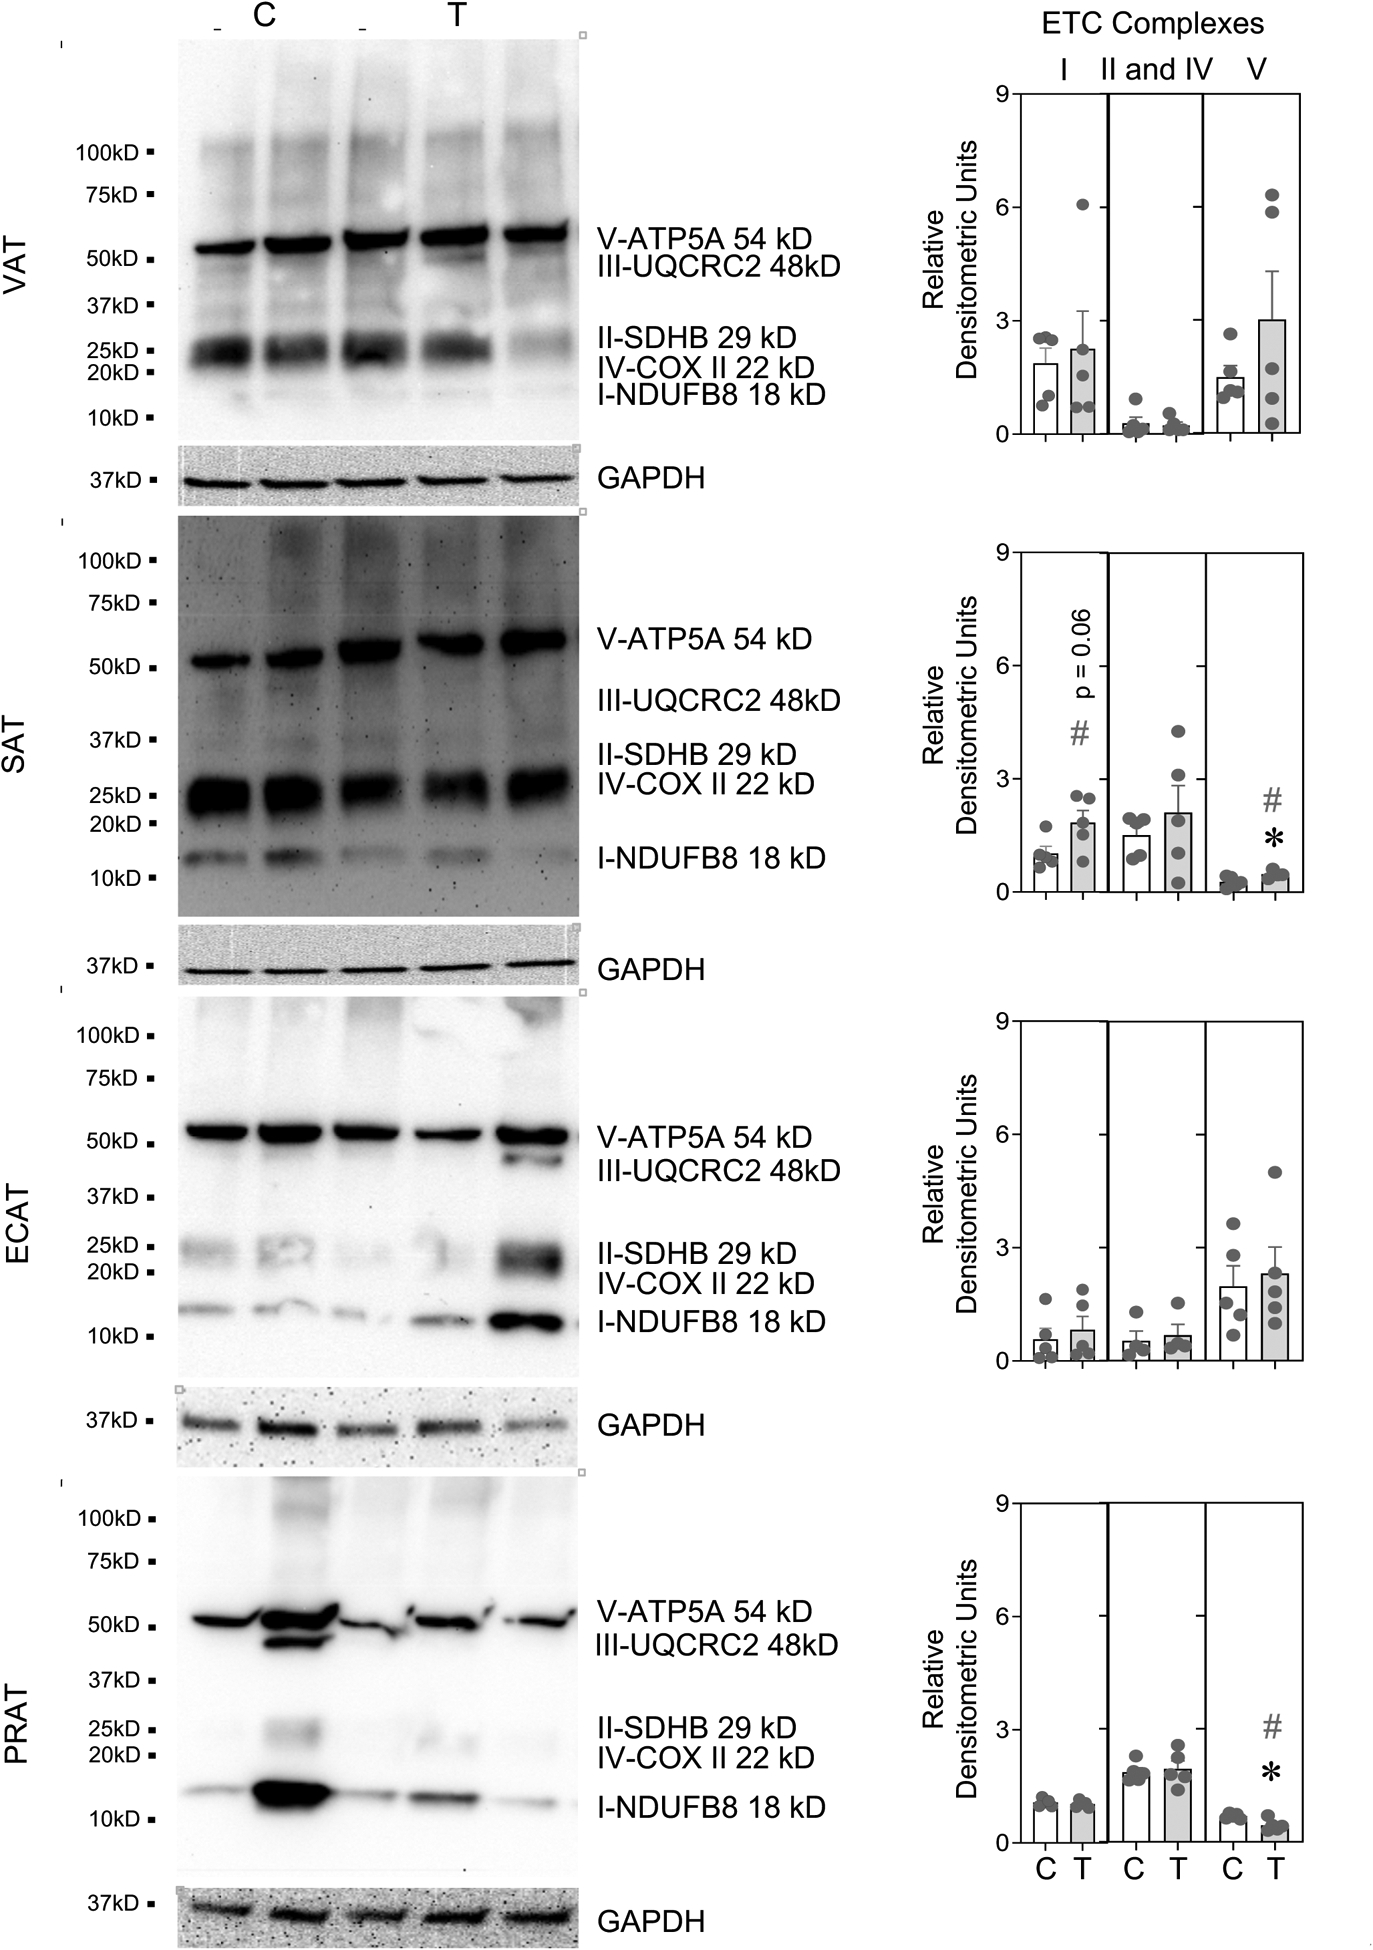
One set of Immune blots for ETC complexes with protein loading control (GAPDH) and denistometric analysis from control (C) and prenatal T-treatment (T) in the VAT, SAT, ECAT and PRAT adipose depots. Both blots used for densitometric analysis are shown in Supplemental Figure 1. The densitometric analysis of the complexes normalized to GAPDH are presented as scatter plot with the mean ± standard error of the mean. Superscript asterisk indicates significant changes by student t test with * p<0.05 vs control. Hashtag (#) above the histogram indicate large effect size by Cohen’s effect size analysis (d ≥ 0.8).
Figure 3:
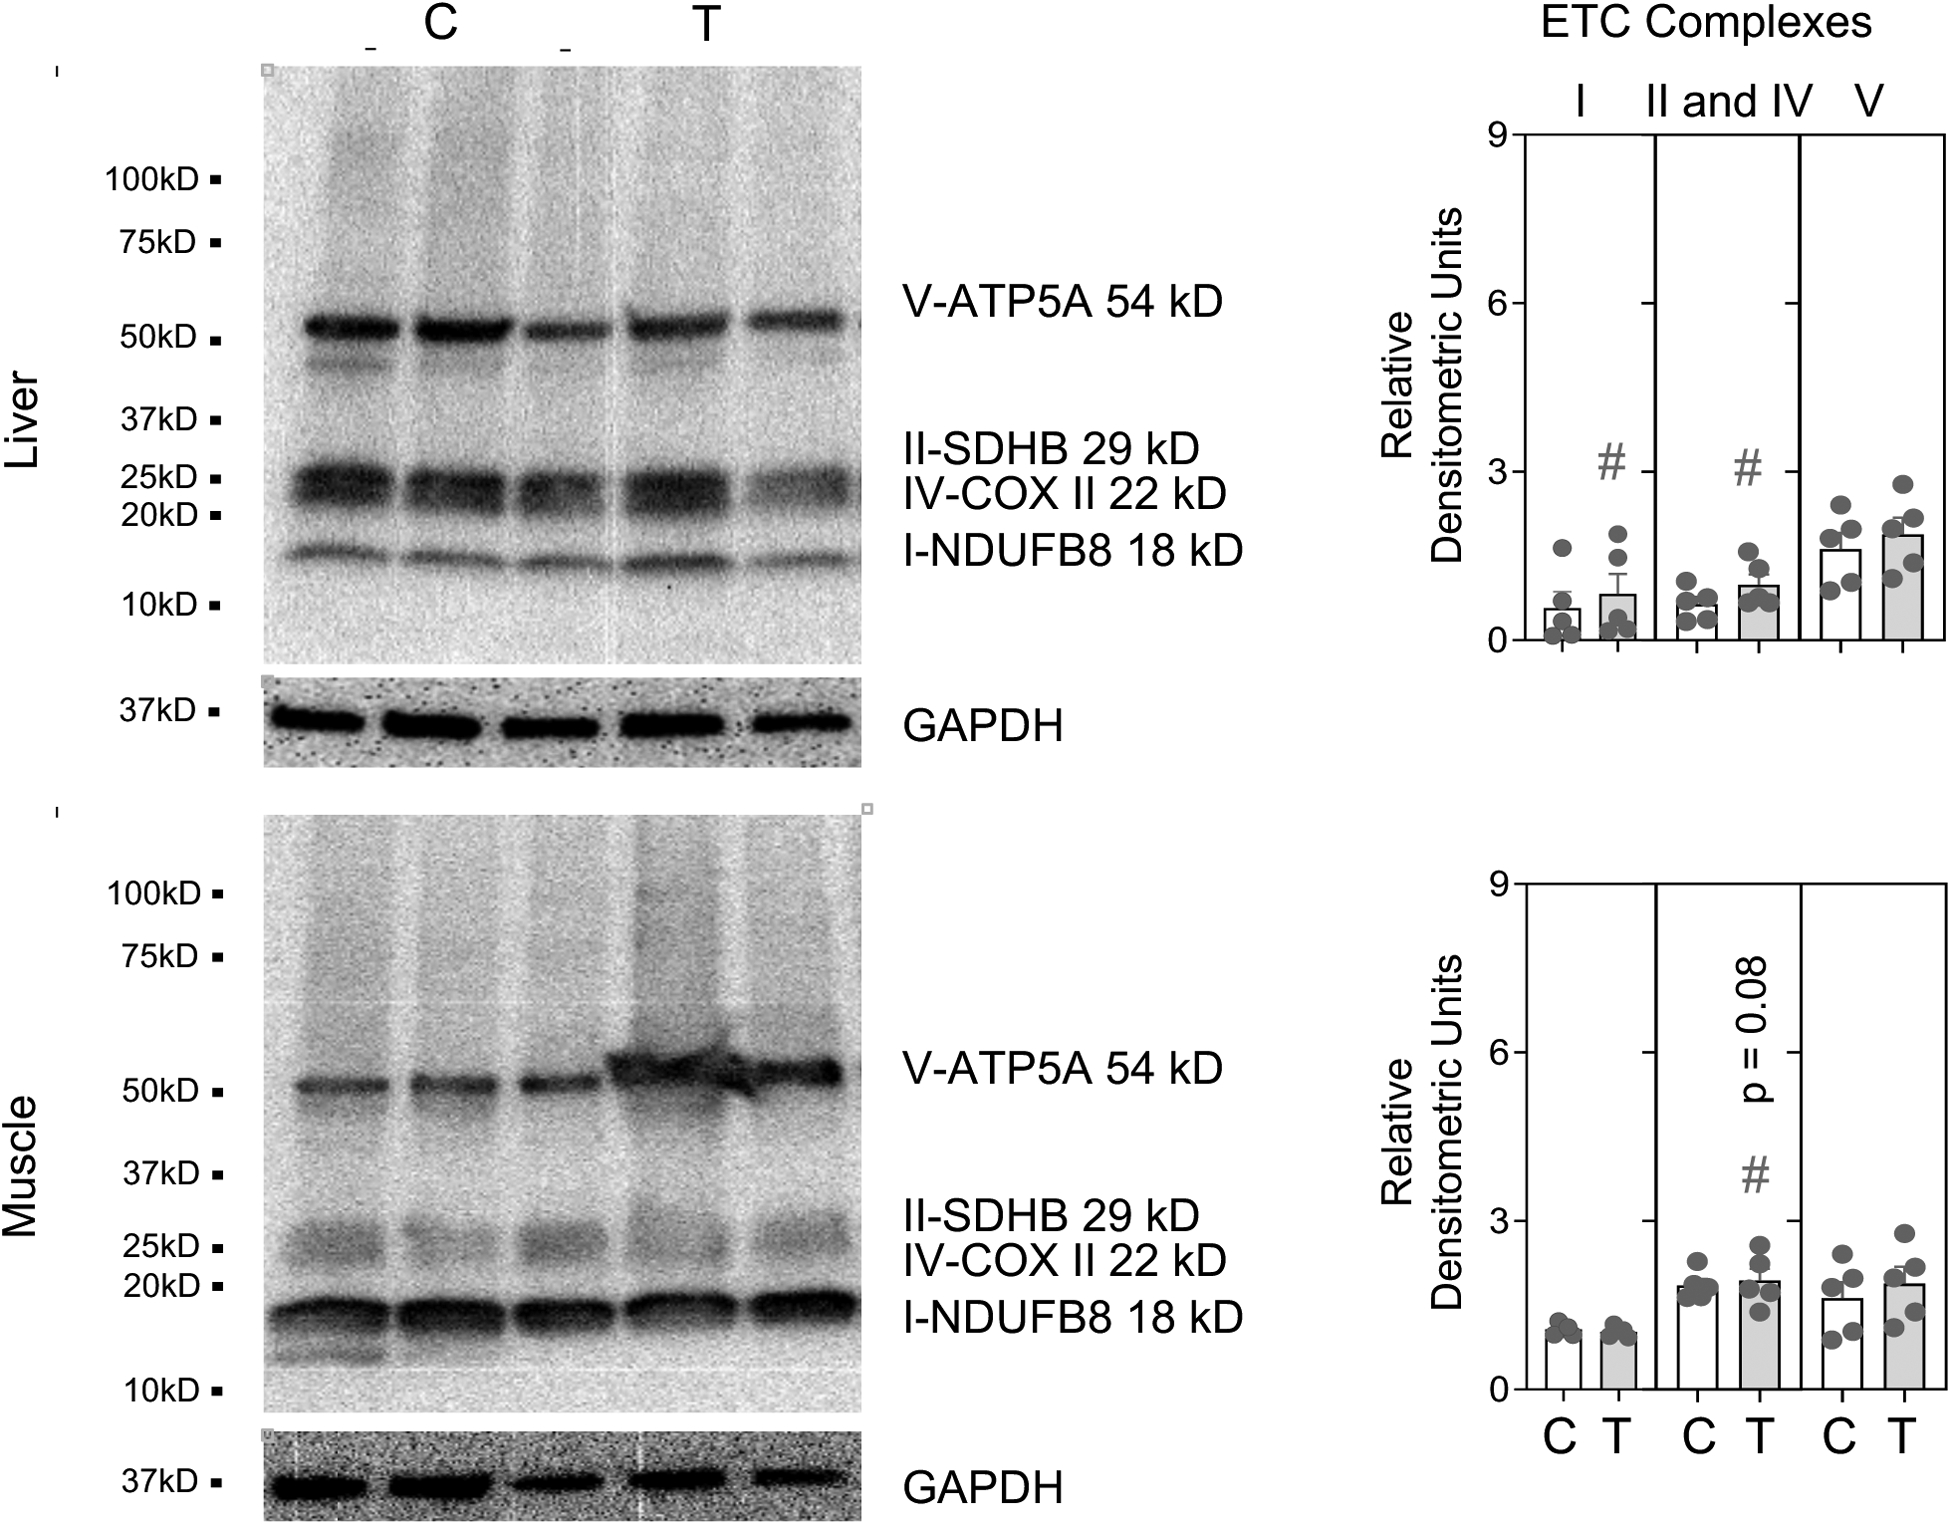
One set of Immune blots for ETC complexes with protein loading control (GAPDH) and denistometric analysis from control (C) and prenatal T-treatment (T) in the liver and muscle. Both blots used for densitometric analysis are shown in Supplemental Figure 2. The densitometric analysis of the complexes normalized to GAPDH are presented as scatter plot with the mean ± standard error of the mean. Superscript asterisk indicates significant changes by student t test with * p<0.05 vs control. Hashtag (#) above the histogram indicate large effect size by Cohen’s effect size analysis (d ≥ 0.8).
In the liver, prenatal T treatment resulted in a large magnitude increase in the ETC complexes I (p = 0.15; Cohen’s d = 1.0) and II and IV together (p = 0.16; Cohen’s d = 1.0) (Figure 3). In contrast, a trend towards large magnitude (p = 0.08; Cohen’s d = 1.3) decrease in combined levels of complexes II and IV were observed in skeletal muscle from prenatal T-treated sheep (Figure 3).
Prenatal T Treatment-Induced Changes in Mitochondrial Copy Number
PCR analysis of mtDNA encoded genes COX and CYTB found no change (p > 0.05; Cohen’s d < 0.8) in mitochondrial copy number in VAT, SAT and PRAT depots and liver from prenatal T-treated female sheep (Figure 4). In the ECAT depot however, prenatal T treatment-induced a significant (p = 0.01; Cohen’s d = 1.4) increase in COX but not CYTB DNA levels (Figure 4). In contrast, prenatal T treatment-induced a significant decrease in COX (p = 0.005; Cohen’s d = 1.0) and CYTB (p = 0.04; Cohen’s d = 0.8) DNA levels in the skeletal muscle from prenatal T-treated female sheep suggestive of reduced mitochondrial copy (Figure 4).
Figure 4:
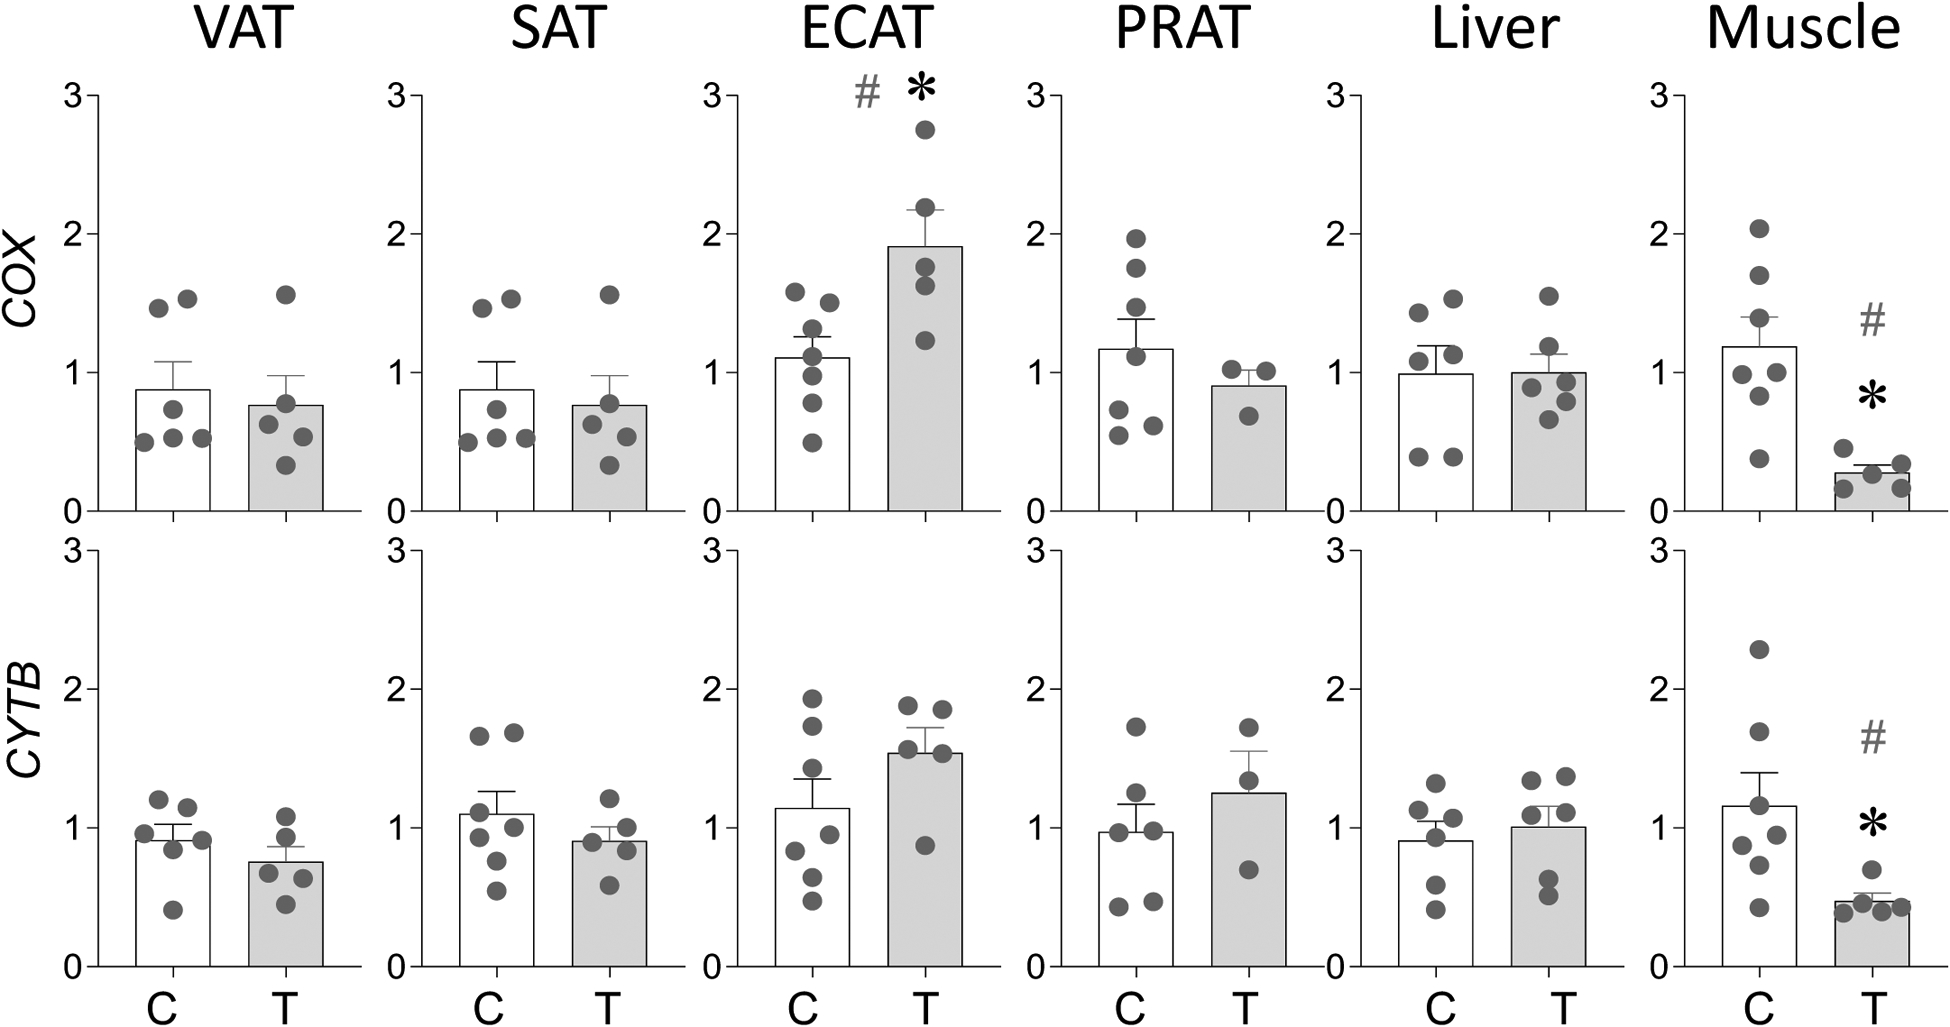
Prenatal T treatment-induced changes in levels of mitochondrial DNA encoded genes COX and CYTB in the VAT, SAT, ECAT, PRAT, liver, and muscle tissues from control (C) and prenatal T-treated (T) groups. Data are presented as scatter plot with the mean ± standard error of the mean of the fold change in gene levels. Superscript asterisk indicates significant changes by student t test with * p<0.05 vs control. Hashtag (#) above the histogram indicate large effect size by Cohen’s effect size analysis (d ≥ 0.8).
Prenatal T Treatment-Induced Changes in Regulators of Mitochondrial Function
As with the markers of mitochondrial copy number no change (p > 0.05; Cohen’s d < 0.8) in genes involved in regulation of mitochondrial function namely transcription factor A, mitochondrial (TFAM), nuclear respiratory factor 1 (NRF1) and nitric oxide synthase 2 (NOS2) were evident in the VAT, SAT and PRAT depots and liver tissue from prenatal T-treated female sheep (Figure 5). In ECAT depot, a trend (p = 0.09) towards large magnitude (Cohen’s d = 0.9) decrease in NRF1 was evident with no changes (p > 0.05; Cohen’s d < 0.8) in TFAM and NOS2 (Figure 5). In contrast, in skeletal muscle from prenatal T-treated female sheep a significant (p = 0.04; Cohen’s d = 1.6) increase in expression of TFAM and a large magnitude (p = 0.23; Cohen’s d = 1.0) decrease in NOS2 levels were evident (Figure 5).
Figure 5:
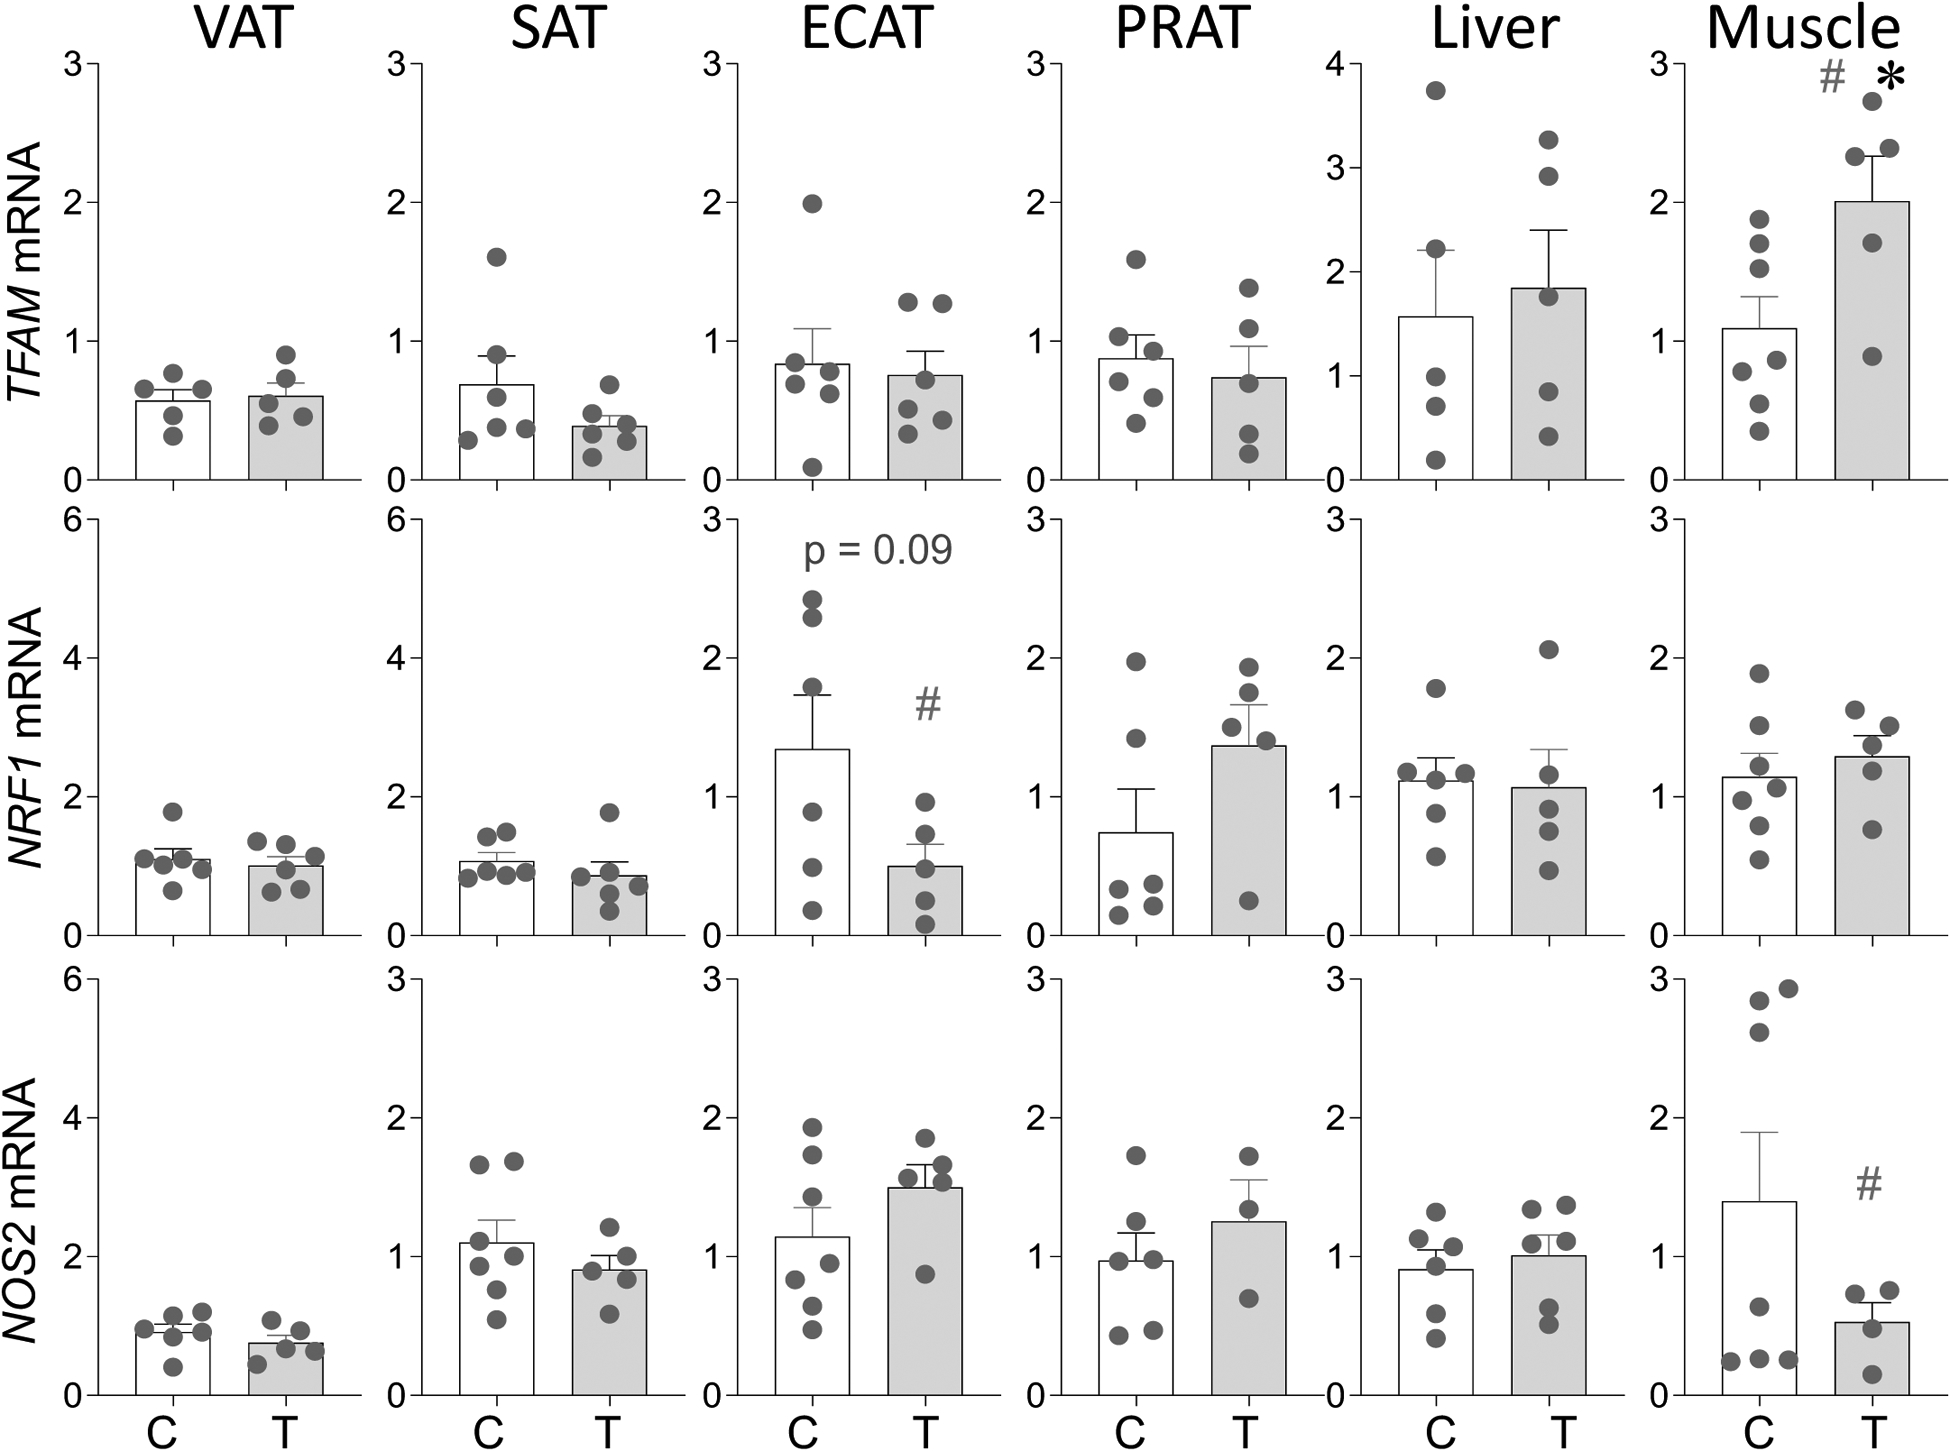
Prenatal T treatment-induced changes in gene expression of regulators of mitochondrial function TFAM, NRF1 and NOS2 in the VAT, SAT, ECAT, PRAT, liver, and muscle tissues from control (C) and prenatal T-treated (T) groups. Data are presented as scatter plot with the mean ± standard error of the mean of the fold change in mRNA levels. Superscript asterisk indicates significant changes by student t test with * p<0.05 vs control. Hashtag (#) above the histogram indicate large effect size by Cohen’s effect size analysis (d ≥ 0.8).
Prenatal T Treatment-Induced Changes in ER Stress Markers.
The gene expression changes in ER stress markers are shown in Figure 6. In the VAT, prenatal T-treatment resulted large magnitude increase in IRE1A (p = 0.13; Cohen’s d = 0.8), a trend (p = 0.09) towards large magnitude (Cohen’s d = 0.9) increase in PERK, large magnitude increase in CHOP10 (p = 0.16; Cohen’s d = 1.1) and a significant (p = 0.04; Cohen’s d = 1.2) increase in XBP1S mRNA expression (Figure 6). In SAT depot, prenatal T treatment-induced a trend towards large magnitude decrease in the mRNA expression of CHOP10 (p = 0.09; Cohen’s d = 0.9) and XBP1S (p = 0.1; Cohen’s d = 1.0) with no changes (p > 0.05; Cohen’s d < 0.8) in the expression of IRE1A, PERK and HSPA5 (Figure 6). In contrast, the ECAT depot showed significant (p = 0.03; Cohen’s d = 1.6) increase in CHOP10 and large magnitude (p = 0.27; Cohen’s d = 0.9) decrease in XBP1S in prenatal T-treated animals (Figure 6). None of the markers showed any change (p > 0.05; Cohen’s d < 0.8) in the PRAT depot.
Figure 6:
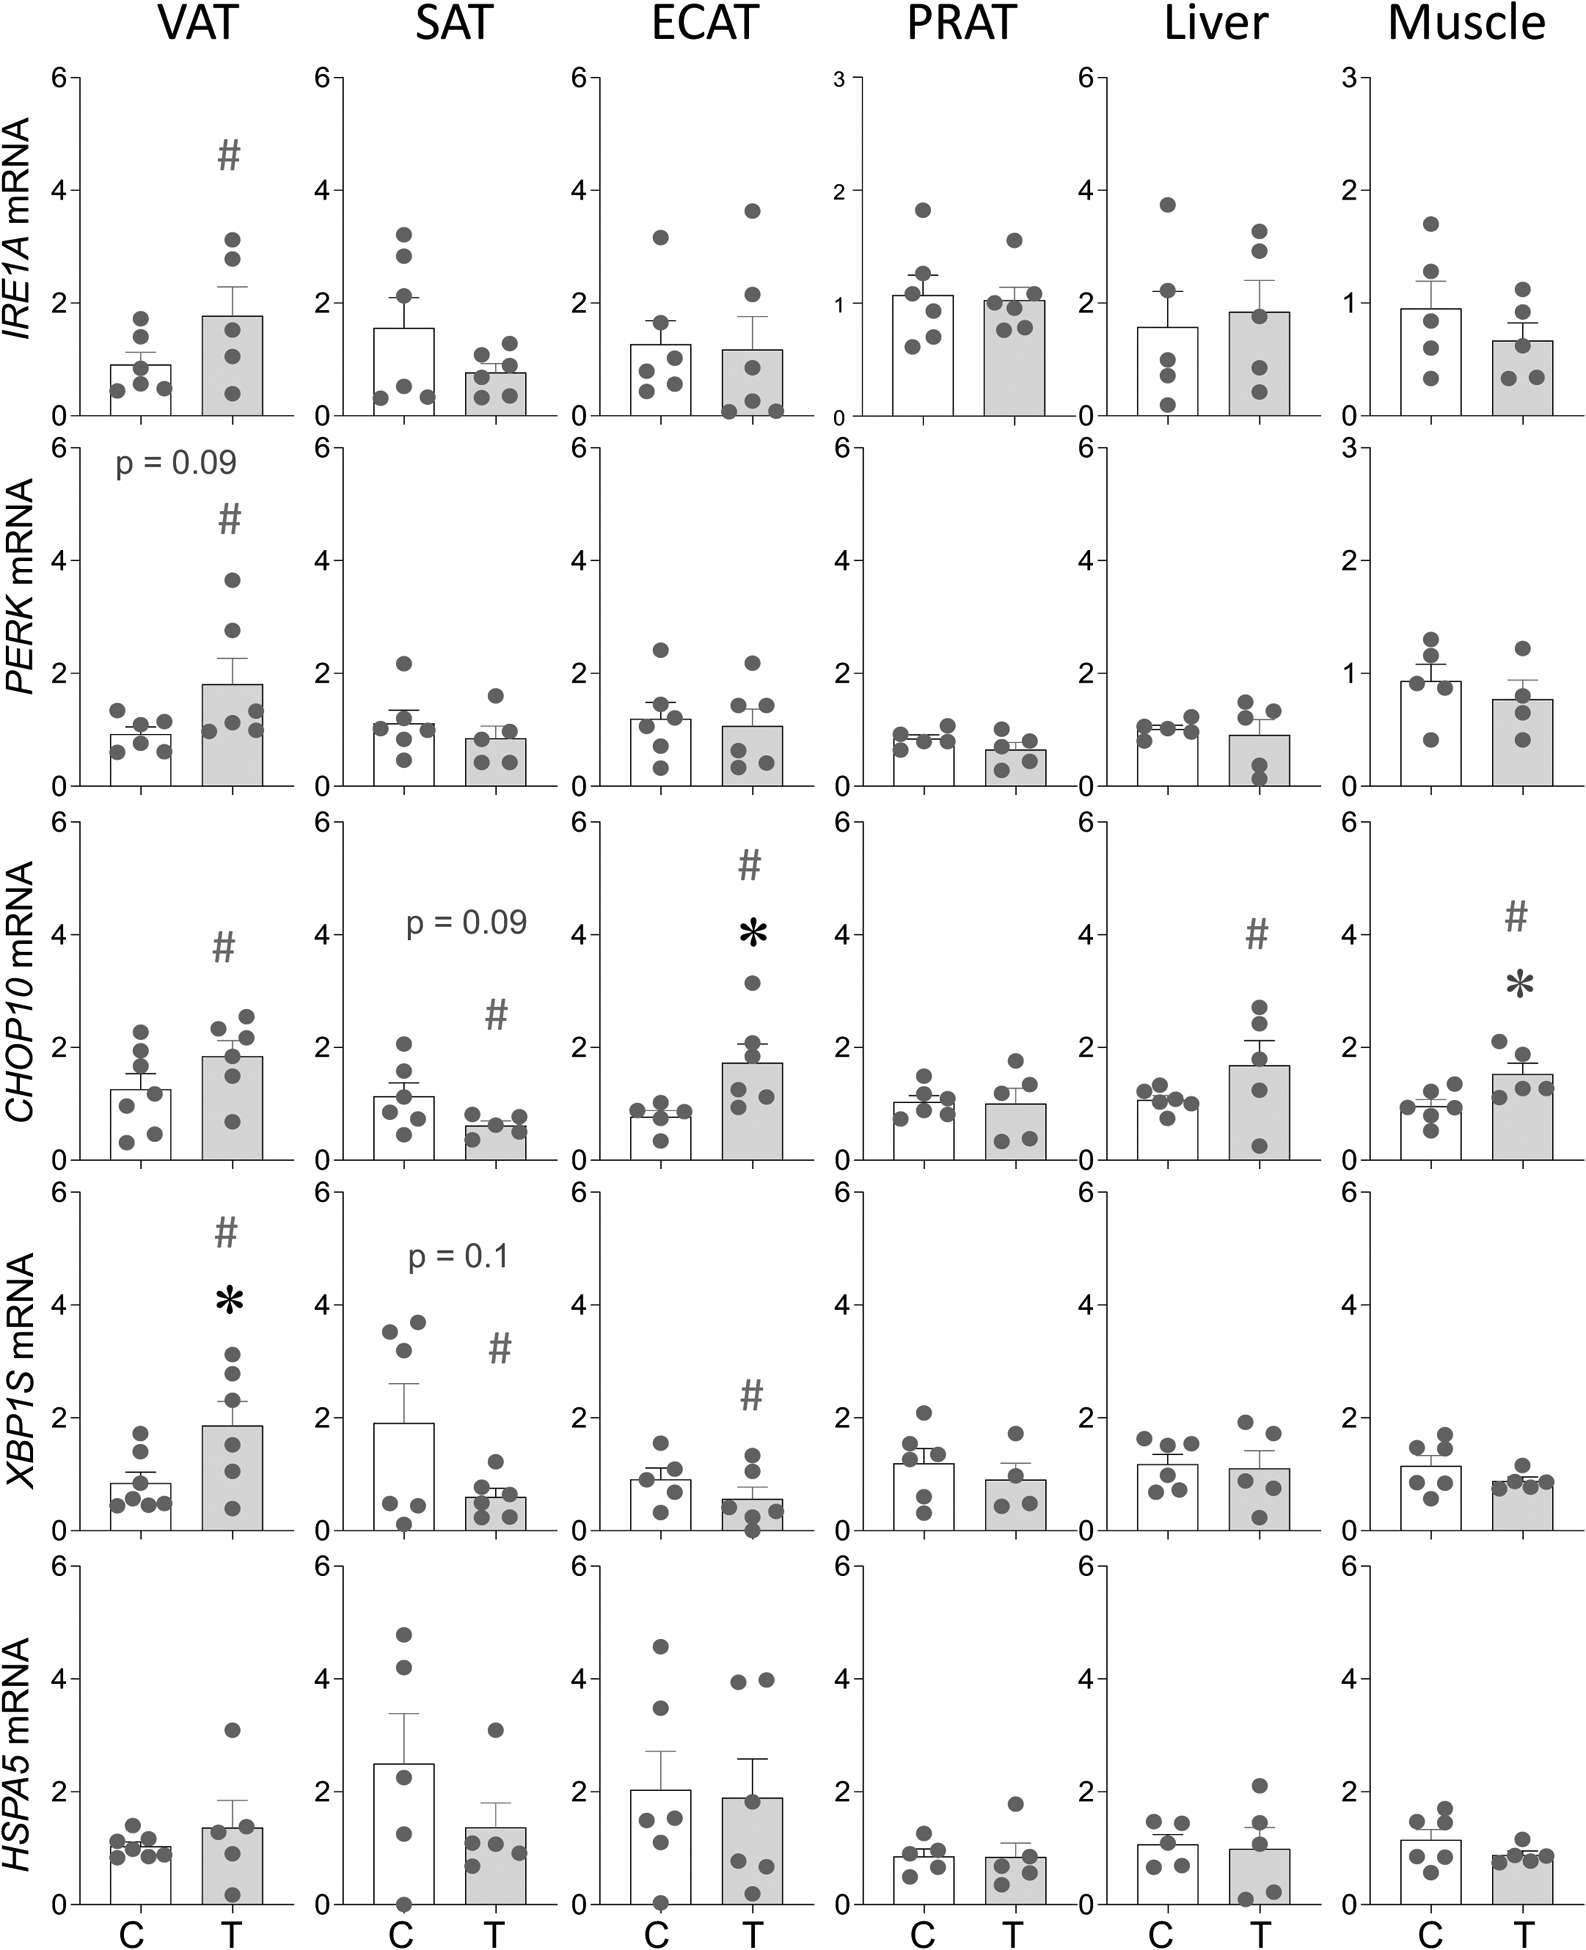
Prenatal T treatment-induced changes in gene expression of ER stress markers IRE1A, PERK, CHOP10, XBP1S and HSPA5 in the VAT, SAT, ECAT, PRAT, liver, and muscle tissues from control (C) and prenatal T-treated (T) groups. Data are presented as scatter plot with the mean ± standard error of the mean of the fold change in mRNA levels. Superscript asterisk indicates significant changes by student t test with * p<0.05 vs control. Hashtag (#) above the histogram indicate large effect size by Cohen’s effect size analysis (d ≥ 0.8).
In contrast to adipose depot specific changes, effects of prenatal T-treatment in liver and muscle were marginal with only CHOP10 among ER stress markers showing a large magnitude (p = 0.17; Cohen’s d = 0.9) in liver and a significant large magnitude (p = 0.03; Cohen’s d = 1.0) increase in the muscle (Figure 6).
Prenatal T Treatment-Induced Changes in Hepatic and Muscle Fibrosis
Prenatal T treatment-induced changes in fibrosis in adipose depots have already been published (Puttabyatappa, Ciarelli et al. 2019). Histopathological grading of fibrosis in liver as per Metavir and Ishak scores show a grade score of 1 with presence of fibrosis around portal vein (Figure 7). Quantification of fibrosis showed a large magnitude (p = 0.35; Cohen’s d = 0.8) increase in staining for collagen by PSR staining and a significant (p = 0.003; Cohen’s d = 1.1) increase in collagen protein by SirCol assay in the liver from prenatal T-treated sheep (Figure 7). In contrast, no differences (p > 0.05; Cohen’s d < 0.8) were evident in skeletal muscle between control and prenatal T-treated animals (Figure 7).
Figure 7:
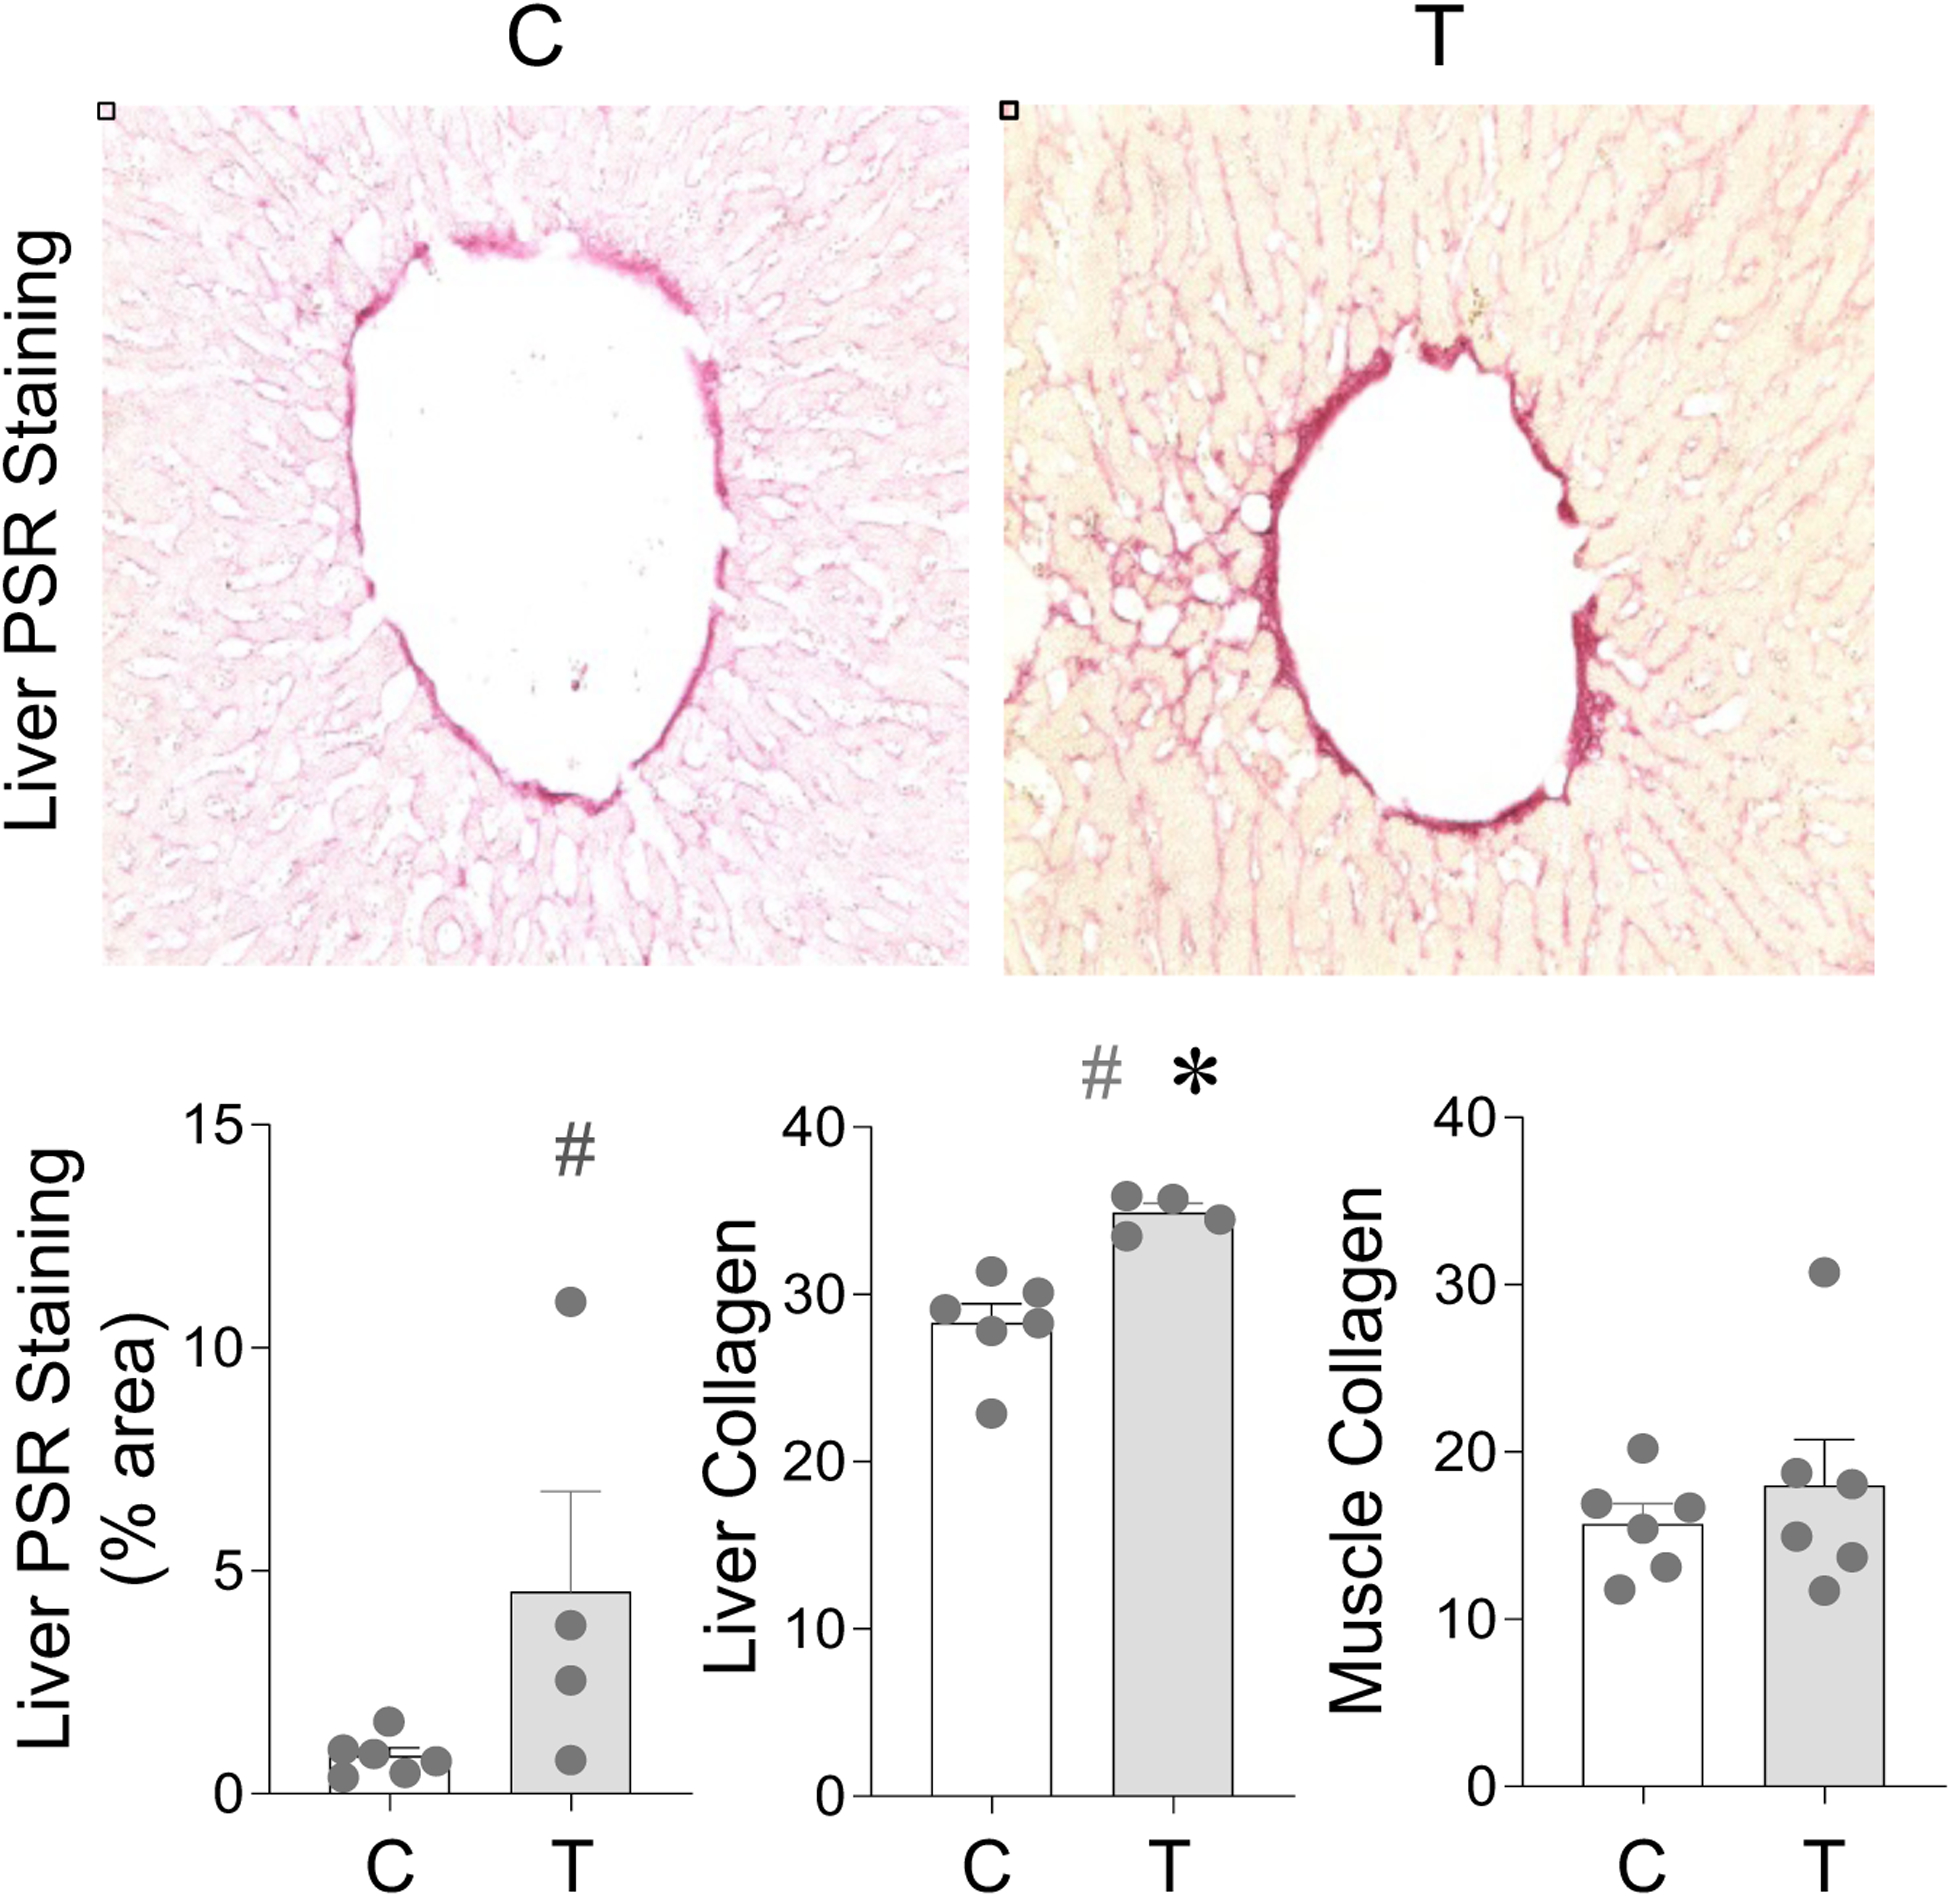
Prenatal T treatment-induced change in collagen accumulation in the liver, and muscle tissues from control (C) and prenatal T-treated (T) groups. Liver was analyzed by denistometric analysis of PSR stain and through colorimetric analysis using SirCol assay. In muscle, collagen was only analyzed using SirCol assay. Data are presented as scatter plot with the mean ± standard error. Superscript asterisk indicates significant changes by student t test with * p<0.05 vs control. Hashtag (#) above the histogram indicate large effect size by Cohen’s effect size analysis (d ≥ 0.8).
Prenatal T Excess-Induced Changes in Telomere Length
The southern blots depicting the telomere fragments in adipose depots, liver and muscle are shown in Supplemental Figure 3 and the densitometric analysis of the telomere fragments in Figure 8. Prenatal T-treatment did not induce any change (p > 0.05; Cohen’s d < 0.8) in telomere fragments in the VAT depot. The SAT depot showed a large magnitude (p = 0.17 and 0.23; Cohen’s d = 0.8 and 0.8) decrease in large telomere fragments (21.2–8.6KB and 6.1–3.6KB, respectively, Figure 8, top right). In the ECAT, prenatal T treatment induced large magnitude decrease in 6.1–3.6 KB (p = 0.45; Cohen’s d = 0.9) and 3.6–2.0 KB (p = 0.20; Cohen’s d=1.0) and a significant decrease (p = 0.04; Cohen’s d = 0.8) in 2.0–0.8 KB telomere fragments (Figure 8, middle left). In PRAT, prenatal T treatment-induced a significant decrease (p < 0.05; Cohen’s d ≥ 0.8) in all telomere fragments except the 21.2–8.6 KB fragment (Figure 8, middle right)
Figure 8:
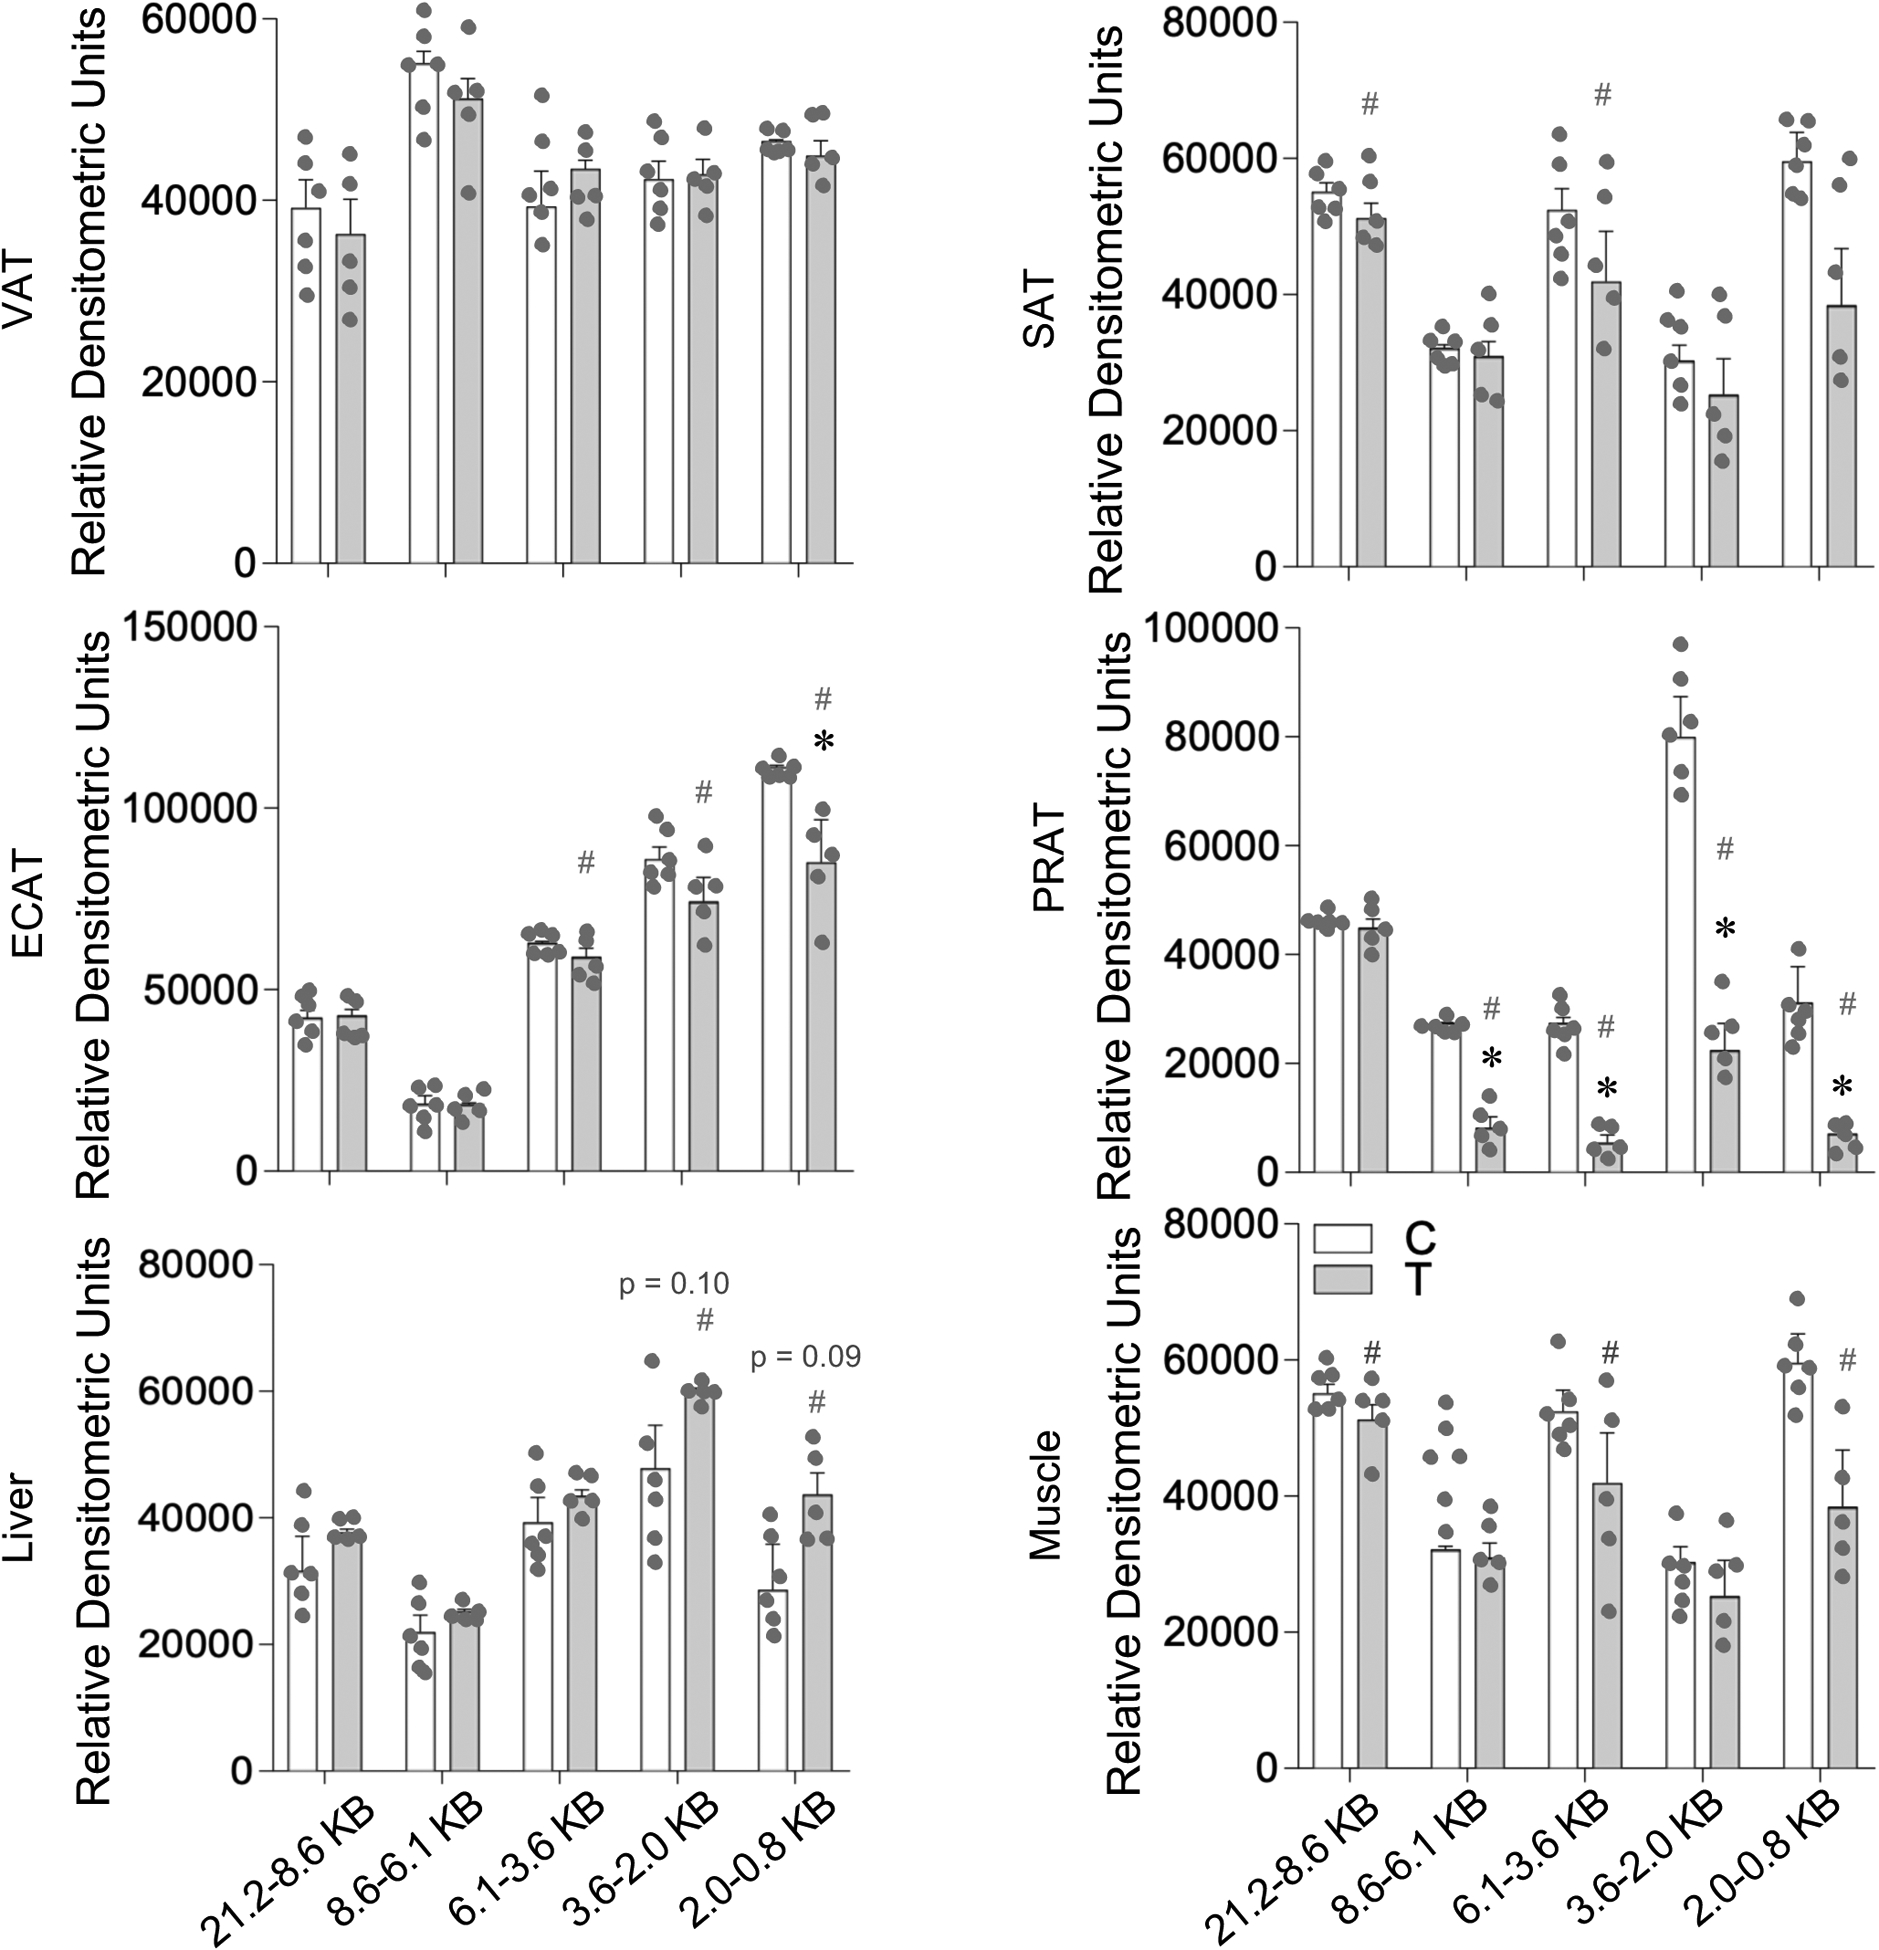
Prenatal T treatment-induced change in telomere length in the VAT, SAT, ECAT, PRAT, liver, and muscle tissues from control (C) and prenatal T-treated (T) groups. The Southern blots used for densitometric analysis are shown in Supplemental Figure 3. Data are presented as mean ± standard error of the relative densitometric values for telomere fragments probed by Southern blotting. Superscript asterisk indicates significant changes by student t test with * p<0.05 vs control. Hashtag (#) above the histogram indicate large effect size by Cohen’s effect size analysis (d ≥ 0.8).
Relative to other metabolic tissues, a trend towards large magnitude increase in shorter telomere fragments 3.6–2.0KB (p = 0.1; Cohen’s d = 0.9) and 2.0–0.8 KB (p = 0.09; Cohen’s d = 1.2) were evident in liver from prenatal T-treated female sheep (Figure 8, bottom left). The directionality of change was different for skeletal muscle, manifested as a large magnitude decrease in 2.0–0.8 KB (p > 0.24; Cohen’s d = 0.9), 6.1–3.6 KB (p > 0.29; Cohen’s d = 1.0) and 21.2–8.6 KB (p > 0.65; Cohen’s d = 0.8) telomere fragments (Figure 8, bottom right).
Discussion
The findings from this study show that prenatal T-treatment: 1) disrupts mitochondrial function and activates ER stress pathways in muscle, 2) induces fibrosis in liver, and 3) leads to depot-specific changes in markers of ER stress manifested predominantly as increased expression of multiple ER stress markers in VAT over other adipose depots. In addition, there was a suggestion of prenatal T excess increasing shorter telomere fragments - a marker of premature aging - in liver as opposed to a decrease in all other tissues. The potential relevance of these findings to metabolic tissue and adipose-depot-specific changes induced by prenatal T-treatment are summarized in Figure 8 and discussed below.
Tissue-specific effect of prenatal T-treatment on mitochondrial function
Oxidative and lipotoxic changes are known mediators of mitochondrial dysfunction. Lack of change in mitochondrial function (this study) despite the presence of inflammatory and oxidative stress status (Puttabyatappa, Ciarelli et al. 2019), was surprising in view of the disruption in gene networks involved in the mitochondrial function in the VAT depot of prenatal T-treated female sheep (Dou, Puttabyatappa et al. 2020). One possibility is that the detrimental effects of increased oxidative stress and inflammation may have been negated by the parallel increases in antioxidants and thermogenic markers (Puttabyatappa, Andriessen et al. 2017, Puttabyatappa, Ciarelli et al. 2019) that helped maintain a metabolic healthy status in this depot (Lu, Cardoso et al. 2016). The increase in mitochondrial function characterized by increased levels of ETC complexes I and V (this study) is potentially reflective of the low inflammatory and oxidative stress profile of the SAT (Puttabyatappa, Andriessen et al. 2017, Puttabyatappa, Ciarelli et al. 2019). The reduced expression of complex V in SAT relative to other depots may be a function of increased presence of uncoupling proteins (UCP) in them suggestive of increased presence of brown/beige adipocytes (Puttabyatappa, Ciarelli et al. 2019); UCPs been have been shown to uncouple ETC and prevent ATP synthesis (Zhao, Jiang et al. 2019). Similarly, the increase in mitochondrial number evidenced as an increase in mtDNA encoding for COX in ECAT may be a reflection of the higher expression of markers of brown adipocytes in this depot (Puttabyatappa, Ciarelli et al. 2019), which are rich in mitochondria (Cedikova, Kripnerova et al. 2016). While the reason for the decrease in mRNA expression of multiple members of the ETC in the absence of changes in ETC complexes measured by western blot is not obvious, whether this is a function of increase in mtDNA (this study) or higher presence of brown adipocytes (Puttabyatappa, Ciarelli et al. 2019) in this depot needs further exploration.
Paradoxically, the increase in oxidative stress and lipotoxicity (Puttabyatappa, Andriessen et al. 2017) in the liver of prenatal treated sheep had no major impact on mitochondrial function barring a trend for large magnitude increase in ETC complexes I and II/IV. This is especially surprising considering prenatal T excess-induced increase in collagen accumulation, a marker of fibrosis, in the hepatic tissues; fibrosis is known to negatively affect while amelioration of fibrosis improves the mitochondrial function (Mansouri, Gattolliat et al. 2018). The pathways involved in maintenance of hepatic mitochondrial function in the face of increase in negative regulators (oxidative stress, lipotoxicity (Puttabyatappa, Andriessen et al. 2017), fibrosis (this paper)) remains to be determined. In contrast, the decrease in ETC complexes II/IV albeit a trend and significant reduction in mitochondrial copy number seen in the muscle of prenatal T-treated sheep is consistent with lipid accumulation (Puttabyatappa, Andriessen et al. 2017) having a negative impact on mitochondrial function with the significant increase in expression of TFAM, a gene involved in mitochondrial biogenesis (Picca and Lezza 2015), reflective of a compensatory attempt to reduce mitochondrial copy number. The decrease in mRNA expression of multiple members of ETC as opposed to increased presence of ETC complexes in the skeletal muscle may reflect a compensatory response. Overall, the findings are suggestive of tissue-specific malprogramming of mitochondrial dysfunction by prenatal T excess.
Tissue-specific effect of prenatal T-treatment on ER stress
The tissue-specific changes in ER stress markers induced by prenatal T-treatment are consistent with the previously reported changes in inflammation, oxidative stress and lipotoxicity, known inducers of ER stress (Salvado, Palomer et al. 2015). For instance, VAT, which manifests higher inflammatory status compared to other depots (Puttabyatappa, Ciarelli et al. 2019), showed increased expression of multiple markers of ER stress (significant increase in XBP1S expression and a trend for large magnitude increases in IRE1A, PERK, and CHOP10). In contrast, expression of CHOP10 and XBP1S tended to be reduced in SAT, accordant with its low inflammatory and oxidative stress status (Puttabyatappa, Andriessen et al. 2017, Puttabyatappa, Ciarelli et al. 2019). The ECAT depot which showed contrasting changes in expression of proinflammatory cytokine expression (Puttabyatappa, Ciarelli et al. 2019) also showed opposing changes in the markers of ER stress with increase in CHOP10 and large magnitude decrease in XBP1S. These adipose depot-specific changes in ER stress status that are in line with their inflammatory status raise the possibility that inflammatory status may drive the ER stress status. Lack of changes in markers of ER stress in PRAT, in spite of their increased inflammatory and oxidative stress status, goes against this premise suggestive of compensatory mechanisms being in place to offer protection.
Among the factors that contribute to development of hepatic and skeletal muscle insulin resistance is ER stress (Salvado, Palomer et al. 2015). Consistent with the insulin resistant state in liver and skeletal muscle of prenatal T-treated sheep (Lu, Cardoso et al. 2016), there was an increase in CHOP10, a transcription factor that is activated by cellular pathways induced by ER stress (Hu, Tian et al. 2018). The prenatal T treatment-induced dyslipidemia (Veiga-Lopez, Moeller et al. 2013) and triglyceride accumulation in liver and muscle (Puttabyatappa, Andriessen et al. 2017) may have contributed to this increase. In support of this premise, treatment of hepatocytes and myocytes with triglyceride palmitate has been shown to increase ER stress (Peng, Li et al. 2011, Li, Min et al. 2014). All in all prenatal T excess programmed changes in ER stress are consistent with the inflammatory, oxidative stress and lipid metabolism defects seen in the metabolic tissues.
Tissue-specific effect of prenatal T-treatment on fibrosis
Inflammation, oxidative stress and lipotoxicity are known to induce fibrosis, a characteristic feature of which is collagen accumulation (Kershenobich Stalnikowitz and Weissbrod 2003). In line with this we previously found that prenatal T-treatment increases collagen accumulation in the VAT depot which is characterized by inflammatory and oxidative stress state and reduced adipocyte differentiation (Cardoso, Puttabyatappa et al. 2015, Puttabyatappa, Andriessen et al. 2017, Puttabyatappa, Lu et al. 2018) but not in SAT. An increase in collagen accumulation was also evident In the liver from prenatal T-treated sheep (this study) in keeping with its inflammatory and oxidative stress state (Puttabyatappa, Andriessen et al. 2017). The observed fibrotic changes induced by prenatal T excess parallel findings in other animal models and human subjects who develop hepatic fibrosis (Berumen, Baglieri et al. 2020, Zhu, Tabas et al. 2020). Lack of increase in collagen in the skeletal muscle from prenatal T-treated sheep may be a function of relatively lower degree of inflammatory, oxidative stress and lipotoxic state (Puttabyatappa, Andriessen et al. 2017).
Tissue-specific effect of prenatal T-treatment on telomere length
Numerous studies in humans and animal models have documented that oxidative stress such as that evident in metabolic tissues of prenatal T-treated sheep accelerates telomere shortening, a marker of aging (Barnes, Fouquerel et al. 2019). Prenatal T-treatment of chicken has been shown to impair repair of oxidative damage of DNA (Treidel, Whitley et al. 2013), a process through which oxidative stress also induces aging (Liguori, Russo et al. 2018). As with mitochondrial function, the marginal effect on telomere shortening seems to be programmed in a tissue-specific manner by prenatal T excess. For instance, while no reduction in telomere fragment size was apparent in VAT, this was not the case in ECAT and PRAT depots, despite their oxidative stress and / or inflammatory state. The increased expression of markers of brown/beige fat in the ECAT and PRAT depots (Puttabyatappa, Ciarelli et al. 2019) may have served to protect shortening of telomere length. In contrast, increase in shorter telomere fragments albeit a trend in the liver of prenatal T-treated female sheep: 1) conforms with its oxidative stress and lipotoxic state (Puttabyatappa, Andriessen et al. 2017), and fibrosis (this study) status and 2) suggests potential involvement of premature cellular senescence in prenatal T-programming of hepatic insulin resistance, a characteristic of chronic liver diseases (Aravinthan and Alexander 2016).
Translational Relevance
The findings from this study may be of translational relevance to humans considering prenatal T-treated sheep manifests metabolic defects like insulin resistance, dyslipidemia, adipose defects and hepatic steatosis, pathophysiological changes characterizing women with PCOS (Padmanabhan and Veiga-Lopez 2013, Anagnostis, Tarlatzis et al. 2018) and patients exhibiting type 2 diabetes such as non-alcoholic fatty liver disease (NAFLD) (Robinson and Shah 2020) and metabolic syndrome (Rochlani, Pothineni et al. 2015). It is now being increasingly apparent that mitochondrial dysfunctions and ER stress play an important role in the development of PCOS, NAFLD and other metabolic dysfunctions (Corbould 2008, Schroder and Sutcliffe 2010, Lee, Park et al. 2019, Merhi, Kandaraki et al. 2019, Xia, Wang et al. 2020, Zeng, Huang et al. 2020). Tissue-specific changes in mitochondrial function in women with PCOS, the characteristics of whom prenatal T-treated sheep mimic, are limiting with one study showing decreased mitochondrial oxidative metabolism gene expression in the skeletal muscle of women with PCOS (Skov, Glintborg et al. 2007) and another reporting no changes in mitochondrial function or number in myotube cultures established from PCOS subjects (Eriksen, Minet et al. 2011). Studies of telomere length are limited to reproductive tissues and peripheral circulating leucocytes (Li, Du et al. 2014, Pedroso, Miranda-Furtado et al. 2015, Pedroso, Santana et al. 2020) in women with PCOS and indicate women with shorter leucocyte telomere length, marker of premature senescence, are at higher risk for development of PCOS (Li, Du et al. 2014). Shortening of telomere length in hepatocytes (Nakajima, Moriguchi et al. 2006) have also been reported in NAFLD subjects, a finding consistent with the NAFLD like hepatic phenotype (Puttabyatappa, Andriessen et al. 2017) and a trend for increase in shortened telomere fragments in prenatal T-treated sheep. Although mitochondrial and endoplasmic dysfunction have been suggested to have a role in adipose dysfunction in PCOS women (Corbould 2008) most evidence come from obese PCOS women (Kokosar, Benrick et al. 2016). The finding that prenatal T-treated sheep while showing no change in body weight (Veiga-Lopez, Moeller et al. 2013) manifest adipose defects (Puttabyatappa, Lu et al. 2018, Puttabyatappa, Ciarelli et al. 2019) and depot-specific changes in ER stress (this study) raises the possibility that adipose from non-obese PCOS patients may also have depot-specific changes in ER stress.
The major strength of this study relates to the use of a precocial species with developmental time line similar to the humans and the focus on multiple metabolic tissues in parallel that cross talk with each other. However, these findings should be considered with caution taking into account the small sample size that restricted achievement of significance in spite of the large magnitude changes identified through effect size analysis. The findings should be viewed as pointing to directions for future detailed investigations and not establishing causality. Developmental programming studies such as these that involve large animal models wherein animal experimentation itself (from breeding to study of offspring at 21 months of age) takes close to 3 years to complete does not allow easy mechanistic followup with functional analysis such as assessment of mitochondrial respiration. The artificial follicular phase protocol implemented ~11.3 weeks post-ovariectomy for tissue harvest should have normalized the steroidal milieu of control and prenatal T-treated animals and therefore expected to have eliminated any potential differences by activational effects from ovarian androgen while leaving behind the programmed effects of prenatal androgen excess to manifest itself. To what extent the differences in prevailing steroid milieu of the different stages of the estrous cycle of ovary-intact animals would have additional impact on programmed metabolic defects remains to be determined.
In summary, the findings from this study suggest that prenatal exposure to excess T can lead to tissue-specific changes in mitochondrial and ER function, fibrotic response and shortening of telomere length. Further investigations incorporating functional end points are needed to confirm the contribution of these subcellular processes to the tissue-specific and adipose depot-specific disruptions and changes in insulin sensitivity in prenatal T-treated sheep. Since the prenatal T-treated sheep show pathophysiological similarities with women with PCOS, the contribution of mitochondrial dysfunction, ER stress, and premature aging to metabolic disorders in offspring of hyperandrogenic pregnancies such as PCOS is a fertile ground for future investigations.
Supplementary Material
Figure 9:
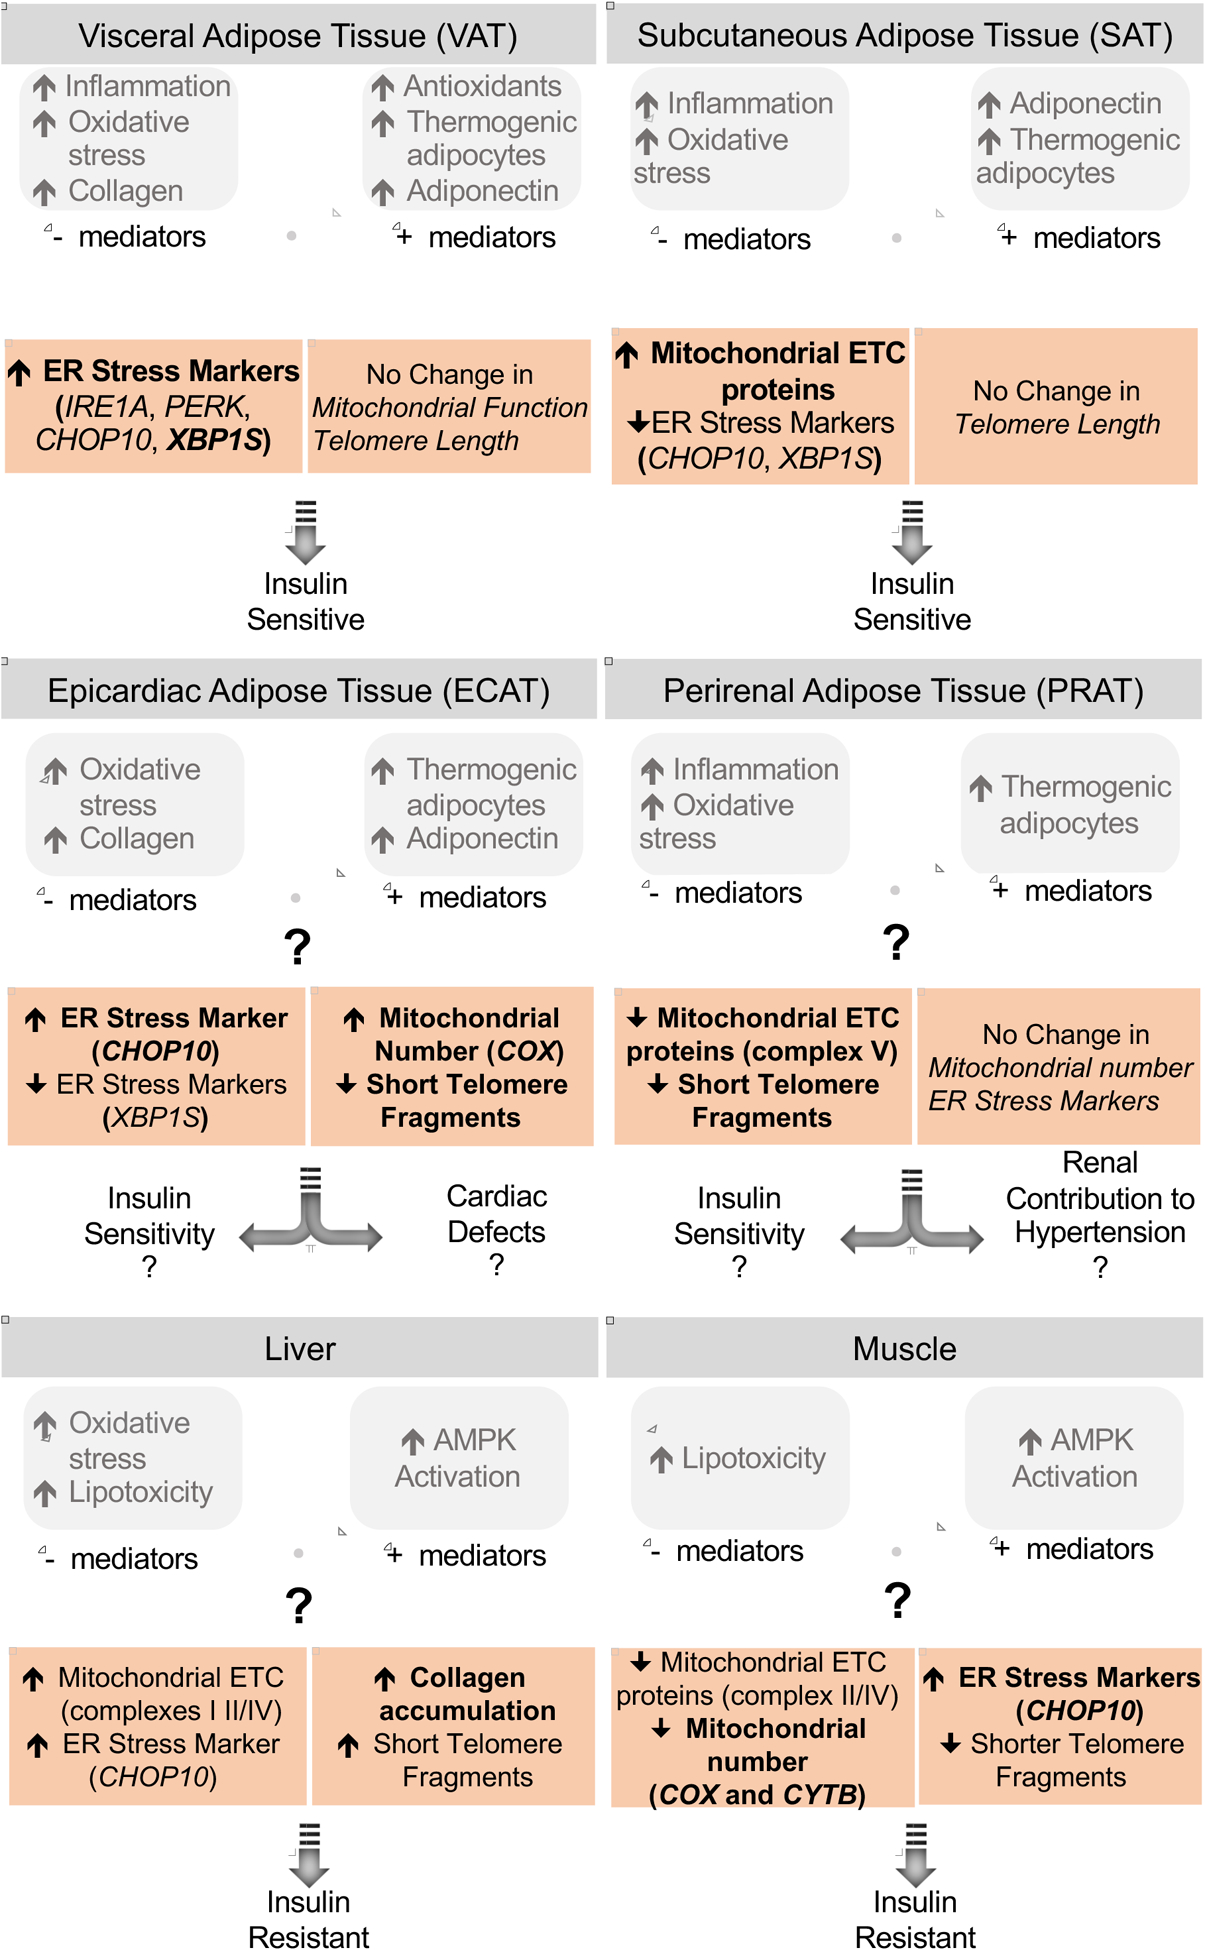
Summary of findings on the effect of prenatal T-treatment on the mitochondrial and ER function, fibrotic response and telomere length in the different adipose depots, liver and muscle (highlighted) and their relationship with previous findings and potential impact on tissue-specific insulin sensitivity. The significant findings are shown in bold while the large magnitude changes are unbolded.
Highlights.
Prenatal T excess induced fibrosis and telomere shortening in liver
Prenatal T excess induced mitochondrial dysfunction and ER stress in muscle
Prenatal T excess induced depot-specific mitochondrial, ER and telomere changes
Prenatal T increased ER stress in VAT while reducing it in SAT
Prenatal T improved mitochondrial function reduced telomere shortening in SAT/ECAT
Acknowledgement
We thank Mr. Douglas Doop and Gary McCalla for their valuable assistance in breeding, lambing, and careful animal care; Dr. Almudena Veiga-Lopez, Dr. Bachir Abi Salloum, Mr. Evan Beckett, Mrs. Carol Herkimer and students support through the University of Michigan Undergraduate Research Opportunity Program for the help provided with administration of treatments and tissue collection.
Funding source: Research reported in this publication was supported by P01 HD44232 and R01 HD099096 to VP.
Footnotes
Publisher's Disclaimer: This is a PDF file of an unedited manuscript that has been accepted for publication. As a service to our customers we are providing this early version of the manuscript. The manuscript will undergo copyediting, typesetting, and review of the resulting proof before it is published in its final form. Please note that during the production process errors may be discovered which could affect the content, and all legal disclaimers that apply to the journal pertain.
Disclosure statement: Authors have nothing to disclose.
References
- Abdul-Ghani MA, Muller FL, Liu Y, Chavez AO, Balas B, Zuo P, Chang Z, Tripathy D, Jani R, Molina-Carrion M, Monroy A, Folli F, Van Remmen H and DeFronzo RA (2008). “Deleterious action of FA metabolites on ATP synthesis: possible link between lipotoxicity, mitochondrial dysfunction, and insulin resistance.” Am J Physiol Endocrinol Metab 295(3): E678–685. [DOI] [PubMed] [Google Scholar]
- Abi Salloum B, Herkimer C, Lee JS, Veiga-Lopez A and Padmanabhan V (2012). “Developmental programming: prenatal and postnatal contribution of androgens and insulin in the reprogramming of estradiol positive feedback disruptions in prenatal testosterone-treated sheep.” Endocrinology 153(6): 2813–2822. [DOI] [PMC free article] [PubMed] [Google Scholar]
- Amrhein V, Greenland S and McShane B (2019). “Scientists rise up against statistical significance.” Nature 567(7748): 305–307. [DOI] [PubMed] [Google Scholar]
- Anagnostis P, Tarlatzis BC and Kauffman RP (2018). “Polycystic ovarian syndrome (PCOS): Long-term metabolic consequences.” Metabolism 86: 33–43. [DOI] [PubMed] [Google Scholar]
- Aravinthan AD and Alexander GJ (2016). “Senescence in chronic liver disease: Is the future in aging?” J Hepatol 65(4): 825–834. [DOI] [PubMed] [Google Scholar]
- Barnes RP, Fouquerel E and Opresko PL (2019). “The impact of oxidative DNA damage and stress on telomere homeostasis.” Mech Ageing Dev 177: 37–45. [DOI] [PMC free article] [PubMed] [Google Scholar]
- Berumen J, Baglieri J, Kisseleva T and Mekeel K (2020). “Liver fibrosis: Pathophysiology and clinical implications.” Wiley Interdiscip Rev Syst Biol Med: e1499. [DOI] [PMC free article] [PubMed] [Google Scholar]
- Brack C, Lithgow G, Osiewacz H and Toussaint O (2000). “EMBO WORKSHOP REPORT: Molecular and cellular gerontology Serpiano, Switzerland, September 18–22, 1999.” EMBO J 19(9): 1929–1934. [DOI] [PMC free article] [PubMed] [Google Scholar]
- Brown MK, Chan MT, Zimmerman JE, Pack AI, Jackson NE and Naidoo N (2014). “Aging induced endoplasmic reticulum stress alters sleep and sleep homeostasis.” Neurobiol Aging 35(6): 1431–1441. [DOI] [PMC free article] [PubMed] [Google Scholar]
- Bruns CM, Baum ST, Colman RJ, Dumesic DA, Eisner JR, Jensen MD, Whigham LD and Abbott DH (2007). “Prenatal androgen excess negatively impacts body fat distribution in a nonhuman primate model of polycystic ovary syndrome.” Int J Obes (Lond) 31(10): 1579–1585. [DOI] [PMC free article] [PubMed] [Google Scholar]
- Cao J, Dai DL, Yao L, Yu HH, Ning B, Zhang Q, Chen J, Cheng WH, Shen W and Yang ZX (2012). “Saturated fatty acid induction of endoplasmic reticulum stress and apoptosis in human liver cells via the PERK/ATF4/CHOP signaling pathway.” Mol Cell Biochem 364(1–2): 115–129. [DOI] [PubMed] [Google Scholar]
- Cardoso RC and Padmanabhan V (2019). “Developmental Programming of PCOS Traits: Insights from the Sheep.” Med Sci (Basel) 7(7). [DOI] [PMC free article] [PubMed] [Google Scholar]
- Cardoso RC, Puttabyatappa M and Padmanabhan V (2015). “Steroidogenic versus Metabolic Programming of Reproductive Neuroendocrine, Ovarian and Metabolic Dysfunctions.” Neuroendocrinology 102(3): 226–237. [DOI] [PMC free article] [PubMed] [Google Scholar]
- Cedikova M, Kripnerova M, Dvorakova J, Pitule P, Grundmanova M, Babuska V, Mullerova D and Kuncova J (2016). “Mitochondria in White, Brown, and Beige Adipocytes.” Stem Cells Int 2016: 6067349. [DOI] [PMC free article] [PubMed] [Google Scholar]
- Coentro JQ, Capella-Monsonis H, Graceffa V, Wu Z, Mullen AM, Raghunath M and Zeugolis DI (2017). “Collagen Quantification in Tissue Specimens.” Methods Mol Biol 1627: 341–350. [DOI] [PubMed] [Google Scholar]
- Cohen J (1992). “A power primer.” Psychol Bull 112(1): 155–159. [DOI] [PubMed] [Google Scholar]
- Corbould A (2008). “Insulin resistance in skeletal muscle and adipose tissue in polycystic ovary syndrome: are the molecular mechanisms distinct from type 2 diabetes?” Panminerva Med 50(4): 279–294. [PubMed] [Google Scholar]
- Demissie M, Lazic M, Foecking EM, Aird F, Dunaif A and Levine JE (2008). “Transient prenatal androgen exposure produces metabolic syndrome in adult female rats.” Am J Physiol Endocrinol Metab 295(2): E262–268. [DOI] [PMC free article] [PubMed] [Google Scholar]
- Dou JF, Puttabyatappa M, Padmanabhan V and Bakulski KM (2020). “Developmental Programming: Adipose Depot-Specific Transcriptional Regulation by Prenatal Testosterone Excess in a Sheep Model of PCOS “ Mol Cell Endocrinol. [DOI] [PMC free article] [PubMed] [Google Scholar]
- Eisner JR, Dumesic DA, Kemnitz JW and Abbott DH (2000). “Timing of prenatal androgen excess determines differential impairment in insulin secretion and action in adult female rhesus monkeys.” J Clin Endocrinol Metab 85(3): 1206–1210. [DOI] [PubMed] [Google Scholar]
- Elfawy HA and Das B (2019). “Crosstalk between mitochondrial dysfunction, oxidative stress, and age related neurodegenerative disease: Etiologies and therapeutic strategies.” Life Sci 218: 165–184. [DOI] [PubMed] [Google Scholar]
- Eriksen MB, Minet AD, Glintborg D and Gaster M (2011). “Intact primary mitochondrial function in myotubes established from women with PCOS.” J Clin Endocrinol Metab 96(8): E1298–1302. [DOI] [PubMed] [Google Scholar]
- Estebanez B, de Paz JA, Cuevas MJ and Gonzalez-Gallego J (2018). “Endoplasmic Reticulum Unfolded Protein Response, Aging and Exercise: An Update.” Front Physiol 9: 1744. [DOI] [PMC free article] [PubMed] [Google Scholar]
- Fakouri NB, Hou Y, Demarest TG, Christiansen LS, Okur MN, Mohanty JG, Croteau DL and Bohr VA (2019). “Toward understanding genomic instability, mitochondrial dysfunction and aging.” FEBS J 286(6): 1058–1073. [DOI] [PubMed] [Google Scholar]
- Fernandez A, Ordonez R, Reiter RJ, Gonzalez-Gallego J and Mauriz JL (2015). “Melatonin and endoplasmic reticulum stress: relation to autophagy and apoptosis.” J Pineal Res 59(3): 292–307. [DOI] [PubMed] [Google Scholar]
- Fu S, Watkins SM and Hotamisligil GS (2012). “The role of endoplasmic reticulum in hepatic lipid homeostasis and stress signaling.” Cell Metab 15(5): 623–634. [DOI] [PubMed] [Google Scholar]
- Goodman RL, Legan SJ, Ryan KD, Foster DL and Karsch FJ (1981). “Importance of variations in behavioural and feedback actions of oestradiol to the control of seasonal breeding in the ewe.” J Endocrinol 89(2): 229–240. [DOI] [PubMed] [Google Scholar]
- Guo YX, Nie HT, Xu CJ, Zhang GM, Sun LW, Zhang TT, Wang Z, Feng X, You PH and Wang F (2018). “Effects of nutrient restriction and arginine treatment on oxidative stress in the ovarian tissue of ewes during the luteal phase.” Theriogenology 113: 127–136. [DOI] [PubMed] [Google Scholar]
- Hakim C, Padmanabhan V and Vyas AK (2016). “Gestational Hyperandrogenism in Developmental Programming.” Endocrinology: en20161801. [DOI] [PMC free article] [PubMed] [Google Scholar]
- Han J and Kaufman RJ (2016). “The role of ER stress in lipid metabolism and lipotoxicity.” J Lipid Res 57(8): 1329–1338. [DOI] [PMC free article] [PubMed] [Google Scholar]
- Hanson M and Gluckman P (2011). “Developmental origins of noncommunicable disease: population and public health implications.” Am J Clin Nutr 94(6 Suppl): 1754S–1758S. [DOI] [PubMed] [Google Scholar]
- Harley CB, Futcher AB and Greider CW (1990). “Telomeres shorten during ageing of human fibroblasts.” Nature 345(6274): 458–460. [DOI] [PubMed] [Google Scholar]
- Hirabara SM, Curi R and Maechler P (2010). “Saturated fatty acid-induced insulin resistance is associated with mitochondrial dysfunction in skeletal muscle cells.” J Cell Physiol 222(1): 187–194. [DOI] [PubMed] [Google Scholar]
- Hogg K, Wood C, McNeilly AS and Duncan WC (2011). “The in utero programming effect of increased maternal androgens and a direct fetal intervention on liver and metabolic function in adult sheep.” PLoS One 6(9): e24877. [DOI] [PMC free article] [PubMed] [Google Scholar]
- Hu H, Tian M, Ding C and Yu S (2018). “The C/EBP Homologous Protein (CHOP) Transcription Factor Functions in Endoplasmic Reticulum Stress-Induced Apoptosis and Microbial Infection.” Front Immunol 9: 3083. [DOI] [PMC free article] [PubMed] [Google Scholar]
- Jackson IJ, Puttabyatappa M, Anderson M, Muralidharan M, Veiga-Lopez A, Gregg B, Limesand S and Padmanabhan V (2020). “Developmental programming: Prenatal testosterone excess disrupts pancreatic islet developmental trajectory in female sheep.” Mol Cell Endocrinol: 110950. [DOI] [PMC free article] [PubMed] [Google Scholar]
- Jiang X, Xue Y, Zhou H, Li S, Zhang Z, Hou R, Ding Y and Hu K (2015). “Evaluation of reference gene suitability for quantitative expression analysis by quantitative polymerase chain reaction in the mandibular condyle of sheep.” Mol Med Rep 12(4): 5633–5640. [DOI] [PMC free article] [PubMed] [Google Scholar]
- Jorgensen W, Gam C, Andersen JL, Schjerling P, Scheibye-Knudsen M, Mortensen OH, Grunnet N, Nielsen MO and Quistorff B (2009). “Changed mitochondrial function by pre- and/or postpartum diet alterations in sheep.” Am J Physiol Endocrinol Metab 297(6): E1349–1357. [DOI] [PubMed] [Google Scholar]
- Kershenobich Stalnikowitz D and Weissbrod AB (2003). “Liver fibrosis and inflammation. A review.” Ann Hepatol 2(4): 159–163. [PubMed] [Google Scholar]
- King AJ, Olivier NB, Mohankumar PS, Lee JS, Padmanabhan V and Fink GD (2007). “Hypertension caused by prenatal testosterone excess in female sheep.” Am J Physiol Endocrinol Metab 292(6): E1837–1841. [DOI] [PubMed] [Google Scholar]
- Kokosar M, Benrick A, Perfilyev A, Fornes R, Nilsson E, Maliqueo M, Behre CJ, Sazonova A, Ohlsson C, Ling C and Stener-Victorin E (2016). “Epigenetic and Transcriptional Alterations in Human Adipose Tissue of Polycystic Ovary Syndrome.” Sci Rep 6: 22883. [DOI] [PMC free article] [PubMed] [Google Scholar]
- Law BA, Liao X, Moore KS, Southard A, Roddy P, Ji R, Szulc Z, Bielawska A, Schulze PC and Cowart LA (2018). “Lipotoxic very-long-chain ceramides cause mitochondrial dysfunction, oxidative stress, and cell death in cardiomyocytes.” FASEB J 32(3): 1403–1416. [DOI] [PMC free article] [PubMed] [Google Scholar]
- Lazic M, Aird F, Levine JE and Dunaif A (2011). “Prenatal androgen treatment alters body composition and glucose homeostasis in male rats.” J Endocrinol 208(3): 293–300. [DOI] [PMC free article] [PubMed] [Google Scholar]
- Lee J, Park JS and Roh YS (2019). “Molecular insights into the role of mitochondria in non-alcoholic fatty liver disease.” Arch Pharm Res 42(11): 935–946. [DOI] [PubMed] [Google Scholar]
- Li H, Min Q, Ouyang C, Lee J, He C, Zou MH and Xie Z (2014). “AMPK activation prevents excess nutrient-induced hepatic lipid accumulation by inhibiting mTORC1 signaling and endoplasmic reticulum stress response.” Biochim Biophys Acta 1842(9): 1844–1854. [DOI] [PMC free article] [PubMed] [Google Scholar]
- Li Q, Du J, Feng R, Xu Y, Wang H, Sang Q, Xing Q, Zhao X, Jin L, He L and Wang L (2014). “A possible new mechanism in the pathophysiology of polycystic ovary syndrome (PCOS): the discovery that leukocyte telomere length is strongly associated with PCOS.” J Clin Endocrinol Metab 99(2): E234–240. [DOI] [PubMed] [Google Scholar]
- Liguori I, Russo G, Curcio F, Bulli G, Aran L, Della-Morte D, Gargiulo G, Testa G, Cacciatore F, Bonaduce D and Abete P (2018). “Oxidative stress, aging, and diseases.” Clin Interv Aging 13: 757–772. [DOI] [PMC free article] [PubMed] [Google Scholar]
- Lu C, Cardoso RC, Puttabyatappa M and Padmanabhan V (2016). “Developmental Programming: Prenatal Testosterone Excess and Insulin Signaling Disruptions in Female Sheep.” Biol Reprod 94(5): 113. [DOI] [PMC free article] [PubMed] [Google Scholar]
- Manikkam M, Steckler TL, Welch KB, Inskeep EK and Padmanabhan V (2006). “Fetal programming: prenatal testosterone treatment leads to follicular persistence/luteal defects; partial restoration of ovarian function by cyclic progesterone treatment.” Endocrinology 147(4): 1997–2007. [DOI] [PubMed] [Google Scholar]
- Mansouri A, Gattolliat CH and Asselah T (2018). “Mitochondrial Dysfunction and Signaling in Chronic Liver Diseases.” Gastroenterology 155(3): 629–647. [DOI] [PubMed] [Google Scholar]
- Merhi Z, Kandaraki EA and Diamanti-Kandarakis E (2019). “Implications and Future Perspectives of AGEs in PCOS Pathophysiology.” Trends Endocrinol Metab 30(3): 150–162. [DOI] [PubMed] [Google Scholar]
- Nada SE, Thompson RC and Padmanabhan V (2010). “Developmental programming: differential effects of prenatal testosterone excess on insulin target tissues.” Endocrinology 151(11): 5165–5173. [DOI] [PMC free article] [PubMed] [Google Scholar]
- Nakagawa S and Cuthill IC (2007). “Effect size, confidence interval and statistical significance: a practical guide for biologists.” Biol Rev Camb Philos Soc 82(4): 591–605. [DOI] [PubMed] [Google Scholar]
- Nakajima T, Moriguchi M, Katagishi T, Sekoguchi S, Nishikawa T, Takashima H, Kimura H, Minami M, Itoh Y, Kagawa K, Tani Y and Okanoue T (2006). “Premature telomere shortening and impaired regenerative response in hepatocytes of individuals with NAFLD.” Liver Int 26(1): 23–31. [DOI] [PubMed] [Google Scholar]
- Nakka VP, Prakash-Babu P and Vemuganti R (2016). “Crosstalk Between Endoplasmic Reticulum Stress, Oxidative Stress, and Autophagy: Potential Therapeutic Targets for Acute CNS Injuries.” Mol Neurobiol 53(1): 532–544. [DOI] [PMC free article] [PubMed] [Google Scholar]
- Oikawa S and Kawanishi S (1999). “Site-specific DNA damage at GGG sequence by oxidative stress may accelerate telomere shortening.” FEBS Lett 453(3): 365–368. [DOI] [PubMed] [Google Scholar]
- Padmanabhan V, Cardoso RC and Puttabyatappa M (2016). “Developmental Programming, a Pathway to Disease.” Endocrinology 157(4): 1328–1340. [DOI] [PMC free article] [PubMed] [Google Scholar]
- Padmanabhan V, Sarma HN, Savabieasfahani M, Steckler TL and Veiga-Lopez A (2010). “Developmental reprogramming of reproductive and metabolic dysfunction in sheep: native steroids vs. environmental steroid receptor modulators.” Int J Androl 33(2): 394–404. [DOI] [PMC free article] [PubMed] [Google Scholar]
- Padmanabhan V and Veiga-Lopez A (2013). “Sheep models of polycystic ovary syndrome phenotype.” Mol Cell Endocrinol 373(1–2): 8–20. [DOI] [PMC free article] [PubMed] [Google Scholar]
- Padmanabhan V, Veiga-Lopez A, Abbott D, Recabarren S and Herkimer C (2010). “Developmental programming: impact of prenatal testosterone excess and postnatal weight gain on insulin sensitivity index and transfer of traits to offspring of overweight females.” Endocrinology 151(2): 595–605. [DOI] [PMC free article] [PubMed] [Google Scholar]
- Padmanabhan V, Veiga-Lopez A, Herkimer C, Abi Salloum B, Moeller J, Beckett E and Sreedharan R (2015). “Developmental Programming: Prenatal and Postnatal Androgen Antagonist and Insulin Sensitizer Interventions Prevent Advancement of Puberty and Improve LH Surge Dynamics in Prenatal Testosterone-Treated Sheep.” Endocrinology 156(7): 2678–2692. [DOI] [PMC free article] [PubMed] [Google Scholar]
- Pedroso DC, Miranda-Furtado CL, Kogure GS, Meola J, Okuka M, Silva C, Calado RT, Ferriani RA, Keefe DL and dos Reis RM (2015). “Inflammatory biomarkers and telomere length in women with polycystic ovary syndrome.” Fertil Steril 103(2): 542–547 e542. [DOI] [PubMed] [Google Scholar]
- Pedroso DCC, Santana VP, Donaires FS, Picinato MC, Giorgenon RC, Santana BA, Pimentel RN, Keefe DL, Calado RT, Ferriani RA, Furtado CLM and Reis RM (2020). “Telomere Length and Telomerase Activity in Immature Oocytes and Cumulus Cells of Women with Polycystic Ovary Syndrome.” Reprod Sci 27(6): 1293–1303. [DOI] [PubMed] [Google Scholar]
- Peng G, Li L, Liu Y, Pu J, Zhang S, Yu J, Zhao J and Liu P (2011). “Oleate blocks palmitate-induced abnormal lipid distribution, endoplasmic reticulum expansion and stress, and insulin resistance in skeletal muscle.” Endocrinology 152(6): 2206–2218. [DOI] [PubMed] [Google Scholar]
- Picca A and Lezza AM (2015). “Regulation of mitochondrial biogenesis through TFAM-mitochondrial DNA interactions: Useful insights from aging and calorie restriction studies.” Mitochondrion 25: 67–75. [DOI] [PubMed] [Google Scholar]
- Puttabyatappa M, Andriessen V, Mesquitta M, Zeng L, Pennathur S and Padmanabhan V (2017). “Developmental Programming: Impact of Gestational Steroid and Metabolic Milieus on Mediators of Insulin Sensitivity in Prenatal Testosterone-Treated Female Sheep.” Endocrinology 158(9): 2783–2798. [DOI] [PMC free article] [PubMed] [Google Scholar]
- Puttabyatappa M, Ciarelli JN, Chatoff AG, Singer K and Padmanabhan V (2019). “Developmental programming: Adipose depot-specific changes and thermogenic adipocyte distribution in the female sheep.” Mol Cell Endocrinol 503: 110691. [DOI] [PMC free article] [PubMed] [Google Scholar]
- Puttabyatappa M, Lu C, Martin JD, Chazenbalk G, Dumesic D and Padmanabhan V (2018). “Developmental Programming: Impact of Prenatal Testosterone Excess on Steroidal Machinery and Cell Differentiation Markers in Visceral Adipocytes of Female Sheep.” Reprod Sci 25(7): 1010–1023. [DOI] [PMC free article] [PubMed] [Google Scholar]
- Puttabyatappa M and Padmanabhan V (2017). “Prenatal Testosterone Programming of Insulin Resistance in the Female Sheep.” Adv Exp Med Biol 1043: 575–596. [DOI] [PubMed] [Google Scholar]
- Robinson KE and Shah VH (2020). “Pathogenesis and pathways: nonalcoholic fatty liver disease & alcoholic liver disease.” Transl Gastroenterol Hepatol 5: 49. [DOI] [PMC free article] [PubMed] [Google Scholar]
- Rochlani Y, Pothineni NV and Mehta JL (2015). “Metabolic Syndrome: Does it Differ Between Women and Men?” Cardiovasc Drugs Ther 29(4): 329–338. [DOI] [PubMed] [Google Scholar]
- Roland AV, Nunemaker CS, Keller SR and Moenter SM (2010). “Prenatal androgen exposure programs metabolic dysfunction in female mice.” J Endocrinol 207(2): 213–223. [DOI] [PMC free article] [PubMed] [Google Scholar]
- Salvado L, Palomer X, Barroso E and Vazquez-Carrera M (2015). “Targeting endoplasmic reticulum stress in insulin resistance.” Trends Endocrinol Metab 26(8): 438–448. [DOI] [PubMed] [Google Scholar]
- Schroder M and Sutcliffe L (2010). “Consequences of stress in the secretory pathway: The ER stress response and its role in the metabolic syndrome.” Methods Mol Biol 648: 43–62. [DOI] [PubMed] [Google Scholar]
- Skov V, Glintborg D, Knudsen S, Jensen T, Kruse TA, Tan Q, Brusgaard K, Beck-Nielsen H and Hojlund K (2007). “Reduced expression of nuclear-encoded genes involved in mitochondrial oxidative metabolism in skeletal muscle of insulin-resistant women with polycystic ovary syndrome.” Diabetes 56(9): 2349–2355. [DOI] [PubMed] [Google Scholar]
- Smith P, Steckler TL, Veiga-Lopez A and Padmanabhan V (2009). “Developmental programming: differential effects of prenatal testosterone and dihydrotestosterone on follicular recruitment, depletion of follicular reserve, and ovarian morphology in sheep.” Biol Reprod 80(4): 726–736. [DOI] [PMC free article] [PubMed] [Google Scholar]
- Suk KT and Kim DJ (2015). “Staging of liver fibrosis or cirrhosis: The role of hepatic venous pressure gradient measurement.” World J Hepatol 7(3): 607–615. [DOI] [PMC free article] [PubMed] [Google Scholar]
- Tarry-Adkins JL and Ozanne SE (2018). “Telomere Length Analysis: A Tool for Dissecting Aging Mechanisms in Developmental Programming.” Methods Mol Biol 1735: 351–363. [DOI] [PubMed] [Google Scholar]
- Treidel LA, Whitley BN, Benowitz-Fredericks ZM and Haussmann MF (2013). “Prenatal exposure to testosterone impairs oxidative damage repair efficiency in the domestic chicken (Gallus gallus).” Biol Lett 9(5): 20130684. [DOI] [PMC free article] [PubMed] [Google Scholar]
- Veiga-Lopez A, Moeller J, Patel D, Ye W, Pease A, Kinns J and Padmanabhan V (2013). “Developmental programming: impact of prenatal testosterone excess on insulin sensitivity, adiposity, and free fatty acid profile in postpubertal female sheep.” Endocrinology 154(5): 1731–1742. [DOI] [PMC free article] [PubMed] [Google Scholar]
- Victorelli S and Passos JF (2017). “Telomeres and Cell Senescence - Size Matters Not.” EBioMedicine 21: 14–20. [DOI] [PMC free article] [PubMed] [Google Scholar]
- Vorachek WR, Hugejiletu, Bobe G and Hall JA (2013). “Reference gene selection for quantitative PCR studies in sheep neutrophils.” Int J Mol Sci 14(6): 11484–11495. [DOI] [PMC free article] [PubMed] [Google Scholar]
- Wallace DC (2005). “A mitochondrial paradigm of metabolic and degenerative diseases, aging, and cancer: a dawn for evolutionary medicine.” Annu Rev Genet 39: 359–407. [DOI] [PMC free article] [PubMed] [Google Scholar]
- Wang CH, Wu SB, Wu YT and Wei YH (2013). “Oxidative stress response elicited by mitochondrial dysfunction: implication in the pathophysiology of aging.” Exp Biol Med (Maywood) 238(5): 450–460. [DOI] [PubMed] [Google Scholar]
- Wang D, Wei Y and Pagliassotti MJ (2006). “Saturated fatty acids promote endoplasmic reticulum stress and liver injury in rats with hepatic steatosis.” Endocrinology 147(2): 943–951. [DOI] [PubMed] [Google Scholar]
- Xia SW, Wang ZM, Sun SM, Su Y, Li ZH, Shao JJ, Tan SZ, Chen AP, Wang SJ, Zhang ZL, Zhang F and Zheng SZ (2020). “Endoplasmic reticulum stress and protein degradation in chronic liver disease.” Pharmacol Res: 105218. [DOI] [PubMed] [Google Scholar]
- Zeng X, Huang Q, Long SL, Zhong Q and Mo Z (2020). “Mitochondrial Dysfunction in Polycystic Ovary Syndrome.” DNA Cell Biol 39(8): 1401–1409. [DOI] [PubMed] [Google Scholar]
- Zhao RZ, Jiang S, Zhang L and Yu ZB (2019). “Mitochondrial electron transport chain, ROS generation and uncoupling (Review).” Int J Mol Med 44(1): 3–15. [DOI] [PMC free article] [PubMed] [Google Scholar]
- Zhu C, Tabas I, Schwabe RF and Pajvani UB (2020). “Maladaptive regeneration - the reawakening of developmental pathways in NASH and fibrosis.” Nat Rev Gastroenterol Hepatol. [DOI] [PMC free article] [PubMed] [Google Scholar]
Associated Data
This section collects any data citations, data availability statements, or supplementary materials included in this article.