

SUMMARY
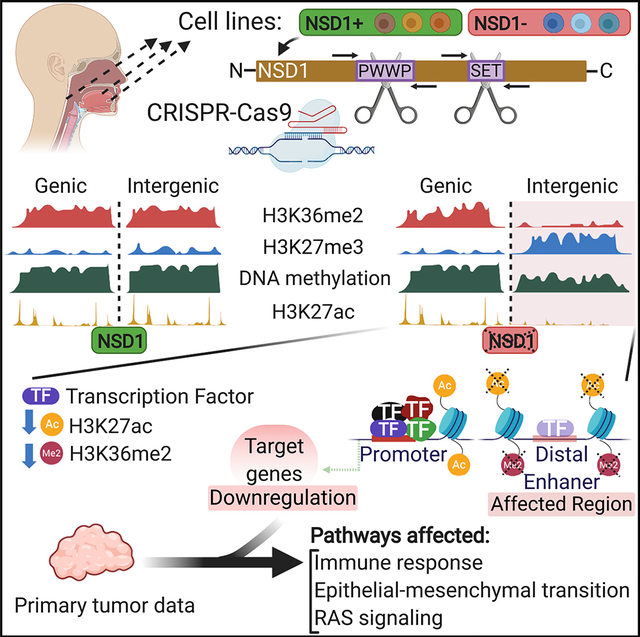
Chromatin dysregulation has emerged as an important mechanism of oncogenesis. To develop targeted treatments, it is important to understand the transcriptomic consequences of mutations in chromatin modifier genes. Recently, mutations in the histone methyltransferase gene nuclear receptor binding SET domain protein 1 (NSD1) have been identified in a subset of common and deadly head and neck squamous cell carcinomas (HNSCCs). Here, we use genome-wide approaches and genome editing to dissect the downstream effects of loss of NSD1 in HNSCC. We demonstrate that NSD1 mutations are responsible for loss of intergenic H3K36me2 domains, followed by loss of DNA methylation and gain of H3K27me3 in the affected genomic regions. In addition, those regions are enriched in cis-regulatory elements, and subsequent loss of H3K27ac correlates with reduced expression of their target genes. Our analysis identifies genes and pathways affected by the loss of NSD1 and paves the way to further understanding the interplay among chromatin modifications in cancer.
Graphical Abstract
In brief
Farhangdoost et al. use genome editing and TCGA primary tumor data to provide a link between NSD1 loss, chromatin and regulatory landscape, gene expression, and molecular characteristics of this tumor subtype. Their study extends the understanding of tumorigenic mechanisms underlying head and neck cancers with mutations in NSD1.
INTRODUCTION
Head and neck squamous cell carcinomas (HNSCCs) are very common and deadly cancers that can develop in the oropharynx, hypopharynx, larynx, nasopharynx, and oral cavity (Cancer Genome Atlas Network, 2015; Majchrzak et al., 2014). These anatomically and genetically heterogeneous tumors (Majchrzak et al., 2014; Staff, 2015) can be induced either through some behavioral risk factors—such as tobacco smoking, excessive alcohol consumption, or insufficient oral hygiene (Chang et al., 2013; Farquhar et al., 2017; Hashim et al., 2016; Vann et al., 2010)—or through human papillomavirus (HPV) (Gillison et al., 2000), and are currently classified into HPV (−) and HPV (+) groups (Fleming et al., 2019). HPV (−) tumors constitute around 80%–95% of all HNSCCs (Zaravinos, 2014). The best currently available treatments have shown promising response in HPV (+) patients but have been less successful in HPV (−) cancers (Ang et al., 2010; Baxi et al., 2012; Chung and Gillison, 2009; Fakhry et al., 2008; Pan et al., 2019). Thus, it is of great importance to understand the etiology of HPV (−) HNSCC tumors in order to develop more effective targeted therapies.
Recently, mutations in chromatin modifier genes, particularly the methyltransferase nuclear receptor binding SET domain protein 1 (NSD1), have been implicated in HNSCC pathogenesis (Cancer Genome Atlas Network, 2015; Seiwert et al., 2015). Subsequently, our group has identified H3K36M—lysine to methionine mutations in histone H3 at the residue 36—mutations and demonstrated that NSD1 and H3K36M mutant (MT) HNSCCs form a distinct subgroup, characterized by specific DNA methylation (DNAme) patterns (Papillon-Cavanagh et al., 2017). NSD1 is a histone lysine methyltransferase that catalyzes mono- and di-methylation of histone H3 at lysine 36 (H3K36me2) (Brennan et al., 2017; Papillon-Cavanagh et al., 2017; Qiao et al., 2011; Tatton-Brown and Rahman, 2013). In addition, it may act as a transcriptional co-factor, responsible for activating or repressing different genes (Huang et al., 1998). Mutations in other genes that encode H3K36 methyltransferases, such as NSD2 and SETD2, have not been frequently identified in HNSCC (Papillon-Cavanagh et al., 2017), and it is not clear whether they contribute to this disease. Recent tumor-immune profiling of HNSCC patient samples has reported an association between NSD1 mutation and reduced immune infiltration (Brennan et al., 2017). In addition, it has been shown that HPV (−) tumors with NSD1-truncating mutations exhibit better treatment responses when targeted with cisplatin and carboplatin (chemotherapy based on platinum) compared to those lacking these mutations (Bui et al., 2018; Pan et al., 2019). Thus, NSD1, its function, and the dysregulation it causes at the genetic and/or epigenetic (histone modifications and DNA methylation) level in HPV (−) HNSCC are of great importance for understanding the underlying mechanisms of tumorigenesis for improving the treatment responses.
We and others have further argued that the common mechanism underlying tumorigenicity in the H3K36me-dysregulated tumors is a reduction in H3K36me2 levels, followed by a global reduction in DNA methylation (Cancer Genome Atlas Network, 2015; Choufani et al., 2015; Gevaert et al., 2015; Papillon-Cavanagh et al., 2017). These observations, so far, have been based on primary tumor data, bulk quantification of epigenetic modifications, or data obtained from genetic manipulation of mouse embryonic stem cells (Papillon-Cavanagh et al., 2017; Weinberg et al., 2019).
Here, we use quantitative mass spectrometry of histone post-translational modifications (PTMs), genome-wide chromatin immunoprecipitation sequencing (ChIP-seq), and whole-genome bisulfite sequencing (WGBS) to finely characterize the differences in epigenetic characteristics of NSD1-wild-type (NSD1-WT) and NSD1-MT HNSCC cell lines. Next, we utilized CRISPR-Cas9 genome editing to inactivate NSD1 in several independent cell lines and showed that, in an isogenic context, the ablation of NSD1 is sufficient to recapitulate the epigenetic patterns that were observed in the patient-derived material. Furthermore, we carried out RNA sequencing and characterized the transcriptional impact of NSD1 loss in order to link epigenetic programming with functional outputs. We directly demonstrate the connection between NSD1, H3K36me2, polycomb repressive complex 2 (PRC2)-mediated H3K27me3, and DNA methylation modifications in HNSCC. We also link the depletion of intergenic H3K36me2 with reduced activity of cis-regulatory elements—as profiled by the levels of H3K27ac—and reduced levels of expression of target genes.
RESULTS
Epigenomic characterization of NSD1 WT and MT HNSCC cell lines
We have previously shown that H3K36M and NSD1 mutations in HNSCCs are associated with low global levels of H3K36me2 (Papillon-Cavanagh et al., 2017). More recently, we provided evidence that NSD1 MT HNSCC samples are specifically characterized by low intergenic levels of H3K36me2 (Weinberg et al., 2019). To confirm those results in a larger number of samples and characterize additional epigenetic marks, we examined three NSD1-WT (Cal27, FaDu, and Detroit562) and three NSD1-MT (SKN3, SCC4, and BICR78) patient-derived HNSCC cell lines (Table S1). We first used western blot to confirm the presence and expression of NSD1 and to determine the baseline levels of NSD1 expression variability (Figure S1C). Mass spectrometry analysis demonstrates a clear difference in the global levels of H3K36me2 when comparing the mean of NSD1-WT with the mean of NSD1-MT samples (Figure 1A; Data S1). Visualization of H3K36me2 ChIP-seq tracks in representative regions illustrates that, in NSD1-MT cell lines, this mark is significantly reduced at the intergenic regions adjacent to genic regions (Figure 1B). This intergenic depletion of H3K36me2 can be generalized to a genome-wide scale using heatmaps and boxplots (Figures 1C and 1D). We note that there is significant variability across NSD1-WT cell lines with respect to the distribution of intergenic H3K36me2 (Figure 1C): in FaDu, nearly all intergenic regions are marked with H3K36me2, and as a result, intergenic levels are higher compared to genic, although Cal27 has the least pronounced intergenic H3K36me2 domains. This is further clarified with each cell line being illustrated individually (Figure S1A). Those differences are likely to be an effect of the cell of origin, presence of other oncogenic mutations, and relative activity levels of epigenetic modifier enzymes. However, our analysis shows a consistent and nearly total lack of intergenic H3K36me2 in all NSD1-MT cell lines, in contrast to genic levels that remain comparable to NSD1-WT lines.
Figure 1. Epigenomic characterization of NSD1-WT and MT HNSCC cell lines.
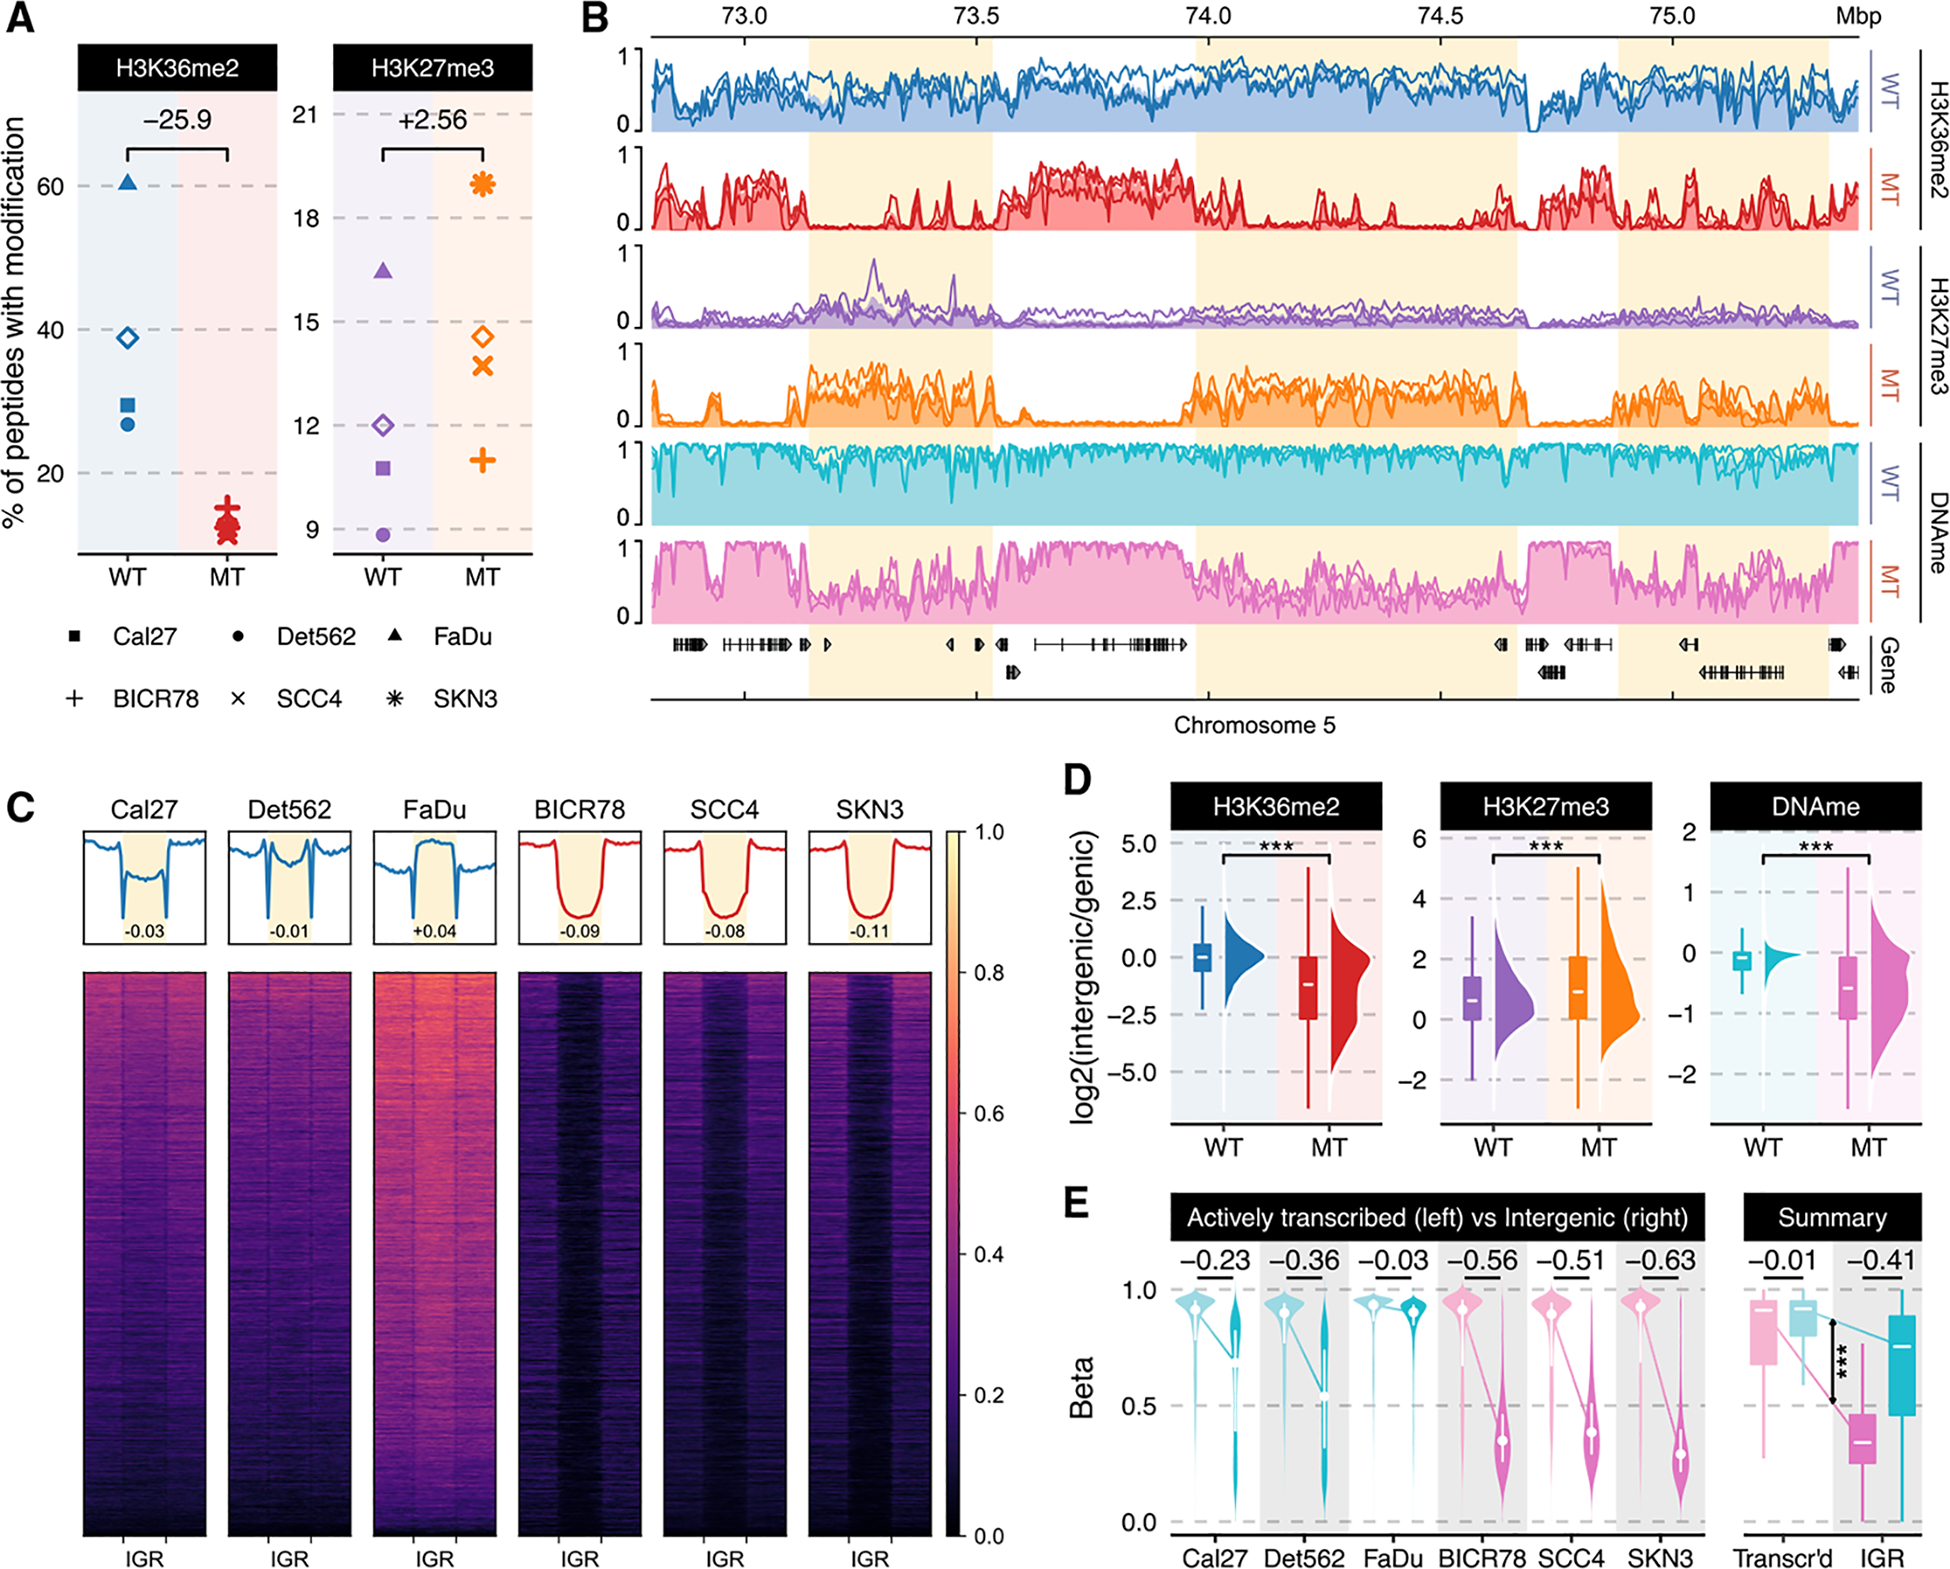
(A) Genome-wide prevalence of modifications based on mass spectrometry; diamonds represent within-condition averages; p values obtained using Welch’s t test: H3K36me2 (p = 0.07) and H3K27me3 (p = 0.240).
(B) Genome-browser tracks displaying individual samples as lines and condition averages as area plots in a lighter shade; ChIP-seq signals shown are mass spectrometry (MS)-normalized logCPM and beta values are used for WGBS; regions of noticeable difference are highlighted.
(C) Heatmaps showing H3K36me2 (MS-normalized logCPM (log counts per million)) enrichment patterns ± 20 kb flanking intergenic regions (IGRs); n = 10,630. Numbers displayed at the bottom of aggregate plots correspond to the intergenic/genic ratio where transcription start sites (TSS)/transcription end sites (TES) and outer edges are excluded.
(D) Relative enrichment of signal within intergenic regions over those of flanking genes; CPM values are used for ChIP-seq and beta values for WGBS; ***Wilcoxon rank sum test p < 1e-5. In the box plots, the lower and upper hinge correspond to the first and third quartile; the upper whiskers extend to the largest value ≤ 1.5 * interquartile range (IQR) and vice versa for the lower whiskers.
(E) Distribution of DNA methylation beta values within actively transcribed genes (zFPKM > −3; Hart et al., 2013) compared against those in intergenic regions. *** represents p value < 1e-5 based on the difference-in-difference estimator of differential methylation between genic and intergenic regions. In the violin plots, the white dots correspond to the median and the lines span the IQR. In the box plots, the lower and upper hinge correspond to the first and third quartile; the upper whiskers extend to the largest value ≤ 1.5 * IQR and vice versa for the lower whiskers.
We have previously observed that NSD1 and H3K36M MT HNSCC tumors are hypomethylated at the DNA level (Papillon-Cavanagh et al., 2017) and, using mouse cell line models, proposed that this hypomethylation is mechanistically linked to the decrease in intergenic H3K36me2 via reduced recruitment of the de novo DNA methyltransferase, DNMT3A (Weinberg et al., 2019). Our extended analysis here clearly indicates that the decrease of intergenic H3K36me2 corresponds to a significant decrease in intergenic DNA methylation in all three NSD1-MT, as compared to NSD1-WT HNSCC cell lines (Figures 1B and 1E). Concurrently, DNA methylation levels within actively transcribed genes remain comparable across all profiled cell lines, irrespective of their NSD1 status. Again, we note considerable variability across cell lines, with FaDu, which has the highest levels of global and intergenic H3K36me2, possessing a globally hypermethylated genome.
Finally, we examined the silencing mark H3K27me3 (Streubel et al., 2018), because its levels and distribution have been shown to be negatively correlated with H3K36me2. Mass spectrometry shows an elevated level of H3K27me3 in the NSD1-MT cell lines (Figure 1A). Through ChIP-seq of H3K27me3, we observe that it is the intergenic regions depleted of H3K36me2 in all 3 NSD1-MT samples that specifically exhibit a corresponding increase in H3K27me3, corroborating the antagonistic relation between these two marks (Figures 1D and S1B). Overall, our observations demonstrate that lack of intergenic H3K36me2 that characterizes NSD1-MT HNSCC samples is associated with decreased intergenic DNA methylation levels and increased H3K27me3 levels in HPV (−) HNSCC.
Knockout of NSD1 is sufficient to recapitulate the decrease in intergenic H3K36me2 and confirms the relationship with DNA methylation and H3K27me3
In order to demonstrate that our observations in patient-derived material are a direct consequence of the presence or absence of NSD1 mutations, we used the CRISPR-Cas9 system to edit the three NSD1-WT HNSCC cell lines and generate several independent NSD1-knockout (NSD1-KO) clonal cultures per cell line. This approach ensures an isogenic context; that is, we can isolate the effect of NSD1 by deleting it on an otherwise unaltered genetic background. Using three different cell lines generalizes the results across genetic backgrounds. Propagation of multiple independent clones for each parental line minimizes the possible off-target and clone-specific effects. We targeted the SET [Su(-var)3–9, enhancer-of-zeste and trithorax] domain and PWWP (proline–tryptophan–tryptophan–proline) domain of NSD1 because these two domains play crucial roles in catalyzing the deposition of methyl groups to H3K36 (Herz et al., 2013) and reading the methylated lysines on histone H3 (Rona et al., 2016), respectively. Thus, disruption of either or both of these domains by CRISPR-Cas9 is likely to compromise the function of NSD1 as a histone methyltransferase. We successfully generated three HNSCC isogenic NSD1-KO clones in Detroit562, two in Cal27, and one in the FaDu cell line. The editing was confirmed by sequencing (MiSeq) of the regions surrounding the target sites (Figure S2A; Table S2), and the absence of the protein was confirmed by western blots of NSD1 (Figure S1C). Mass spectrometry and ChIP-seq were used to quantify genome-wide levels and distribution of H3K36me2 and H3K27me3 in NSD1-KO HNSCC isogenic cell lines and all their replicate clones compared to their parental cell lines. Similar to our observations comparing primary NSD1-MT and NSD1-WT HPV (−) HNSCC cell lines, NSD1-KO isogenic cell lines show a global reduction of H3K36me2 and an increase in H3K27me3 levels (Figure 2A; Data S1), most prominently in intergenic regions (Figures 2B and S1A). Using mass-spectrometry-normalized ChIP-seq data, we emphasized the pronounced pattern of H3K36me2 depletion and H3K27me3 enrichment at intergenic regions (Figures 2C and S1B), the degree of which can be further quantified by comparing intergenic enrichment levels against flanking genes (Figure S1D). We next profiled the genome-wide DNA methylation changes resulting from NSD1-KO. DNA methylation was decreased predominantly in intergenic regions, and this reduction was particularly pronounced in regions that lost H3K36me2 (Figure 2D). First, we note that the degree of DNAme reduction varied across cell lines: FaDu, which in the parental cell lines had a globally hypermethylated genome, exhibited the highest (8.1%), Cal27 showed an intermediate (3.7%), and Detroit562 showed the lowest (2.3%) DNAme reduction in regions losing H3K36me2 (Figure 2D). Although the results are consistent with the previous observation that H3K36me2 recruits active DNA methyltransferases (Weinberg et al., 2019), it also demonstrates that other factors, which are likely to be dependent on the genetic and epigenetic states of the parental cells, also play important roles. In the case of DNA methylation, those may include the relative importance of maintenance, versus de novo, DNA methyltransferases (Jin et al., 2011) or levels of relevant metabolites, such as S-adenosyl methionine(-SAM) (Serefidou et al., 2019). Second, we observe that, within active genes, DNA methylation levels remain nearly unchanged in NSD1-KO and actually exhibit a slight increase (Figure 2D). This suggests that the presence of H3K36 methylation within actively transcribed genes is still sufficient to maintain DNAme in those regions. Finally, we find that the reduction in DNAme, although statistically significant and consistent across NSD1-KO cell lines and individual clones, is considerably smaller than the difference observed between NSD1-WT and NSD1-MT patient-derived cell lines. Overall, the extent to which NSD1-KOs recapitulate the epigenetic characteristics of NSD1-MT cell lines is highest for H3K36me2, intermediate for H3K27me3, and lowest for DNAme (Figure 2E). To validate the reproducibility across several independent KOs generated from different cell lines, we specifically examined the differential levels of H3K36me2, H3K27me3, and DNA methylation for parental (WT) versus PA-KO and WT versus MT comparisons. We expectedly observe in both cases a strong correlation between H3K36me2 and DNAme, which contrasted by the antagonism between H3K36me2 and H3K27me3 (Figure S2B). Moreover, we find that, despite notable variation among different cell lines, KOs of the same cell lines are highly correlated—indicating a high degree of consistency in terms of the effect exerted by NSD1-KO among all three epigenetic modifications (Figure S2C).
Figure 2. Epigenomic characterization of NSD1-WT and KO HNSCC cell lines.
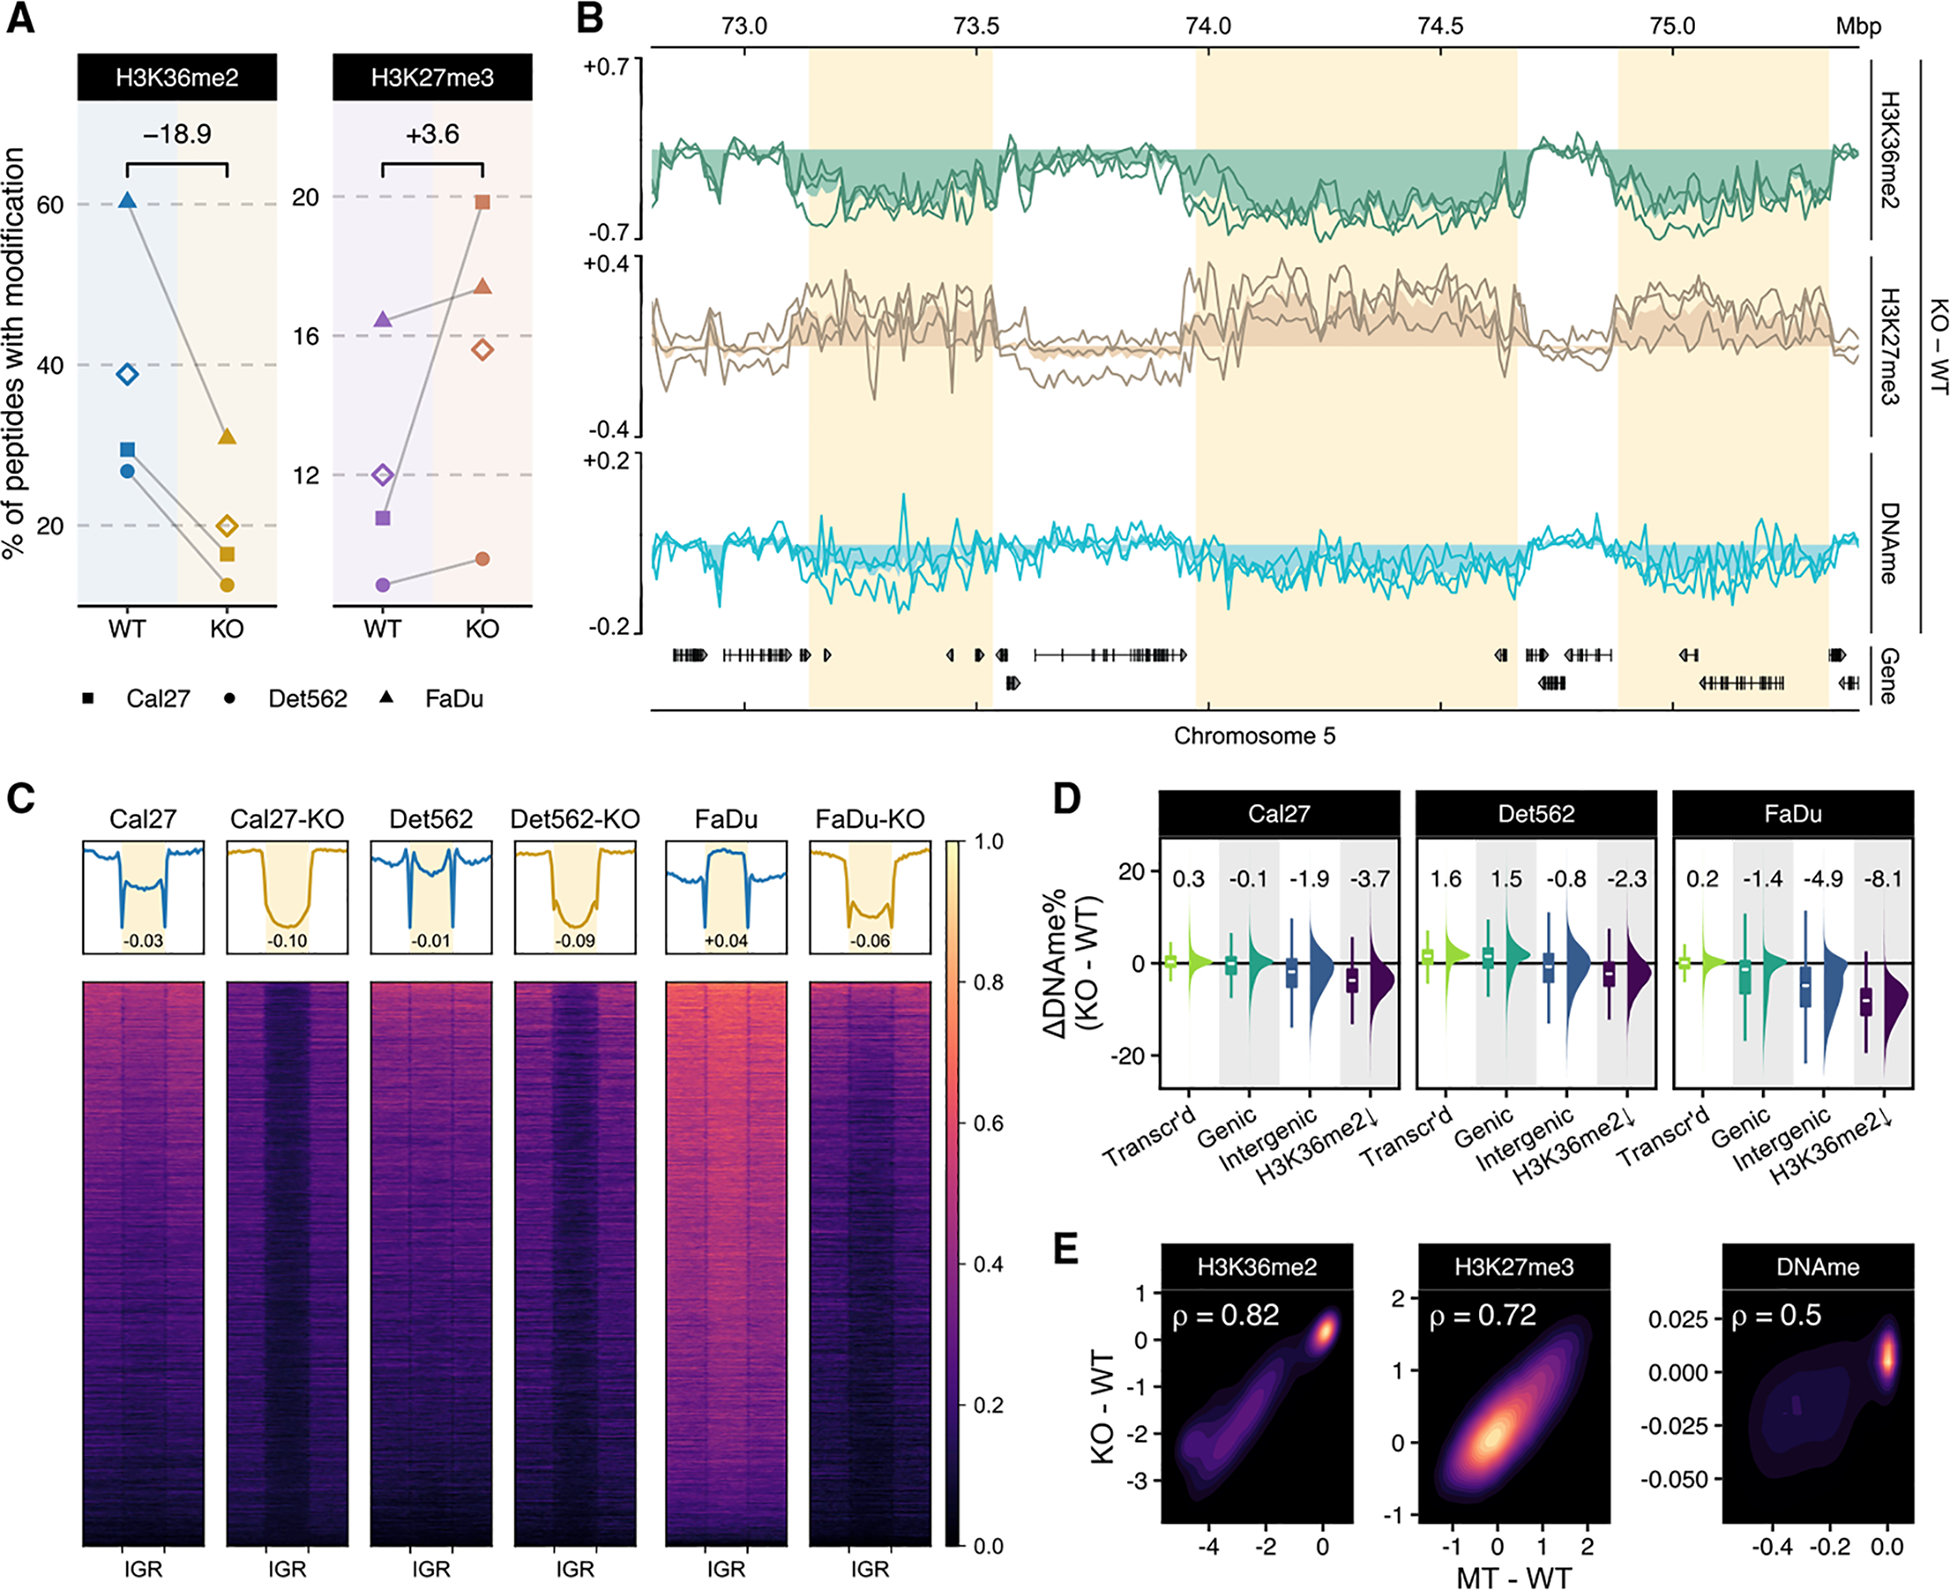
(A) Genome-wide prevalence of modifications based on mass spectrometry; diamonds represent within-condition averages; p values obtained using Welch’s t test: H3K36me2 p = 0.04; H3K27me3 p = 0.16. In this plot and all the following ones, Cal27-KO corresponds to replicate 1, Det562-KO to replicate 2, and FaDu-KO to replicate 1, unless otherwise specified.
(B) Genome-browser tracks displaying individual cell-line differences (KO-PA) as lines and condition averages as area plots in a lighter shade; ChIP-seq signals shown are MS-normalized logCPM and beta values are used for WGBS; regions of noticeable difference in Figure 1B are highlighted.
(C) Heatmaps showing H3K36me2 enrichment patterns centered on IGRs; n = 10,630. Numbers displayed at the bottom of aggregate plots correspond to the intergenic/genic ratio where TSS/TES and outer edges are excluded.
(D) Distribution of differential beta values within actively transcribed genes, all genes, intergenic regions, and regions depleted of H3K36me2 (corresponding to regions defined in Figure 3A as “cluster B”); median values are shown at the top. For the boxplots, the lower and upper hinge correspond to the first and third quartile; the upper whiskers extend to the largest value ≤ 1.5 * IQR and vice versa for the lower whiskers.
(E) Spearman correlation of differential enrichment between NSD1-WT versus KO and WT versus MT.
Loss of NSD1 preferentially impacts intergenic regulatory elements
It is of paramount interest to understand the downstream functional consequences of the epigenetic remodeling from NSD1’s deletion. To identify and further characterize the genomic compartments that exhibit the highest loss of H3K36me2, we subdivided the genome into 10-kb bins and compared each parental NSD1-WT line with its respective NSD1-KO clones (Figures 3A and S3A), showing that H3K36me2 profiles of genomic bins subdivide into three distinct clusters. In particular, here, we consider specifically the bins that are consistently assigned the same cluster label for all WT-KO pairs (Figure S3B). The lower left cluster (A) corresponds to regions with negligible levels of H3K36me2 in both WT and KO. The upper right cluster (C) contains regions that maintain high H3K36me2 levels under both conditions; those regions are predominantly genic (color coded in blue). The lower right quadrant (cluster B) represents mostly intergenic regions (color coded red) with high initial levels of H3K36me2 in the parental lines and low levels in the KO. Examination of gene expression data revealed that the few genes overlapping cluster B bins were lowly expressed across all samples and thus resemble intergenic regions at the transcriptional level (Figure S3D). We used genomic element annotations (Ensembl Regulatory Build; Yates et al., 2020) and carried out enrichment analysis to compare the regions affected to those not affected by the loss of H3K36me2. Among the strongest observed functional enrichment categories in H3K36me2 regions (cluster B) were cis-regulatory elements (CREs) (Zerbino et al., 2015): promoter-flanking regions and enhancers (Figure 3B). In contrast, we note that bins in cluster A, the low-invariant H3K36me2 regions, were only associated with the broadly defined intergenic classification and did not exhibit enrichment of any annotated regulatory categories. We also observed enrichment in similar categories when using the original bin labels for each WT-KO pair prior to taking the intersect to derive consensus region sets (Figure S3C). The reduction of H3K36me2 at the CREs was accompanied by a corresponding decrease in DNA methylation and an increase in the silencing mark H3K27me3 (Figure 3C). However, the increase in H3K27me3 appeared to be much more focused, as seen from the narrower peak width, suggesting that the gain of H3K27me3 is specific to these elements rather than across the entire region experiencing a loss of H3K36me2. Finally, the CREs located in the regions depleted of H3K36me2 experience a sharp reduction, which is highly specific to the location of the CRE, of the active chromatin mark H3K27ac (Figure 3C). These results suggest that intergenic regions that are affected by the deletion of NSD1 and subsequent loss of H3K36me2 exhibit a reduced regulatory potential. Although mass spectrometry shows that global levels of H3K27ac appear to increase between NSD1-WT and NSD1-KO (Figure S4A; Data S1), focusing on bins that specifically lose H3K36me2 in NSD1-KO cells (cluster B), we observed almost exclusively peaks with reduced H3K27ac binding (Figure 3D). Irrespective of H3K36me2 changes, peaks that gain H3K27ac in NSD1-KO showed a genomic distribution resembling the set of all consensus peaks, whereas those with reduced intensities were preferentially located in distal intergenic regions (Figure 3E). Using transcription start sites (TSS) as a reference point, we reach a similar conclusion, finding that downregulated H3K27ac peaks are preferentially located away from the TSS (Figure S4B).
Figure 3. Loss of NSD1 preferentially impacts distal intergenic cis-regulatory elements.
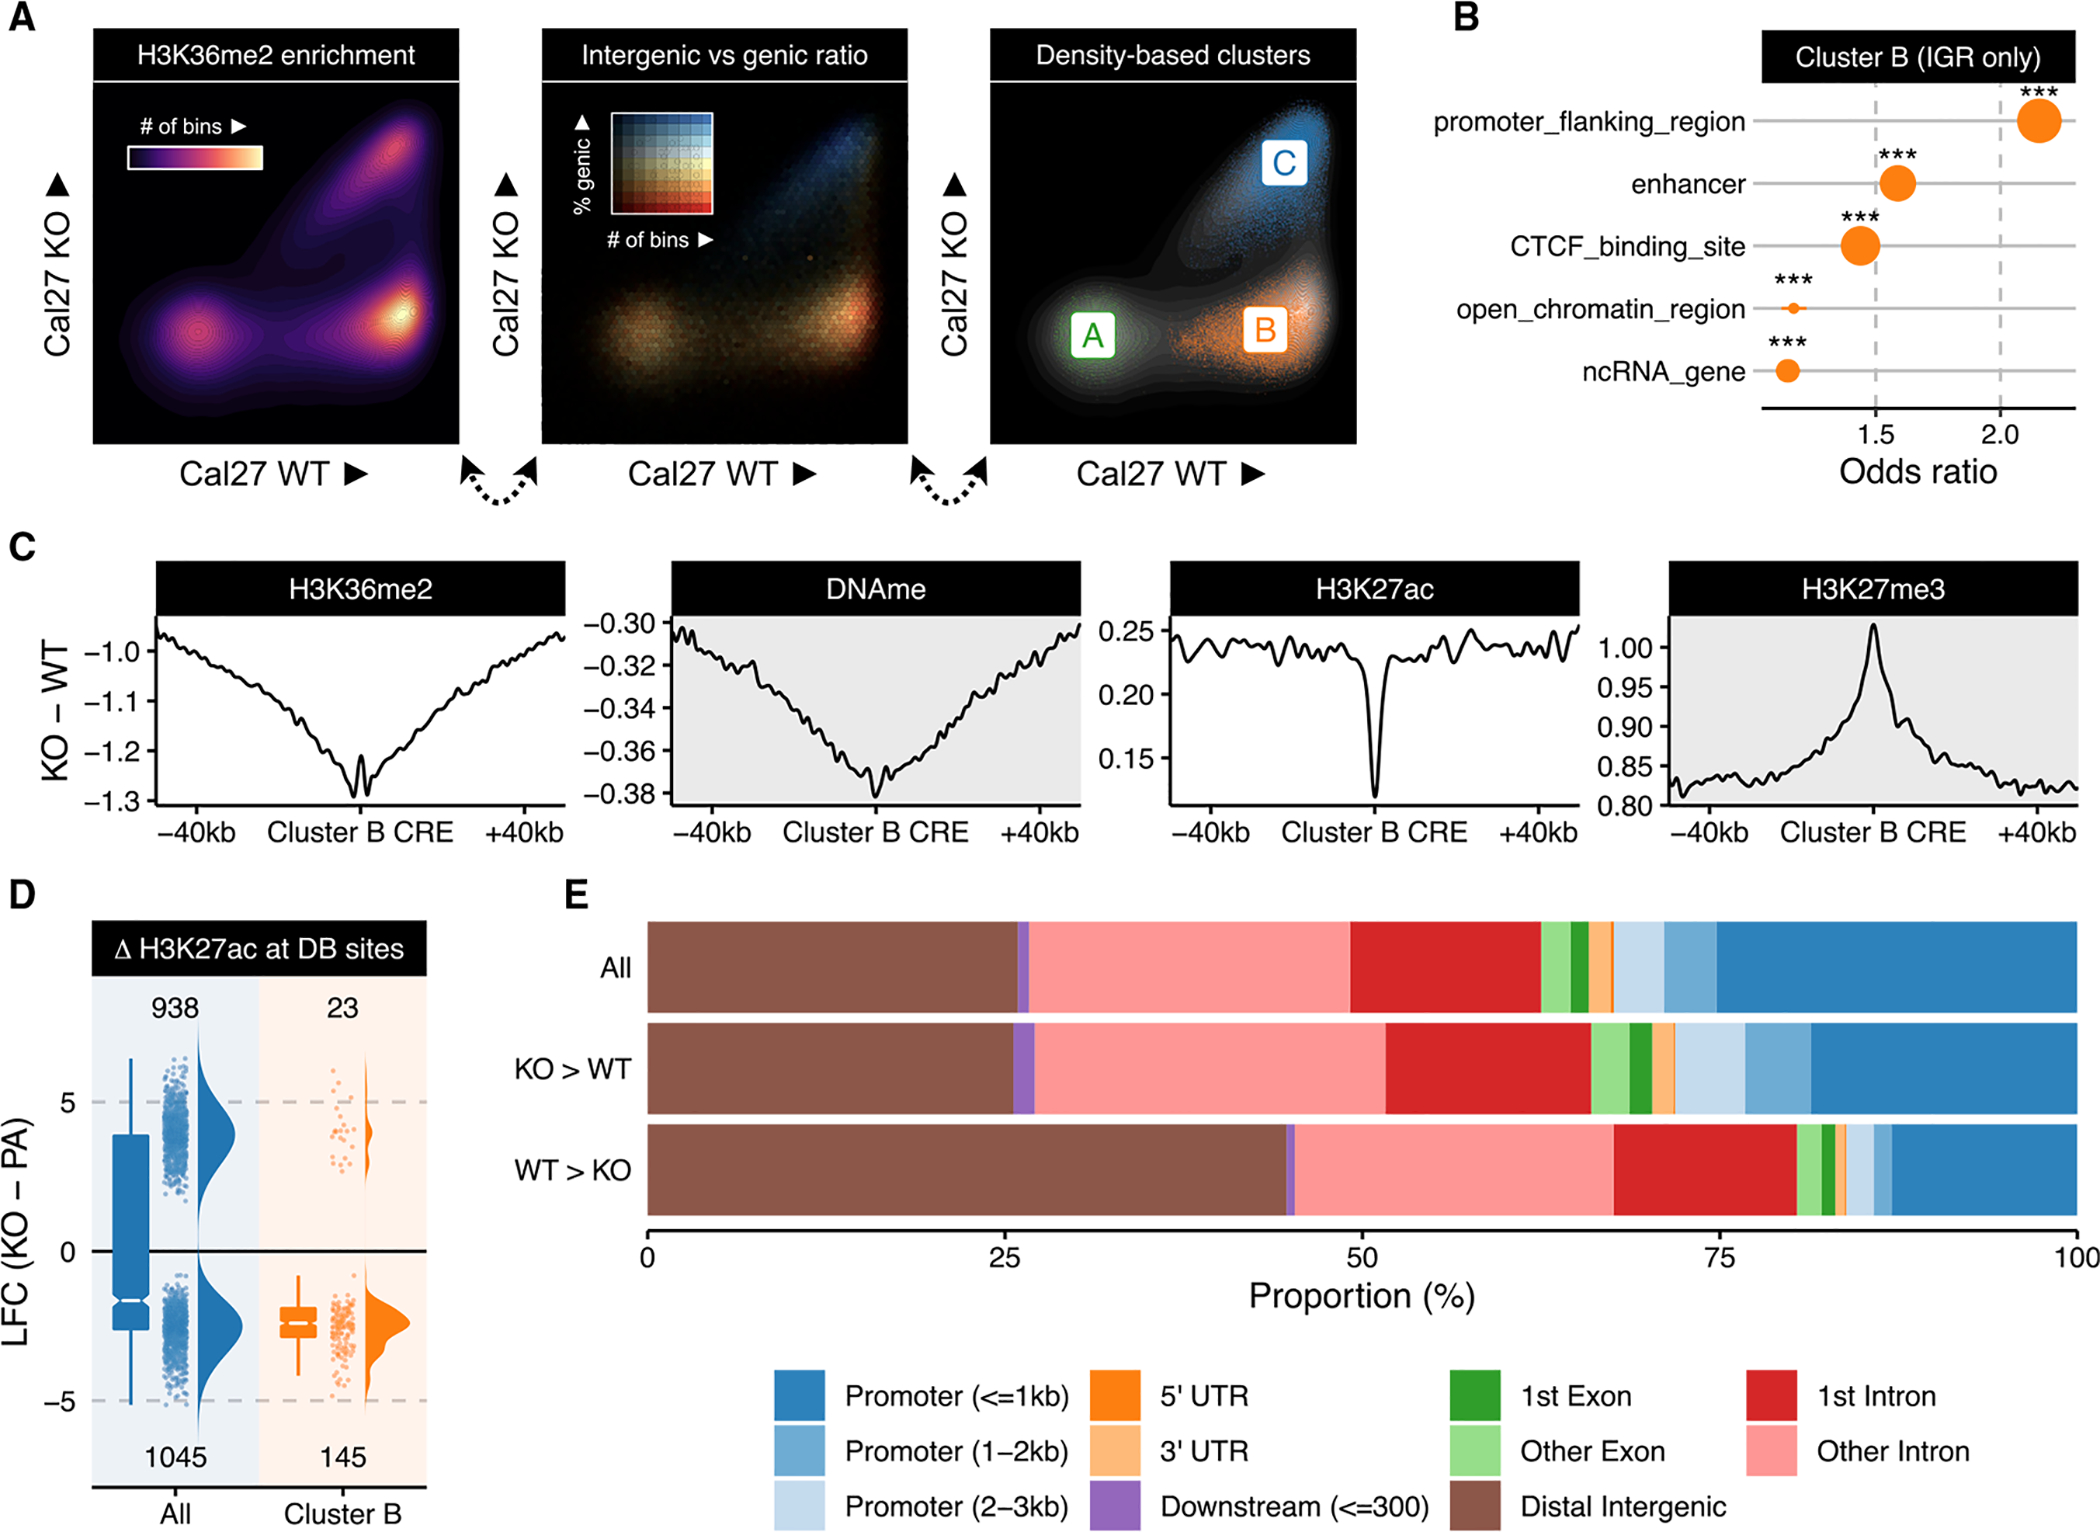
(A) Scatterplots of H3K36me2 enrichment (10-kb resolution) comparing a representative WT parental sample (Cal27) against its NSD1-KO counterpart (replicate 1; see also Figure S3A for other cell lines).
(B) Overlap enrichment result of Ensembl annotations with bins consistently labeled as cluster B (i.e., identified as B in all three paired WT versus KO comparisons). Stratification is applied to only focus on intergenic regions to avoid spurious associations to annotations confounded by their predominantly intergenic localization. The size of the dots corresponds to number of bins overlapping the corresponding annotation. *** represents p-value < 1e-5 based on Fisher’s exact test of bins overlapping a specific class of annotated regions versus a background of all non-quiescent bins, meaning >10 reads in at least one mark in one sample.
(C) Aggregate plots of differential signal enrichment centered around CREs overlapping (n = 5,193) consistent cluster B bins. Values are averaged across all three WT versus KO comparisons.
(D) Log fold change of H3K27ac normalized enrichment values comparing all differentially bound sites to those overlapping consistent cluster B bins. For the box plots, the lower and upper hinge correspond to the first and third quartile; the upper whiskers extend to the largest value ≤ 1.5 * IQR and vice versa for the lower whiskers.
(E) Distribution of genomic compartments overlapping various subsets of H3K27ac peaks categorized by differential binding status.
Loss of H3K36me2 domains and enhancer H3K27ac affects the expression of target genes
We next investigated how the loss of NSD1-mediated intergenic H3K36me2 affects transcriptional activity, by comparing gene expression between the NSD1-WT and NSD1-KO cells. Overall, we did not find a large imbalance between upregulated and downregulated genes, with slightly more genes significantly increasing (179) than decreasing (145) expression in NSD1-KO lines (Figure S4D). Epigenetic dysregulation generally results in massive transcriptional changes (Brettingham-Moore et al., 2015; Enríquez, 2016; Jones and Baylin, 2002), many of which may represent downstream effects and not be directly related to the effect of the primary insult. Some of these indirect effects can arise from NSD1-mediated H3K36me2’s various roles in recruiting de novo DNA methyltransferases or demarcating the propagation of H3K27me3 domains, because perturbations to these processes can lead to alterations far removed from the original site of H3K36me2 loss as the other marks become redistributed through a cascade of interactions. But based on our analysis of H3K27 acetylation and its intimate association with local H3K36me2 dynamics, we hypothesized that the decrease of gene expression activity can be primarily attributed to the modulation of CREs’ epigenetic state. Hence, we next investigated the specific effect of H3K36me2 loss at enhancers on the expression of their predicted target genes. We used a high-confidence set (“double-elite”) of pairings obtained from GeneHancer (Fishilevich et al., 2017) to associate distal epigenetic changes to putative target genes. By comparison to all differentially expressed genes (DEGs), those targeted by CREs depleted of H3K36me2 are mostly downregulated in NSD1-KO (43 down versus 6 up; Figure 4A). We expanded the analysis by directly considering the H3K27ac states of all annotated enhancers and subdividing them into three subsets: significantly increased; not significantly changed; and significantly decreased in NSD1-KO. We found that genes paired with enhancers exhibiting reduced acetylation undergo a relatively large decrease in expression (median log fold-change [LFC] = −0.695), as compared to the upregulation of genes whose enhancers increase in acetylation (median LFC = 0.233; Figure 4B). We conclude that the reduction in enhancer activity has a dominant effect on the regulatory landscape of NSD1-KO cells, in comparison to the non-H3K36me2-associated increase in acetylation.
Figure 4. Loss of H3K36me2 domains and enhancer H3K27ac affects expression of target genes.
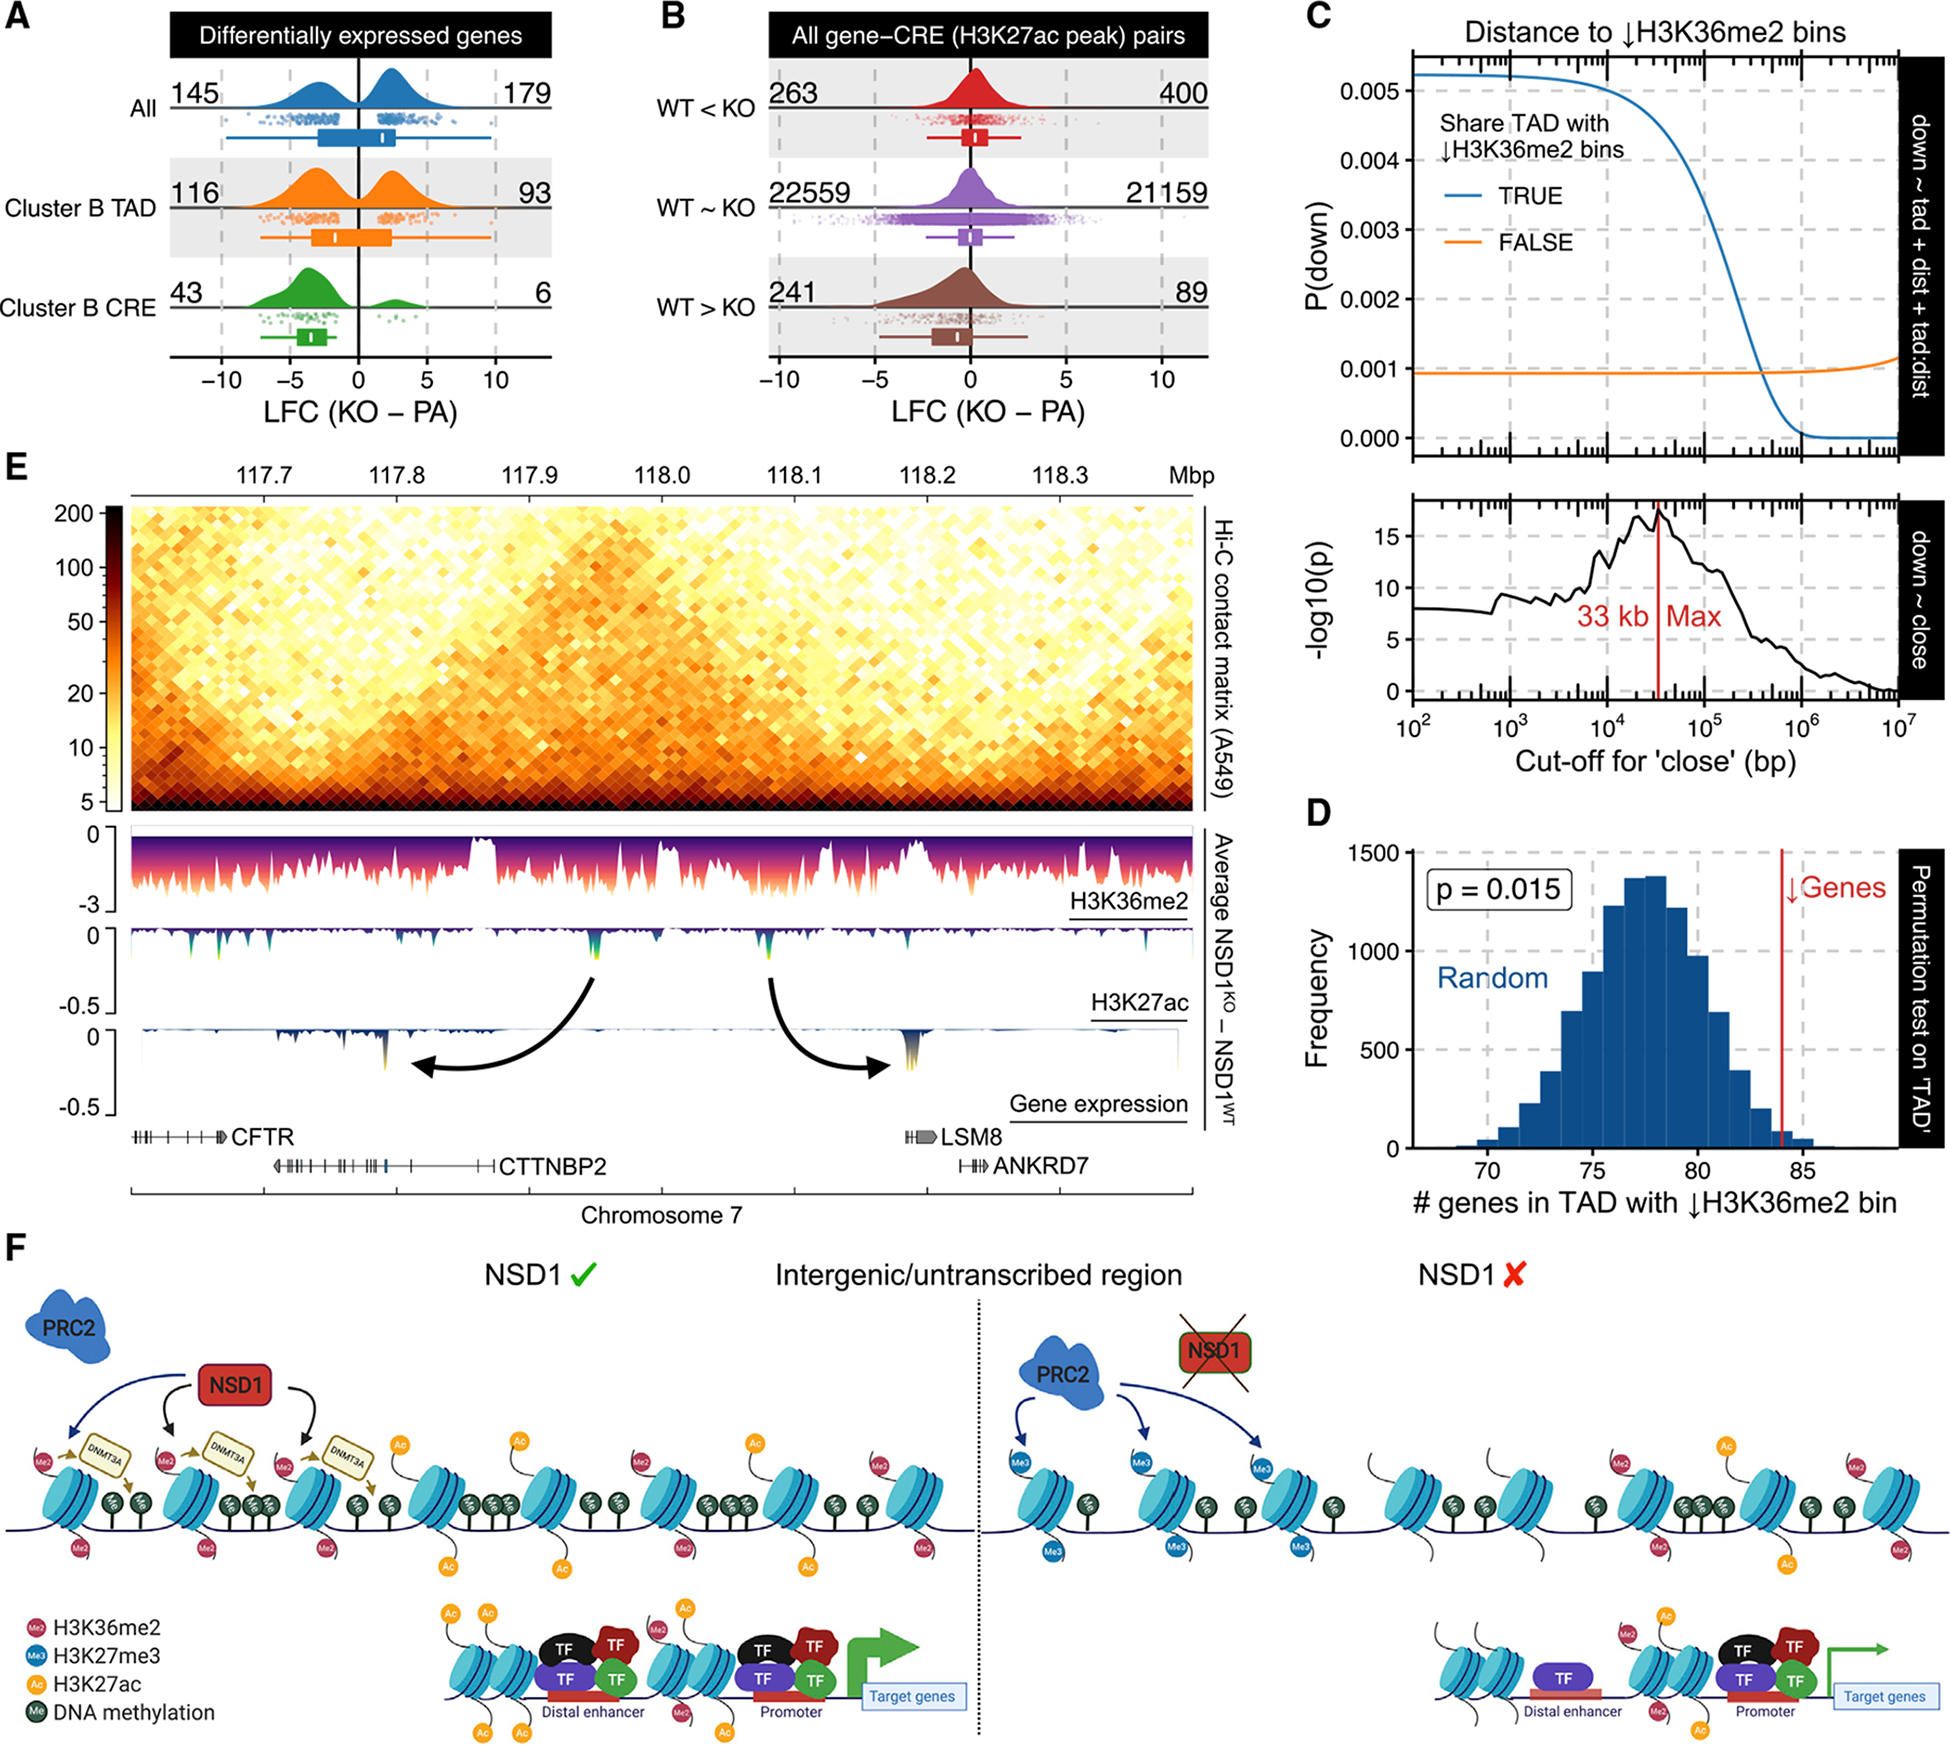
(A) Log fold-change (LFC) of various subsets of DEGs. The lower and upper hinge in the box plots correspond to the first and third quartile; the upper whiskers extend to the largest value ≤ 1.5 * IQR and vice versa for the lower whiskers.
(B) LFC of putative target genes for various differential binding (DB) site subsets. For the box plots, the lower and upper hinge correspond to the first and third quartile; the upper whiskers extend to the largest value ≤ 1.5 * IQR and vice versa for the lower whiskers.
(C) Logistic regression model outputs for expression downregulation status based on its distance to and/or whether it shares a TAD with a cluster B bin.
(D) Permutation test on downregulated genes’ tendency to share a TAD with cluster B bin, controlling for distance.
(E) Example loci illustrating genome-wide phenomenon using differential signal tracks in which enrichment values of the respective parental line were subtracted from the corresponding KOs, after which the average across lines was taken.
(F) Schematic model of epigenetic dysregulation resulting from the absence of NSD1 (created with https://biorender.com). Note that, in the absence of NSD1, PRC2 deposits H3K27me3 in the same intergenic regions where H3K36me2 was depleted. In addition, H3K27ac decreases around distal enhancers located in these H3K36me2-depleted regions.
To verify the dampening of cis-regulatory output as a primary outcome of H3K36me2 depletion, we took another orthogonal approach. Because most regulatory effects of intergenic epigenetic changes are constrained by chromatin conformation (Donaldson-Collier et al., 2019; Lhoumaud et al., 2019), especially topologically associating domains (TADs) that delimit the majority of promoter-enhancer long-range interactions, we specifically investigated how these domains impact H3K36me2 depletion’s influence. In particular, we called TADs from a publicly available Hi-C dataset for the epithelial lung cancer cell line A549 (D’Ippolito et al., 2018), which we expect to have comparable chromatin conformation to epithelial HNSCC (Barutcu et al., 2015; Cancer Genome Atlas Network, 2015; Cancer Genome Atlas Research Network, 2012; D’Ippolito et al., 2018; Dixon et al., 2012). Specifically, we investigated whether a decrease in gene expression is overrepresented in TADs containing H3K36me2-depleted regions (Figure 3A—cluster B). As an association could also arise due to simple linear—rather than spatial—proximity, we included the distance of genes to their nearest cluster B bin as a covariate together with the status of sharing a TAD in logistic regression modeling (Figure 4). Although the likelihood of reduced expression remains low when TAD boundaries fence off genes from their closest H3K36me2-depleted regions, in the absence of such elements, a strong association (p value of “TAD” = 5e–8) that decays with distance can be observed. Next, in order to exclude the possibility that we may not be appropriately accounting for the distance effect, the continuous distance variable was substituted with a categorical surrogate to signify whether or not a gene is within a critical distance of the nearest cluster B bin. Subsequent to selecting the distance cutoff (at 33 kb) that exhibited the strongest association with lowered expression, we found that the presence of H3K36me2 depletion in the same TAD remained a significant contributing factor (p = 0.02). Finally, in an alternative approach to control for the distance effect, we used resampling to create lists of genes that are equal in size to the set of downregulated genes and have the same distribution of distance to the nearest cluster B bin. Again, we found that, in this controlled comparison, there was still a significant tendency for downregulated genes to occupy the same TAD as H3K36me2-depleted regions (Figure 4D).
We conclude that, as has been suggested in other systems (Donaldson-Collier et al., 2019; Lhoumaud et al., 2019), the effects of H3K36me2 depletion in HNSCC cells are governed in part by 3D chromatin structure. We also propose that the distance of 33 kb may represent an average distance between a depleted enhancer and its target gene.
Overall, we show that the loss of intergenic H3K36me2 domains in NSD1-KO cell lines results in loss of H3K27ac and enhancer activity of the affected regions, leading to a reduction in expression of target genes, and that this effect is more significant within a surrounding TAD than outside of the TAD (see Figure 4E for a representative chromosomal region). To summarize our data, we generated a schematic model of epigenome dysregulation resulting from the absence of NSD1 (Figure 4F). Upon the KO of NSD1, intergenic H3K36me2 levels drop significantly, H3K27me3 increases in the same regions, and DNAme slightly decreases around those regions that are depleted of H3K36me2. In addition, at those H3K36me2-depleted regions, H3K27ac decreases, primarily at distal enhancers, making those enhancers weaker/less active. These changes in the strength of distal enhancers will consequently lead to lower expression of the genes that they regulate.
Transcriptomic changes and pathways affected by the absence or loss of NSD1 and H3K36me2
Having established that the loss of NSD1-mediated H3K36me2 specifically affects cis-regulatory elements, resulting in concomitant decreases of H3K27ac and expression of putative target genes (Figure 4C), we set out to characterize the downstream transcriptomic alterations. We first focused on the primary targets of NSD1 deletion, i.e., the genes directly affected by the loss of intergenic H3K36me2. Those are most likely to resemble the early oncogenic events that occur in the cell of origin of NSD1-MT tumors. We took an integrative approach by jointly evaluating H3K36me2, H3K27ac, and RNA-seq data. GeneHancer (Fishilevich et al., 2017) links residing within the same TAD (projected from the A549 cell line data; D’Ippolito et al., 2018) as regions depleted of H3K36me2 (Figure 3A—cluster B bins) were filtered for CREs overlapping our merged H3K27ac peak-set while also presenting changes in agreement with those of gene expression. The final set of ~5,000 pairs was ordered independently by the differential test statistics for each assay type, after which a single ranking was obtained through taking the geometric mean, enabling us to perform gene set enrichment analysis (GSEA) (Mootha et al., 2003; Subramanian et al., 2005). This approach is valuable in synthesizing information and extracting biological meaning from long lists of differentially expressed genes. Several representative “gene sets” have been established to date. Here, we highlight the analysis using the “hallmark” gene sets (Liberzon et al., 2015), which we found to efficiently condense redundant annotations while still retaining the main trends observed in the data. Five of the seven significantly overrepresented gene sets were associated with decreased activity in the NSD1-KO condition (Figure 5A; Table S3). Most of these molecular signatures are consistent with previously reported roles of NSD1/H3K36me2 in immune response (Brennan et al., 2017), epithelial-mesenchymal transition (EMT) (Cheong et al., 2020; Ezponda et al., 2013; Han et al., 2019; Yuan et al., 2020), and regulation of RAS signaling (García-Carpizo et al., 2016; Visser et al., 2012). Our analysis suggests that NSD1 mutations may facilitate HNSCC development through their pleiotropic effects on tumor immunity, signaling, and plasticity.
Figure 5. Changes in transcriptome and pathways resulted from loss of NSD1 and reduced H3K36me2 levels.
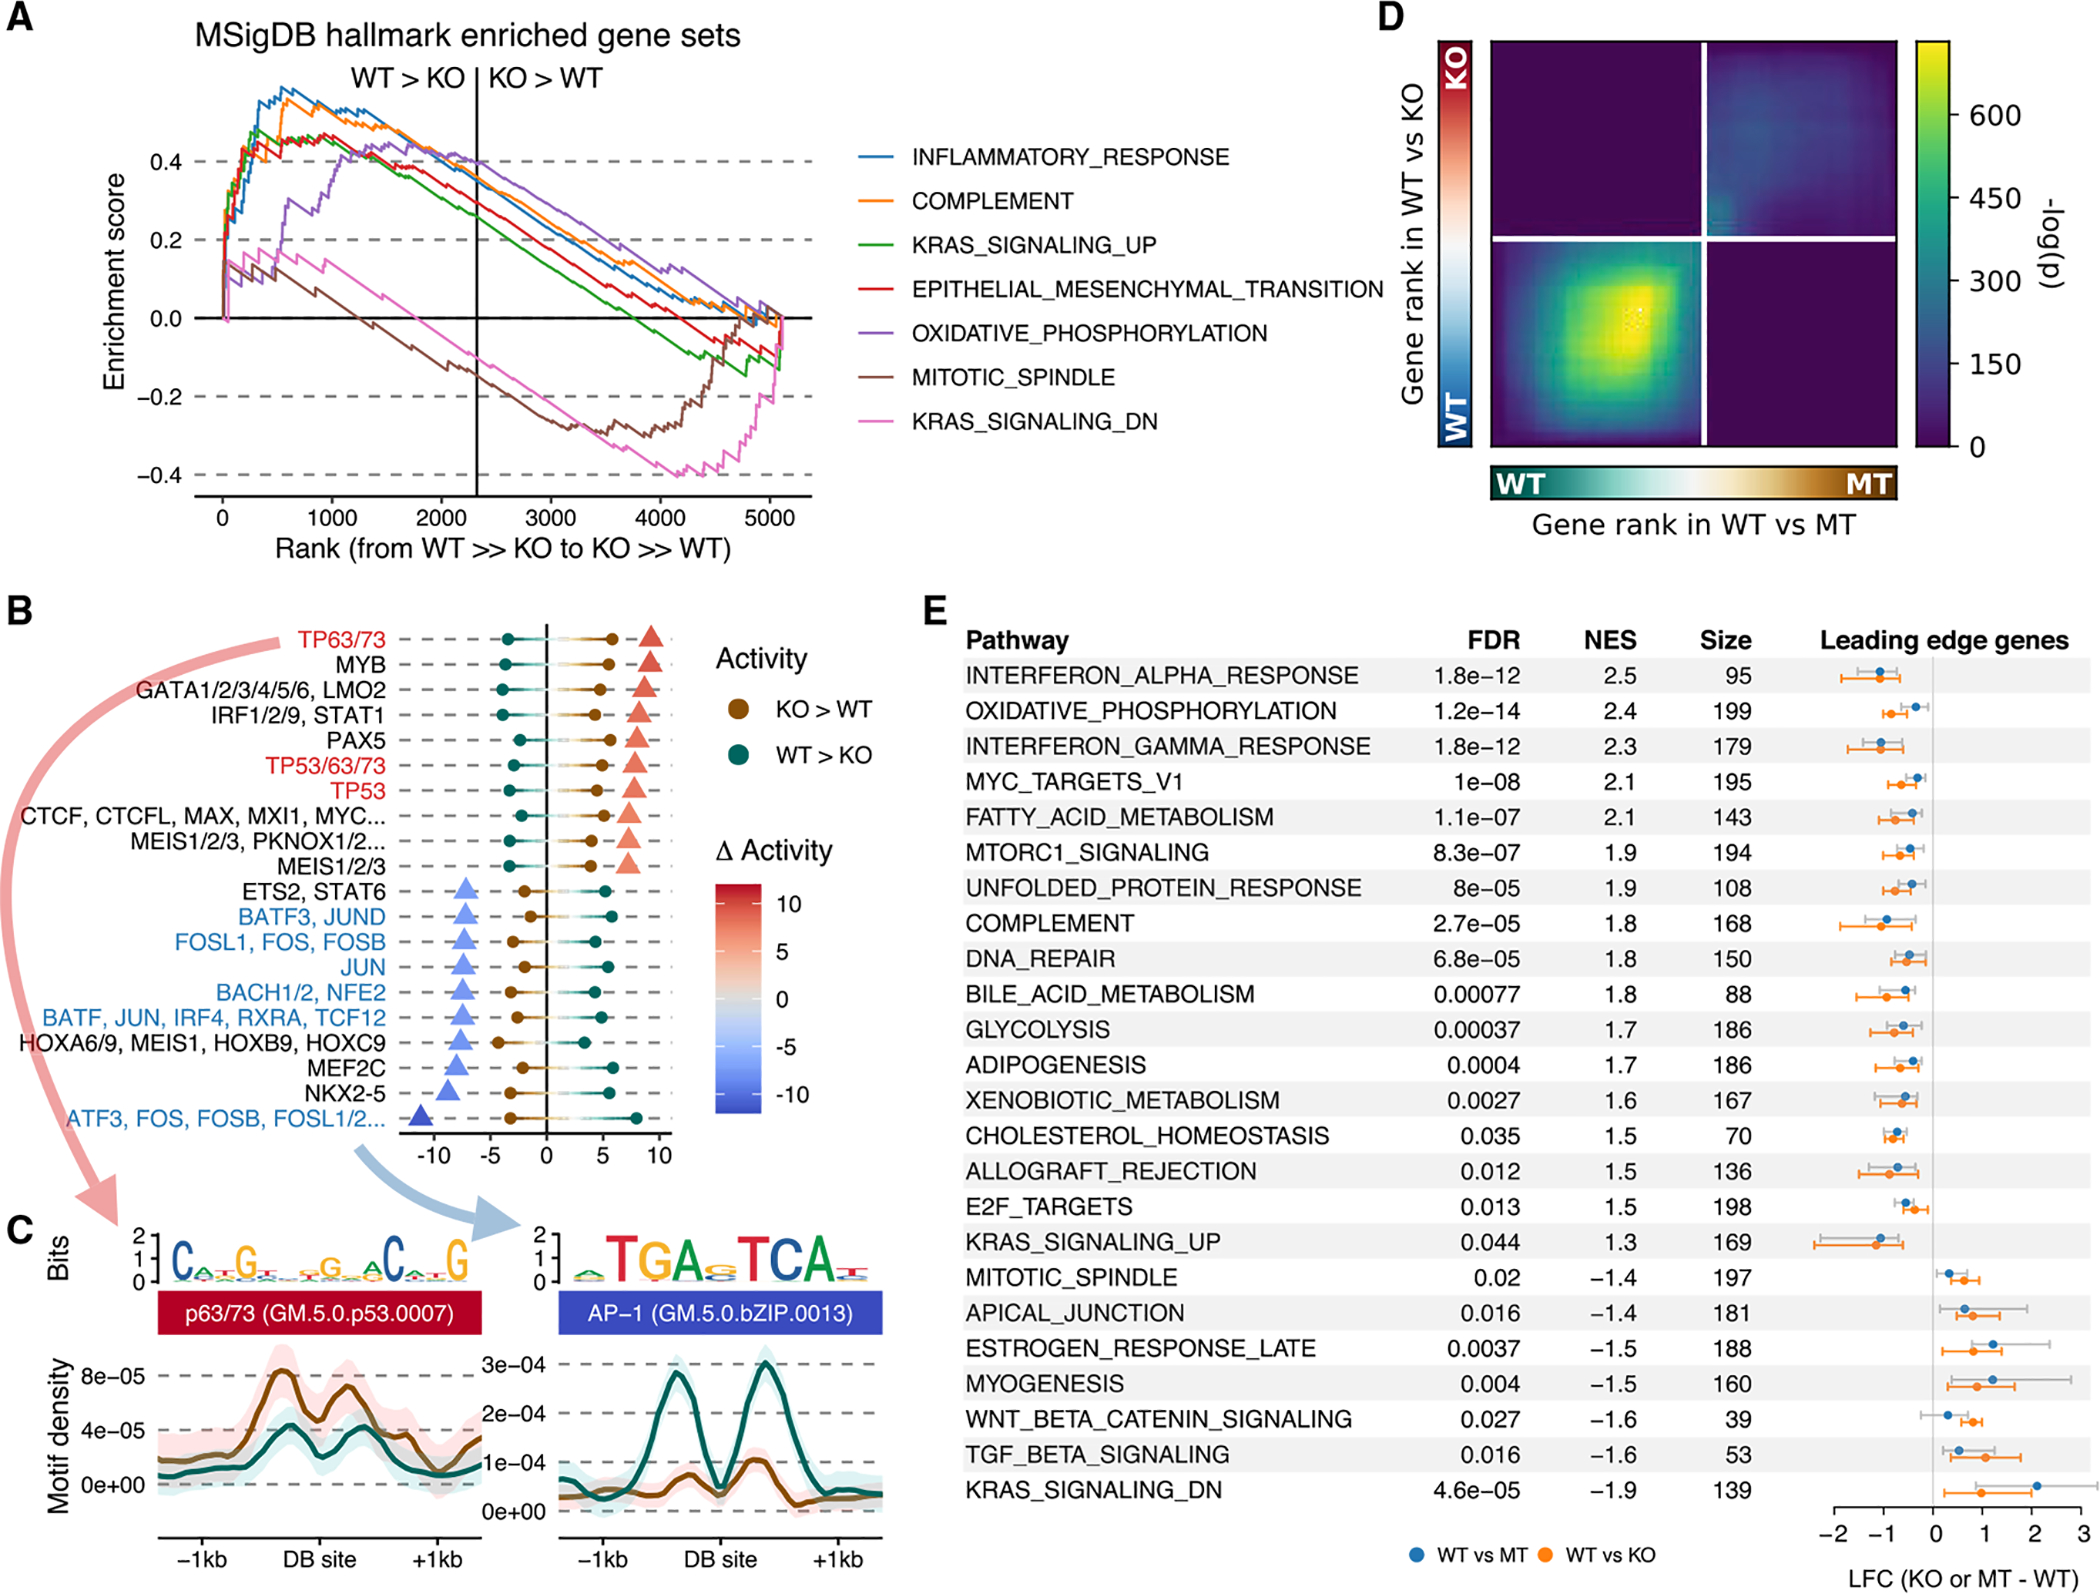
(A) GSEA enrichment plot of hallmark gene sets significantly associated with the aggregated ranking of differentially expressed genes and genes targeted by differentially acetylated enhancers using their test statistics.
(B) Motifs exhibiting differential activity between up- versus downregulated peaks, with dots representing the strength of association in each direction and triangles their difference.
(C) Aggregated motif density plots around differential H3K27ac sites for the most significant differentially associated motifs in each direction.
(D) Stratified rank-rank hypergeometric overlap plot of gene expression differences between NSD1-WT versus MT and WT versus KO.
(E) Distribution of expression changes for leading edge genes of hallmark gene sets significantly associated with the aggregated ranking of differential gene expression for both NSD1-WT versus MT and WT versus KO. The error bars indicate the interquartile range (IQR).
Another approach to dissect the concerted changes accompanying NSD1 deletion is to examine putative regulatory sequences of the affected CREs. We aimed to identify DNA motifs that are differentially represented within CREs, as defined by H3K27ac peaks, that decrease in strength in NSD1-KO compared to those that increase. Briefly, motif prevalence was taken as covariates in several classifiers to distinguish upregulated from downregulated sites, and measures of feature importance across methods were next consolidated using rank aggregation (Bruse and Heeringen, 2018; Table S5). The prevalent trend is that NSD1-KO appears to reduce transcriptional regulation through the activator protein 1 (AP-1) and increase regulation through the p53 family (including p63 and p73) of transcription factors (Figures 5B and 5C). AP-1 is a critical transcription factor downstream of the RAS signaling pathway and controls a variety of processes, including promoting inflammatory response in cancer (Ji et al., 2019). Hence, the AP-1 pathway may be one of the early NSD1 targets responsible for downregulation of the RAS pathway’s transcriptional output and tumor’s immune response. TP53 has a central importance in many cancers, and it is plausible that it is an important regulator in NSD1 MT HNSCCs. Furthermore, P63 is a master regulator of the development and homeostasis of stratified squamous epithelium, and its aberrant amplification and expression are commonly observed in squamous cell carcinomas, including HNSCC (King and Weinberg, 2007). However, because tp53/p63-specific motifs are enriched within enhancers that increase in activity—and are hence not direct targets of NSD1—this is likely to be a secondary, downstream effect of H3K36me2 depletion or potentially reflects the high activity of TP63 in squamous-type cancers (Corces et al., 2018).
Finally, we wanted to connect the transcriptional characteristics of NSD1-KO HNSCC cell lines to those observed in patient-derived NSD1-MT cell lines. We reasoned that identifying the overlap between those two sets may help overcome the cell of origin and other confounding factors and highlight the pathways downstream of NSD1 deletion. Although we observed a propensity for upregulation in both contrasts (Figure S4C), we found a significant overlap for downregulated genes—to a degree much stronger than between those on the contrary—using a fixed p value cutoff (Figure S4D). Pathway enrichment analysis on these conservative differentially expressed genes yields broadly defined terms, such as “developmental process” (Table S6). To better characterize the similarity and differences between NSD1-MT and NSD1-KO samples in terms of their transcriptomic deviation from NSD1-WT ones, we adopted a rank-rank hypergeometric overlap approach (Cahill et al., 2018) that illustrates the extent of concordance (or discordance) among two differentially expressed gene sets with sliding significance cutoffs. We find that the overlap is most pronounced in genes experiencing downregulation (but not upregulation) in the absence of NSD1, although we find no enrichment in discordant expressional changes (Figure 5D). This highlights the potential context-dependency of expression upregulation, which contrasts the prevailing consistency of downregulated targets subject to H3K36me2 regulation. GSEA using the hallmark gene sets again identifies interferon (alpha and gamma) response to be among the top pathways that are downregulated in the absence of NSD1. Several other processes, such as oxidative phosphorylation and metabolism, are also notably affected (Figure 5E; Table S4).
Validation of cell-line-based observations in primary tumors from the Cancer Genome Atlas (TCGA)
Additionally, we find that our system similarly captures the dichotomy of NSD1 MT versus WT tumors for other squamous cancer types enriched in NSD1 mutations (Figures S5A–S5D)—a trend not observed in the remaining cohorts with a high prevalence of NSD1 mutations (>10% NSD1 mutation rate and >5 patients with NSD1 mutations; Figures S5E–S5L). Turning back to TCGA-HNSC and focusing on the DNA methylation landscape, we find that regions depleted of H3K36me2 upon NSD1-KO defined here are also highly predictive of DNA hypomethylation in tumor samples (Figure 6B). Furthermore, we observed that, as with the NSD1-WT versus MT and versus KO cell line expressional comparison (Figure 5D), contrasting differential gene expression of NSD1-WT versus KO in cell lines against NSD1-WT versus MT tumors also revealed a similarly striking concordance of downregulation (Figure 6C).
Figure 6. Validation of cell-line-based observations in primary tumors from TCGA.
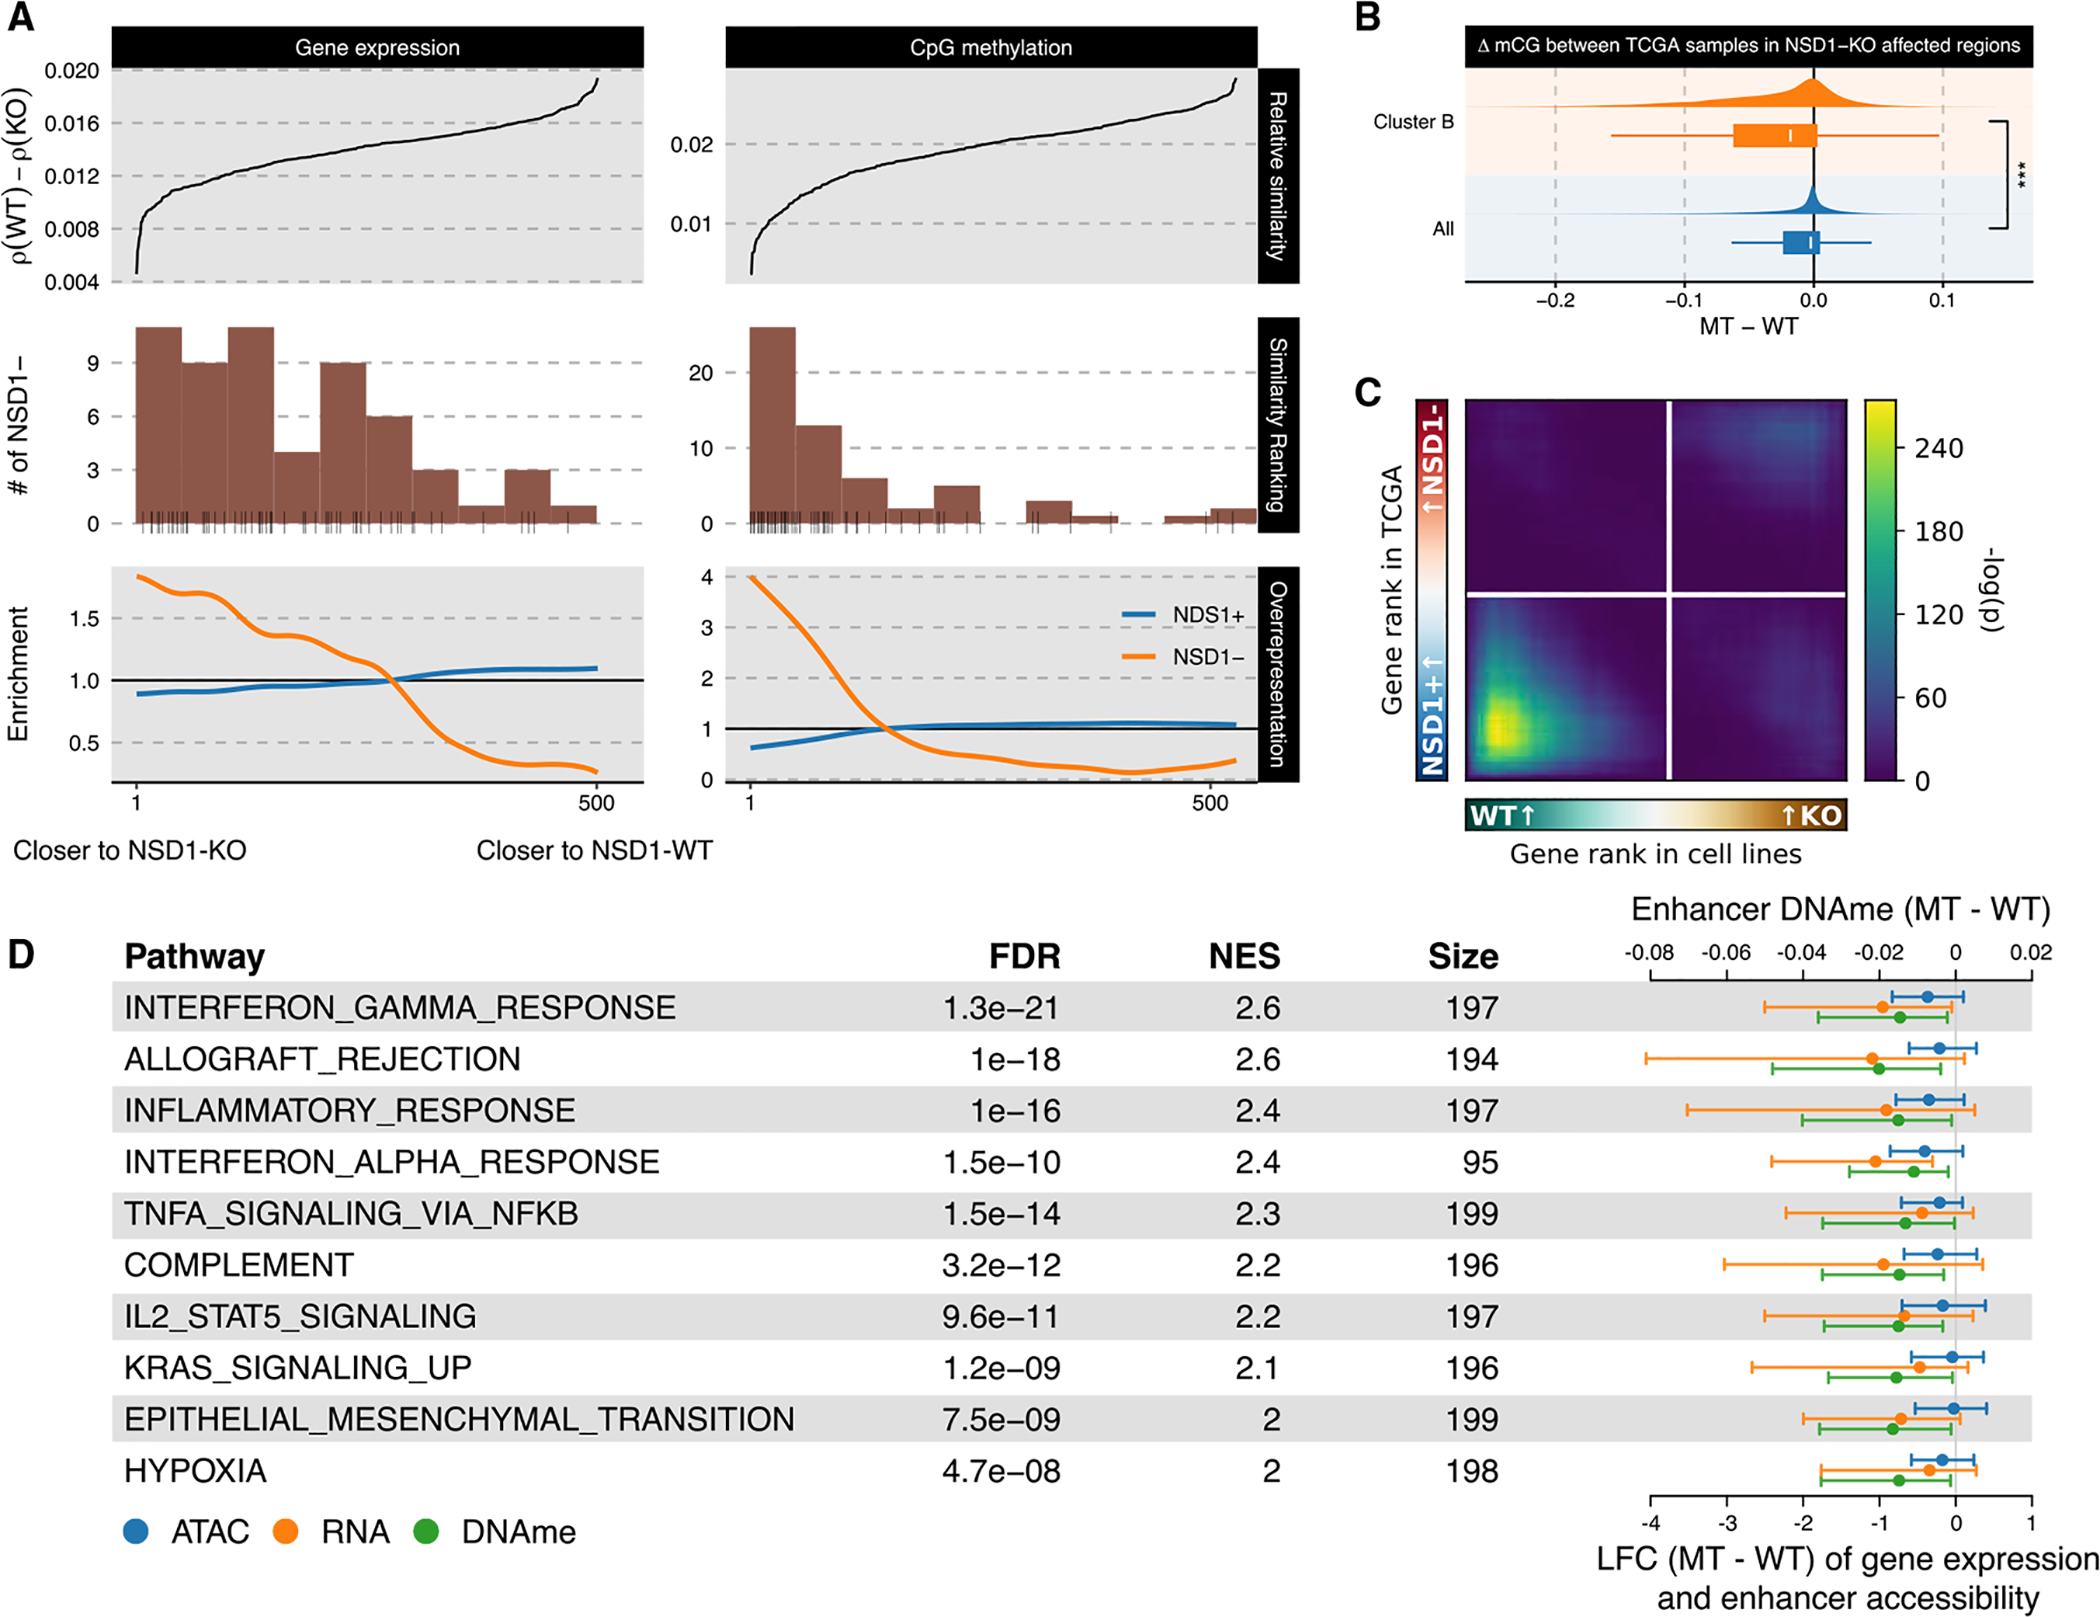
(A) TCGA-HNSC samples were ranked by relative similarity to NSD1-WT and KO cell line samples (top), NSD1 mutational status was tabulated (middle), and enrichment of NSD1 mutational groups within quantiles was computed (bottom).
(B) Differential CpG methylation across all sites is contrasted against those located in regions depleted of H3K36me2 upon NSD1-KO (i.e., cluster B bins). For the box plots, the lower and upper hinge correspond to the first and third quartile; the upper whiskers extend to the largest value ≤ 1.5 * IQR and vice versa for the lower whiskers.
(C) Rank-rank hypergeometric overlap of genes ranked by LFC in cell line system and TCGA; see Figure 5D.
(D) Most significant results from GSEA on genes ranked by concordant upregulation (or downregulation) of gene expression and enhancer accessibility and DNA methylation, with the values associated with constituent genes shown to the right. The error bars indicate the interquartile range (IQR).
Having established that key differences between NSD1-WT and KO cell lines largely capture the dichotomy between primary NSD1+/− tumors in various genomic modalities independently, we proceeded to adopt an integrative framework. Specifically, we performed rank aggregation across three lists of genes ranked by differential expression, differential enhancer methylation, and differential enhancer accessibility in order to identify genes that are repressed upon decreased distal regulatory potential and vice versa. As a result, we find that, among hallmark gene pathways, “interferon response” and other immune pathways as well as “EMT” are once again exceptionally significant with positive enrichment scores, signifying that genes within these pathways are expressed at lower levels and have less-active cis-regulatory elements in the absence of functional NSD1 (Figure 6D).
DISCUSSION
HPV (−) HNSCC is a deadly cancer (Dillon and Harrington, 2015; Pfister et al., 2015) and, despite the use of innovative targeted and immune therapies, treatments have not been effective, primarily due to poor understanding of the underlying tumorigenesis mechanisms (Ang et al., 2010; Dillon and Harrington, 2015; Pan et al., 2019). We have previously identified a subset of HPV (−) HNSCCs that is characterized by loss-of-function NSD1 or H3K36M mutations with unique molecular features (Papillon-Cavanagh et al., 2017). More recently, NSD1 has been demonstrated to be a potential prognostic biomarker in HPV (−) HNSCC (Pan et al., 2019), suggesting that a distinct biological mechanism is involved during the evolution of NSD1 MT HNSCC. Thus, in order to improve treatment outcomes, we need to understand how NSD1 mutations contribute to the formation or progression of this cancer.
Our comparison of three patient-derived NSD1-WT and three NSD1-MT cell lines revealed several consistent epigenetic trends.
Large intergenic domains of H3K36me2 that are present in NSD1-WT cells are nearly totally absent in NSD1-MT lines.
DNA methylation, which is normally associated with intergenic H3K36me2, is greatly reduced in NSD1-MTs. Hence, outside of actively transcribed genes, NSD1-MT cells are globally hypomethylated.
The levels of the H3K27me3 modification, associated with silenced regions and antagonized by the presence of H3K36me2/3, are elevated in NSD1-MT cell lines, particularly in regions that are occupied by H3K36me2 in NSD1-WT.
Disrupting NSD1 by CRISPR-Cas9 in the three NSD1-WT cell lines allowed us to establish the extent to which these epigenomic characteristics were a direct consequence of the absence of functional NSD1. The NSD1-KO lines faithfully recapitulated the reduction of intergenic H3K36me2 and the corresponding increase in H3K27me3 observed in NSD1-MT cells. At the DNA methylation level, although DNAme decreased in the regions of H3K36me2 loss, we noted that the decrease was modest compared to the hypomethylation observed in the NSD1-MT cell lines. We also found that the extent of decrease in DNAme was variable across lines, showing that the genetic and epigenetic state of the parental cell line is an important factor in the fate of DNAme following epigenome dysregulation. The relatively small decrease in DNA methylation may be explained by the fact that, compared to histone modifications, DNA methylation is a more stable mark, and once established, it tends to be more faithfully maintained, particularly in differentiated cell lines. Overall, our results strongly support the direct causal effect of NSD1 disruption on the epigenetic deregulation observed in NSD1-MT HNSCCs.
Having characterized the primary epigenetic outcomes of NSD1 deletion, we aimed to understand the downstream consequences and contributions to the pathology of HNSCC. Recent findings show that H3K36me2 helps to promote the establishment of DNA methylation (Weinberg et al., 2019) and restrict the spread of heterochromatic H3K27me3 (Lu et al., 2016; Streubel et al., 2018). Furthermore, H3K36me2 domains surround actively transcribed genes and are associated with “active” regions of the genome (Weinberg et al., 2019). Although generally not transcribed, those regions tend to be rich in chromosomal contacts, CCCTC-binding factor (CTCF) binding sites, and H3K27 acetylation peaks that are characteristic of open chromatin and CREs (Lhoumaud et al., 2019). Our analysis demonstrates that, in HNSCC, the regions of NSD1-dependent H3K36me2 loss are indeed significantly enriched in CREs and specifically distal enhancers. Upon the loss of H3K36me2, those enhancers also lose DNAme, gain H3K27me3, and, most importantly, lose the active mark H3K27ac. This loss of enhancer activity is correlated with reduced expression of target genes. It will be of high mechanistic interest to understand how this loss of acetylation results from the primary epigenetic changes. It is possible that H3K36me2 is involved in promoting the activity of histone acetyltransferases. DNA methylation loss, together with loss of H3K36me2, may result in aberrant recruitment of transcription factors that are needed to enhance open chromatin state. It is also possible that chromatin compaction due to H3K27me3 spread restricts acetylation or hinders acetyltransferases by direct competition for substrates. Further studies will be needed to elucidate those questions.
Our findings on epigenetic consequences of NSD1 mutations in HNSCCs complement recent advances in understanding the significance of H3K36me2 in cancer. Lhoumaud et al. (2019) investigated the function of NSD2—another member of the histone methyltransferase family that has been implicated in depositing intergenic H3K36me2—in multiple myeloma. In cells that naturally carry the 4;14 translocation that drives overexpression of NSD2, reducing NSD2 levels results in depletion of intergenic H3K36me2 domains, decreased enhancer activity, and downregulation of target gene expression within topologically associated chromatin domains. In pancreatic carcinoma, Yuan et al. (2020) found opposing effects of disruption of NSD2 and the lysine-specific demethylase KDM2A and concluded that the NSD2-associated reduction of H3K36me2 results in loss of enhancer activity of a specific class of enhancers that regulate EMT.
Although the downstream epigenetic effects of NSD1 and NSD2 appear similar, mutations in those two methyltransferases are involved in distinct pathologies. In cancer, overactivity of NSD2 has been implicated in blood malignancies: activating NSD2 point mutations in acute lymphocytic leukemia (Jaffe et al., 2013; Oyer et al., 2014) and immunoglobulin H (IgH)-NSD2 fusion in multiple myeloma (Chesi et al., 1998). A frequent NUP98-NSD1 translocation has been found in acute myeloid leukemia (Jaju et al., 2001), although most likely this fusion does not act through NSD1 overexpression but a gain-of-function phenotype of the resulting protein (Wang et al., 2007). Loss-of-function mutations in NSD1 have been identified as driver mutations in squamous cell carcinomas of the head and neck (Cancer Genome Atlas Network, 2015) and lung (Brennan et al., 2017). Although some loss-of-function NSD2 mutations are found in HNSCC (Peri et al., 2017), to our knowledge, they have not been identified as statistically significant driver mutations in neither HNSCC nor any other cancer. In genetic disease, heterozygous loss-of-function mutations in NSD1 are responsible for Sotos overgrowth syndrome (Kurotaki et al., 2002), although heterozygous loss-of-function mutations in NSD2have been associated with Wolf-Hirschhorn syndrome (Derar et al., 2019; Rauch et al., 2001), which is characterized by a growth deficiency. Conversely, NSD2 mutations have not been found in patients with overgrowth syndromes (Douglas et al., 2005). It is possible that the different phenotypic outcomes of mutations in NSD1 and NSD2 are a result of their different expression patterns across developmental times and tissue types, but given the differences in protein structure and numbers of alternatively spliced isoforms produced by each gene, it is likely that the two methyltransferases have other, divergent functions.
Our final aim was to understand the transcriptomic consequences of NSD1 loss in HNSCC. We carried out an integrative gene set enrichment analysis, aiming to focus on the primary genes targeted by the regulatory cascade. Several pathways, including KRAS signaling, EMT, and inflammatory responses, were downregulated following the loss of NSD1 (Figure 5A). These findings further substantiate recent studies on dysregulation of H3K36me2 in other biological and disease contexts. In patients with Sotos syndrome caused by germline NSD1 haploinsufficiency, deregulation of mitogen-activated protein kinase (MAPK)/ERK signaling pathway downstream of KRAS activation was observed and postulated to contribute to accelerated skeletal outgrowth (Visser et al., 2012). Similarly, NSD2-mediated H3K36me2 has been shown to contribute to KRAS transcriptional program in lung cancers (García-Carpizo et al., 2016). NSD2 has also been implicated in promoting EMT in pancreatic carcinoma (Yuan et al., 2020), prostate cancer, renal cell carcinoma, and multiple myelomas (Cheong et al., 2020; Ezponda et al., 2013; Han et al., 2019). A marked downregulation of immune response appeared as one of the most consistent trends across various analyses that we have conducted. This observation is in agreement with recent findings that NSD1-MT HNSCC exhibits an immune-cold phenotype with low T cell infiltration (Brennan et al., 2017; Saloura et al., 2019).It is remarkable that increasing evidence points to the association of NSD1 mutations and reduced DNAme with deficient immune response in HNSCCs, because in other cancers, such as melanoma, DNA hypomethylation has been implicated with elevated immune response, possibly through de-repression of retroviral sequences and viral mimicry mechanisms (Emran et al., 2019). In addition, our gene set enrichment analyses are corroborated by the analysis of transcription factor binding site sequence motifs that characterize differentially regulated CREs. The binding motifs of AP-1, which acts downstream of KRAS and regulates cellular inflammatory responses, and P63, which is critical for the self-renewal and differentiation of squamous basal cells, are among the most overrepresented sequences in those regions, suggesting a key function of these transcription factors downstream of NSD1 inactivation in HNSCC. Further mechanistic studies are warranted, which will have significant translational implications for the future development of immune therapies for HNSCCs.
Finally, the direct cancer relevance of our principal findings, which were based on genetic manipulation of several cell lines, was demonstrated by the reanalysis of primary tumor data from TCGA-HNSC. We first discovered that NSD1 truncating mutations were indeed the shared characteristic among the tumor samples whose transcriptome and methylome were most similar to the cell lines used in this study. Further analysis revealed four trends that are consistent with our cell-line-based findings.
DNA hypomethylation in NSD1 MT tumors preferentially influences CREs.
DNA hypomethylation in tumors is significantly associated with the regions that lost H3K36me2 as a result of the KO of NSD1.
Differential gene expression comparison between NSD1-WT versus NSD1-KO in our cell line system and NSD1-WT versus NSD1-MT tumors showed significant similarities between downregulated genes.
Most of the genetic pathways—and specifically those related to immune response, EMT, and KRAS signaling—perturbed by NSD1-KO in cell culture were also similarly affected in the comparison of NSD1-WT versus NSD1-MT tumors.
In summary, our studies characterized the extensive epigenome reprogramming induced by NSD1 loss in HNSCCs, which may, in turn, lead to multifaceted effects on tumor growth, plasticity, and immunogenicity. More work will be needed to understand why such a global chromatin perturbation, which affects much of intergenic H3K36me2, causes deregulation of specific biological pathways. Alternations in tumor lineage plasticity and immune response suggest that NSD1 could serve as a potential biomarker for patients’ response to existing chemo- or immune therapy, respectively. Furthermore, these hallmarks may constitute vulnerabilities of the tumor that may be explored in designing therapeutic approaches.
STAR★METHODS
RESOURCE AVAILABILITY
Lead contact
Further information and requests for resources and reagents should be directed to and will be fulfilled by the Lead Contact Dr. Jacek Majewski (jacek.majewski@mcgill.ca).
Materials availability
This study did not generate new unique reagents.
Data and code availability
The accession number for the WGBS data, RNA-seq data, and ChIP-seq data for histone H3 post-translational modifications in human head and neck squamous cell carcinoma cell lines reported in this paper isNCBI GEO: GSE149670.
Custom scripts used to generate the results and figures are also available at https://github.com/bhu/hnscc_nsd1.
All other relevant data supporting the key findings of this study are available within the article and its Supplemental information files.
EXPERIMENTAL MODEL AND SUBJECT DETAILS
Cell culture
Three NSD1 wild-type patient-derived cell lines–Cal27 (ATCC, CRL-2095), FaDu (ATCC, HTB-43), and Detroit562 (ATCC, CCL-138) and three NSD1 mutant cell lines—SCC-4 (ATCC, CRL-1624), SKN-3 (JCRB Cell Bank, JCRB1039), BICR 78 (ECACC, 04072111) were used in this study (key resources table and Table S1). FaDu, Cal27, Detroit 562, SKN-3, and SCC-4 cells were cultured in Dulbecco’s modified Eagle medium (DMEM:F12; Invitrogen) with 10% fetal bovine serum (FBS; ThermoFisher). BICR78 (ECACC) was cultured in DMEM:F12 (Invitrogen) with 10% FBS (ThermoFisher), and 400ng/ml hydrocortisone (SigmaAldrich). Drosophila S2 cells were cultured in Schneider’s Drosophila medium (ThermoFisher) containing 10% heat-inactivated FBS. All cell lines tested negative for mycoplasma contamination.
KEY RESOURCES TABLE
| REAGENT or RESOURCE | SOURCE | IDENTIFIER |
|---|---|---|
| Antibodies | ||
| Rabbit monoclonal anti-H3K36me2 | Cell Signaling Technology | Cat # 2901, RRID:AB_1030983 |
| Rabbit monoclonal anti-H3K27me3 | Cell Signaling Technology | Cat # 9733; RRID:AB_2616029 |
| Rabbit polyclonal anti-H3K27ac | Diagenode | Cat # C15410196 RRID:AB_2637079 |
| Mouse monoclonal anti-NSD1 (N312/10) | NeuroMab | Cat # 75–280, RRID:AB_11001827 |
| Chemicals, peptides, and recombinant proteins | ||
| Fetal Bovine Serum, qualified, Canada | ThermoFisher | Cat # 12483020 |
| Hydrocortisone | SigmaAldrich | Cat # H0888–5G |
| DMEM:F12 | ThermoFisher | Cat # 11320033 |
| Schneider’s Drosophila medium | ThermoFisher | Cat # 21720024 |
| Critical commercial assays | ||
| iDeal ChIP-seq Kit for Histones | Diagenode | Cat # C01010051 |
| Alt-R® CRISPR-Cas9 tracrRNA, ATTO 550 | Integrated DNA Technologies | Cat # 1075927 |
| Alt-R® S.p. Cas9 Nuclease V3 | Integrated DNA Technologies | Cat # 1081058 |
| Kapa Hyper Prep Kit | Roche | Cat # 07962363001 |
| Kapa HiFi Uracil+ Kit | Roche | Cat # 07959079001 |
| EZ-DNA Methylation Gold Kit | Zymo Research | Cat # D5006 |
| NxSeq AmpFREE Low DNA Library Kit | Lucigen | Cat #14000 |
| AllPrep DNA/RNA/miRNA Universal Kit | QIAGEN | Cat # 80224 |
| TruSeq Stranded Total RNA Library Prep Kit with Ribo-Zero Human/Mouse/Rat | Illumina | Cat # RS-122–2201 |
| MinElute PCR purification kit | QIAGEN | Cat # 28006 |
| Trans-Blot® Turbo RTA Mini LF PVDF Transfer Kit | Bio-Rad | Cat # 1704274 |
| Deposited data | ||
| WGBS, RNA-seq, and ChIP-seq for histone H3 post-translational modifications in human head and neck squamous cell carcinoma cell lines | This paper | GEO: GSE149670 |
| Experimental models: cell lines | ||
| Cal27 | ATCC | CRL-2095 |
| Detroit562 | ATCC | CCL-138 |
| FaDu | ATCC | HTB-43 |
| BICR 78 | ECACC | Cat # 04072111 |
| SCC4 | ATCC | CRL-1624 |
| SKN-3 | JCRB Cell Bank | JCRB1039 |
| Oligonucleotides | ||
| NSD1 crRNA targeting PWWP region: GCCCTATCGGCAGTACTACG | Integrated DNA Technologies | N/A |
| NSD1 crRNA targeting SET region: GTGAATGGAGATACCCGTGT | Integrated DNA Technologies | N/A |
| Primer to screen PWWP target region, without Miseq adaptors: F- TGTTTCCAGACAGTCTTCTTTGG | Integrated DNA Technologies | N/A |
| Primer to screen PWWP target region, without Miseq adaptors: R- AAAGCCTTTTTCGTTTCCTACC | Integrated DNA Technologies | N/A |
| Primer to screen SET target region, without Miseq adapters: F- CACAGCAGAGGTCTCAGGAA | Integrated DNA Technologies | N/A |
| Primer to screen SET target region, without Miseq adapters: R- GTGGTGATGGTTGCACAAAA | Integrated DNA Technologies | N/A |
| Software and algorithms | ||
| R v3.6.1 | The R Project for Statistical Computing | https://www.R-project.org/ |
| Python v3.7.5 | Van Rossum and Drake, 2009 | https://www.python.org |
| ggplot2 v3.3.0 | Wickham, 2009 | https://ggplot2.tidyverse.org |
| matplotlib v3.2.1 | Hunter, 2007 | https://matplotlib.org |
| pyGenomeTracks v3.2.1 | Ramírez et al., 2018 | https://github.com/deeptools/pyGenomeTracks |
| IGV v2.8.2 | Robinson et al., 2011 | http://software.broadinstitute.org/software/igv/ |
| BWA v0.7.17 | Li and Durbin, 2009 | https://github.com/lh3/bwa |
| BBTools v38.73 | Sourceforge | https://sourceforge.net/projects/bbmap |
| BISCUIT v0.3.12 | GitHub | https://github.com/zhou-lab/biscuit |
| MethylDackel v0.4.0 | GitHub | https://github.com/dpryan79/MethylDackel |
| STAR v2.7.3a | Dobin et al., 2013 | https://github.com/alexdobin/STAR |
| Salmon v1.1.0 | Patro et al., 2017 | https://github.com/COMBINE-lab/salmon |
| GATK v4.1.5.0 | DePristo et al., 2011 | https://gatk.broadinstitute.org/hc |
| bedtools v2.29.0 | Quinlan and Hall, 2010 | https://github.com/arq5x/bedtools2 |
| EpiProfile v2.0 | Yuan et al., 2018 | https://github.com/zfyuan/EpiProfile2.0_Family |
| deepTools v3.3.1 | Ramírez et al., 2016, 2018 | https://github.com/deeptools/deepTools |
| HDBSCAN v0.8.24 | McInnes et al., 2017 | https://github.com/scikit-learn-contrib/hdbscan |
| LOLA v1.16.0 | Sheffield and Bock, 2016 | https://bioconductor.org/packages/release/bioc/html/LOLA.html |
| MACS v2.2.6 | Zhang et al., 2008 | https://github.com/macs3-project/MACS |
| DiffBind v2.14.0 | Ross-Innes et al., 2012 | https://bioconductor.org/packages/release/bioc/html/DiffBind.html |
| ChIPseeker v1.22.1 | Yu etal., 2015 | https://www.bioconductor.org/packages/release/bioc/html/ChIPseeker.html |
| limma v3.42.2 | Ritchie et al., 2015 | http://bioconductor.org/packages/release/bioc/html/limma.html |
| dmrff v1.0.0 | Suderman et al., 2018 | https://github.com/perishky/dmrff |
| SpectralTAD v1.2.0 | Cresswell et al., 2019 | https://www.bioconductor.org/packages/release/bioc/html/SpectralTAD.html |
| DEseq2 v1.26.0 | Love et al., 2014 | https://bioconductor.org/packages/release/bioc/html/DESeq.html |
| apeglm v1.8.0 | Zhu etal., 2019 | https://bioconductor.org/packages/release/bioc/html/apeglm.html |
| RRHO2 v1.0 | Cahill etal., 2018 | https://github.com/RRHO2/RRHO2 |
| zFPKM v1.8.0 | Hart et al., 2013 | http://bioconductor.org/packages/release/bioc/html/zFPKM.html |
| RobustRankAggreg v1.1 | Kolde etal., 2012 | https://cran.r-project.org/web/packages/RobustRankAggreg/index.html |
| fgsea v1.12.0 | Korotkevich et al., 2019 | http://bioconductor.org/packages/release/bioc/html/fgsea.html |
METHOD DETAILS
CRISPR–Cas9 gene editing and generation of stable cell lines
To generate knockout lines of Cal27, Detroit 562, and FaDu cell lines, Ribonucleoprotein (RNP)-mediated CRISPR-Cas9 genome editing was performed using the Alt-R CRISPR-Cas9 System (IDT) and designing synthetic crRNA guides to form a duplex with Alt-R® CRISPR-Cas9 tracrRNA, ATTO 550 (IDT) and coupled to the Alt-R© S.p. Cas9 Nuclease V3 following IDT instructions for “Cationic lipid delivery of CRISPR ribonucleoprotein complexes into mammalian cells.” Transfection was performed using Lipofectamine CRISPRMAX reagent (Thermo Fisher Scientific) with a lower volume than the company’s protocol (with the ratio of 0.05 to RNP) and Cas9 PLUS Reagent (Thermo Fisher Scientific) was used in order to improve transfection. The transfected cells were incubated for 48 h. Single ATTO550+ cells were then sorted into 96-well plates. Clones were expanded and individually verified by Sanger and MiSeq sequencing of the target loci. In order to generate NSD1-KO isogenic lines, two guide sites were targeted simultaneously (guide 1 in PWWP domain: GCCCTATCGGCAGTACTACG and guide 2 in SET domain: GTGAATGGAGATACCCGTGT). The primer sequences used for screening the PWWP target region are F- TGTTTCCAGACAGTCTTCTTTGG and R- AAAGCCTTTTTCGTTTCCTACC, and those for screening the SET target regions are F- CACAGCAGAGGTCTCAGGAA and R- GTGGTGATGGTTGCACAAAA (key resources table).
Histone acid extraction, histone derivatization, and analysis of post-translational modifications by nano-LC–MS
Cell frozen pellets were lysed in nuclear isolation buffer (15 mM Tris pH 7.5, 60 mM KCl, 15 mM NaCl, 5 mM MgCl2, 1 mM CaCl2, 250 mM sucrose, 10 mM sodium butyrate, 0.1% v/v b-mercaptoethanol, commercial phosphatase and protease inhibitor cocktail tablets) containing 0.3% NP-40 alternative on ice for 5 min. Nuclei were washed in the same solution without NP-40 twice and the pellet was slowly resuspended while vortexing in chilled 0.4 N H2SO4, followed by 3 h rotation at 4 °C. After centrifugation, supernatants were collected and proteins were precipitated in 20% TCA overnight at 4°C, washed with 0.1% HCl (v/v) acetone once and twice using acetone only, to be resuspended in deionized water. Acid-extracted histones (5–10 μg) were resuspended in 100 mM ammonium bicarbonate (pH 8), derivatized using propionic anhydride and digested with trypsin as previously described (Sidoli et al., 2016). After the second round of propionylation, the resulting histone peptides were desalted using C18 Stage Tips, dried using a centrifugal evaporator and reconstituted using 0.1% formic acid in preparation for liquid chromatography-mass spectrometry (LC–MS) analysis. Nanoflow liquid chromatography was performed using a Thermo Fisher Scientific. Easy nLC 1000 equipped with a 75 μm × 20-cm column packed in-house using Reprosil-Pur C18-AQ (3 μm; Dr. Maisch). Buffer A was 0.1% formic acid and Buffer B was 0.1% formic acid in 80% acetonitrile. Peptides were resolved using a two-step linear gradient from 5% B to 33% B over 45 min, then from 33% B to 90% B over 10 min at a flow rate of 300 nL min−1. The HPLC was coupled online to an Orbitrap Elite mass spectrometer operating in the positive mode using a Nanospray Flex Ion Source (Thermo Fisher Scientific) at 2.3 kV. Two full mass spectrometry scans (m/z 300–1,100) were acquired in the Orbitrap Fusion mass analyzer with a resolution of 120,000 (at 200 m/z) every 8 data-independent acquisition tandem mass spectrometry (MS/MS) events, using isolation windows of 50 m/z each (for example, 300–350, 350–400…650–700). MS/MS spectra were acquired in the ion trap operating in normal mode. Fragmentation was performed using collision-induced dissociation in the ion trap mass analyzer with a normalized collision energy of 35. The automatic gain control target and maximum injection time were 5 × 10⁵ and 50 ms for the full mass spectrometry scan, and 3 × 10⁴ and 50 ms for the MS/MS scan, respectively. Raw files were analyzed using EpiProfile 2.0 (Yuan et al., 2018). The area for each modification state of a peptide was normalized against the total signal for that peptide to give the relative abundance of the histone modification.
Cross-linking and ChIP-sequencing
About 10 million cells per cell line were grown and directly crosslinked on the plate with 1% formaldehyde (Sigma) for 10 minutes at room temperature and the reaction was stopped using 125nM Glycine for 5 minutes. Fixed cell preparations were washed with ice-cold PBS, scraped off the plate, pelleted, washed twice again in ice-cold PBS, and flash frozen pellets stored at −80°C.
Thawed pellets were resuspended in 500ul cell lysis buffer (5 mM PIPES-pH 8.5, 85 mM KCl, 1% (v/v) IGEPAL CA-630, 50 mM NaF, 1 mM PMSF, 1 mM Phenylarsine Oxide, 5 mM Sodium Orthovanadate, EDTA-free Protease Inhibitor tablet) and incubated 30 minutes on ice. Samples were centrifugated and pellets resuspended in 500ul of nuclei lysis buffer (50 mM Tris-HCl pH 8.0, 10 mM EDTA, 1% (w/v) SDS, 50 mM NaF, 1 mM PMSF, 1 mM Phenylarsine Oxide, 5 mM Sodium Orthovanadate and EDTA-free protease inhibitor tablet) and incubated 30 minutes on ice. Sonication of lysed nuclei was performed on a BioRuptor UCD-300 at max intensity for 60 cycles, 10 s on 20 s off, centrifuged every 15 cycles, chilled by 4°C water cooler. Samples were checked for sonication efficiency using the criteria of 150–500bp by gel electrophoresis of a reversed cross-linked and purified aliquot. After the sonication, the chromatin was diluted to reduce SDS level to 0.1% and concentrated using Nanosep 10k OMEGA (Pall). Before ChIP reaction 2% of sonicated Drosophila S2 cell chromatin was spiked-in the samples for quantification of total levels of histone mark after the sequencing.
ChIP reaction for histone modifications was performed on a Diagenode SX-8G IP-Star Compact using Diagenode automated Ideal ChIP-seq Kit for Histones. Dynabeads Protein A (Invitrogen) were washed, then incubated with specific antibodies (rabbit monoclonal anti-H3K27me3 Cell Signaling Technology 9733, rabbit monoclonal anti-H3K36me2 CST 2901, and rabbit polyclonal anti-H3K27ac Diagenode C15410196), 1.5 million cells of sonicated cell lysate, and protease inhibitors for 10 hr, followed by 20 min wash cycle using the provided wash buffers (Diagenode Immunoprecipitation Buffers, iDeal ChIP-seq kit for Histone).
Reverse cross-linking took place on a heat block at 65°C for 4 hr. ChIP samples were then treated with 2ul RNase Cocktail at 65°C for 30 min followed by 2ul Proteinase K at 65°C for 30 min. Samples were then purified with QIAGEN MinElute PCR purification kit (QIAGEN) as per manufacturers’ protocol. In parallel, input samples (chromatin from about 50,000 cells) were reverse crosslinked and DNA was isolated following the same protocol. Library preparation was carried out using Kapa Hyper Prep library preparation reagents (Kapa Hyper Prep kit, Roche 07962363001) following the manufacturer’s protocol. ChIP libraries were sequenced using Illumina HiSeq 4000 at 50bp single reads or NovaSeq 6000 at 100bp single reads.
Whole Genome Bisulfite Sequencing (WGBS)
Whole genome sequencing libraries were generated from 1000 ng of genomic DNA spiked with 0.1% (w/w) unmethylated l DNA (Roche Diagnostics) and fragmented to 300–400 bp peak sizes using the Covaris focused-ultrasonicator E210. Fragment size was controlled on a Bioanalyzer High Sensitivity DNA Chip (Agilent) and NxSeq AmpFREE Low DNA Library Kit (Lucigen) was applied. End repair of the generated dsDNA with 3′or 5′overhangs, adenylation of 3′ends, adaptor ligation, and clean-up steps were carried out as per Lucigen’s recommendations. The cleaned-up ligation product was then analyzed on a Bioanalyzer High Sensitivity DNA Chip (Agilent). Samples were then bisulfite converted using the EZ-DNA Methylation Gold Kit (Zymo Research) according to the manufacturer’s protocol. DNA was amplified by 9 cycles of PCR using the Kapa HiFi Uracil+ Kit (Roche) DNA polymerase (KAPA Bio-systems) according to the manufacturer’s protocol. The amplified libraries were purified using Ampure XP Beads (Beckman Coulter), validated on Bioanalyzer High Sensitivity DNA Chips, and quantified by PicoGreen. Sequencing of the WGBS libraries was performed on the Illumina HiSeqX system using 150-bp paired-end sequencing.
RNA sequencing
Total RNA was extracted from cell pellets of approximatively 1 million cells, washed with PBS, spun down and preserved at −80, using the AllPrep DNA/RNA/miRNA Universal Kit (QIAGEN) according to the manufacturer’s instructions including DNase treatment option. Library preparation was performed with ribosomal RNA depletion according to the manufacturer’s instructions (NEB) using TruSeq Stranded Total RNA Library Prep Kit with Ribo-Zero Human/Mouse/Rat (Illumina) to achieve greater coverage of mRNA and other long non-coding transcripts. Paired-end sequencing (100 bp) was performed on the Illumina HiSeq 4000 or NovaSeq 6000 platform.
Western blotting
Cells are collected and counted using automatic Countess counter and 1 million cells are collected in individual test tubes and spun down. The cell pellet is washed once using PBS before spinning down again, removing the PBS, and transferring to −80°C for future use. Cell pellets are thawed on ice and resuspended in 85 to 100ul of 1x RIPA buffer from 10x (cell signaling #9806) and add 1:100 Proteinase inhibitors cocktail (P8340, Sigma) and 0.1mM of PMSF. Vortex a few times during the one-hour incubation on ice. Spin down max speed for 10 minutes at 4°C. Collect the supernatant to new tubes and proceed to quantification using BCA-Pierce Protein assay ThermoScientific/Pierce (23227) and use 96 cell microplate flat bottom with 25ul standards every time and 5ul protein samples. Read on Infinite 200Pro Tecan-icontrol. All from Bio-Rad, use stain-free TGX 4%–15% gradient pre-cast gels (4568084), 1x Tris-Glycine running buffer (1610732), for protein standards mix equal amount of all-blue (1610373) and unstained (1610363). As laemmli, use premade 6x buffer containing 0.35M Tris HCl pH 6.8, 30% Glycerol, 10% SDS, 20% Beta-mercaptoethanol, 0.04% Bromophenol blue, in water. Load 50 ul of samples, or standards, or Laemmli 1x in each well. Run for 2/3–3/4 of the gel. Transfer using Bio-Rad trans-blot Turbo Transfer system and the included PVDF membrane in RTA kit low fluorescence (Trans-Blot® Turbo RTA Mini LF PVDF Transfer Kit, 1704274) according to manufacturer instructions and transfer at the High MW program for 10min. The gel was cross-linked on Bio-rad imager system and whole protein images were captured on both gel and membranes. Blocking 1h in 5% skim milk (SM) and overnight incubation rotating at 4°C using 1ug/ml NeuroMab mouse monoclonal anti-NSD1 (N312/10) sold by Antibodies Inc. (75–280) in 2% SM diluted in TBS-tween 0.1% (TBSt). Three washes of 5 minutes each on rotator were done using TBSt before and after the 1h incubation of the membranes with 1:1000 goat anti-mouse-HRP (Jackson Immunoresearch, 115-035-003) in 2%SM in TBSt. ECL Clarity (1705060) or Clarity Max (1705062) from BioRad are used to image the protein.
QUANTIFICATION AND STATISTICAL ANALYSIS
Visualization
Unless otherwise stated, figures were created using ggplot2 (Wickham, 2009) v3.3.0 or matplotlib (Hunter, 2007) v3.2.1. Coverage/alignment tracks were visualized using Python (Van Rossum and Drake, 2009) v3.7.5 with pyGenomeTracks (Ramírez et al., 2018) v3.2.1 or IGV (Robinson et al., 2011) v2.8.2. Sequence logos were generated using ggseqlogo (Wagih, 2017) v0.1.
Processing of sequence data
Sequences were all aligned to the GRCh38 analysis set. Reads from ChIP-seq and targeted sequencing for knock-out validation were mapped using BWA (Li and Durbin, 2009) v0.7.17 with default settings of the BWA-MEM algorithm. WGBS reads were adaptor and quality (Q10) trimmed using BBDuk from BBTools v38.73 (https://sourceforge.net/projects/bbmap) (t = 10 ktrim = r k = 23 mink = 11 hdist = 1 tpe tbo qtrim = rl trimq = 10 minlen = 2) and aligned as well as deduplicated using BISCUIT v0.3.12 (https://github.com/zhou-lab/biscuit) with default options. Per-base methylation calling was performed with MethylDackel v0.4.0 (https://github.com/dpryan79/MethylDackel) after excluding biased ends. RNA-seq reads were aligned using STAR (Dobin et al., 2013) v2.7.3a based on GENCODE (Frankish et al., 2019) Release 33 annotations with the ENCODE standard options. Gene expression quantification was performed via Salmon (Patro et al., 2017) v1.1.0 using default settings of the gentrome-based option. ENCODE blacklisted regions (Amemiya et al., 2019) were excluded from all analyses. Variants were identified with GATK (DePristo et al., 2011) v4.1.5.0 using HaplotypeCaller.
ChIP-seq analysis
Raw tag counts were binned into windows using bedtools (Quinlan and Hall, 2010) v2.29.0 with intersectBed (-c) in combination with the makewindows command. Library size normalization consisted of dividing binned tag counts by the total number of mapped reads after filtering, while input normalization involved taking the log2 ratio of ChIP signals by those of the input (i.e., without immunoprecipitation) with the addition of pseudocount (1) to avoid division by 0. Additionally, quantitative normalization entailed the multiplication of original signal (either in CPM or as log2 ratio over input) by the genome-wide modification percentage information obtained from mass spectrometry.
Enrichment matrices for aggregate plots and heatmaps were generated through deepTools (Ramírez et al., 2016, 2018) v3.3.1 using bamCoverage/bamCompare (–skipZeroOverZero–centerReads–extendReads 200) followed by computeMatrix (scale-regions–regionBodyLength 20000–beforeRegionStartLength 20000–afterRegionStartLength 20000–binSize 1000). Genic regions were taken as the union of any intervals having the “gene” annotations in Ensembl, and intergenic regions were thus defined as the complement of genic ones. The ratio of intergenic enrichment over neighboring genes was calculated by dividing the median CPM of intergenic bins over the median of flanking genic bins after excluding the 10 bins near boundaries (i.e., TSS/TES) to eliminate edge effects and the outer 5 genic bins on each end to keep a comparable number of bins between genic and intergenic regions.
Unless otherwise stated, input-normalized enrichment in windows was used for analyses based on 10kb binned signals. Bins depleted in signal across all tracks (i.e., raw read count consistently lower than 100 in 10 kb bins) were excluded from further analyses. Identification of similarly behaving bin clusters were performed using HDBSCAN (McInnes et al., 2017) v0.8.24 with identical parameters for all samples (minPts = 5000, eps = 5000), and the intersection of label assignments were taken for pairwise comparisons between individual samples of the two conditions to be compared.
Overlap enrichment was determined with all the bins as the background set as implemented in LOLA (Sheffield and Bock, 2016) v1.16.0 for Ensembl (Yates et al., 2020) 97 annotations (genes and regulatory build (Zerbino et al., 2015)). Intergenic or genic ratio for quantiles (as in the microplots along the diagonal in Figure 2E) or groups of bins (as in the hexagonal clumping in the middle panel of Figure 3A) was computed by taking the ratio between the number of 10 kb bins completely overlapping annotated genes and those that fall entirely outside.
Enhancer annotations (double-elite) were obtained from GeneHancer (Fishilevich et al., 2017) v4.14. H3K27ac peaks were called using MACS (Zhang et al., 2008) v2.2.6 (−g hs −q 0.01). Differentially bound peaks were identified using the bioconductor package DiffBind v2.14.0 (Ross-Innes et al., 2012; https://bioconductor.org/packages/release/bioc/html/DiffBind.html). Distribution across gene-centric annotations was obtained using ChIPseeker (Yu et al., 2015) 1.22.1, whereas peak distance relative to TSSs was determined based on refTSS (Abugessaisa et al., 2019) v3.1. Differential motif activity was determined using GimmeMotifs (Bruse and Heeringen, 2018) v0.14.3 with maelstrom and input being differentially bound sites labeled as either up- or downregulated against a database of clustered motifs with reduced redundancy (gimme.vertebrate.v5.0). Motif density was calculated using HOMER (Heinz et al., 2010) v4.11 with annotatePeaks (-hist 5).
WGBS analysis
Methylation calls were binned into 10kb windows, with per-window beta values calculated as (# methylated reads in bin) / (total # of reads in bin). Unless otherwise stated, such tracks were treated identically as ChIP-seq for analyses involving both assays. Differential methylation within actively transcribed regions was based on the union of active genes.
TCGA validation analysis
Compatibility between cell line samples and TCGA tumors were determined by constructing a matrix of beta values for CpG sites included in Illumina 450k and is well-covered by WGBS or alternatively a gene expression matrix for transcriptome comparisons. Correlation between columns (i.e., samples) of the matrix was then calculated, enabling the subsequent computation of average Spearman correlation for a given tumor sample to all cell line samples within each condition. The relative similarity metric is finally defined as the average correlation to KO samples subtracted from those to WT. All HPV+ samples were excluded. Differential gene expression analysis was performed again using DESeq2 (Love et al., 2014) and differential methylation analysis with limma (Ritchie et al., 2015; http://bioconductor.org/packages/release/bioc/html/limma.html) + dmrff (Suderman et al., 2018) using default settings, in both instances controlling for anatomical location of the tumor as well as the donor’s age, sex, and smoking history. For ATAC-seq, fold changes were computed from the normalized enrichment matrix across the HNSC-specific peak set between samples with and without NSD1 mutations from the same anatomical location (Corces et al., 2018).
Hi-C analysis
TADs were identified on the merged A549 replicates using SpectralTAD (Cresswell et al., 2019) v.1.2.0 allowing for 3 levels.
RNA-seq analysis
Differential gene expression analyses were performed using DEseq2 (Love et al., 2014) v1.26.0. Adjusted log fold changes (LFC) were calculated using apeglm (Zhu et al., 2019) v1.8.0. Significantly differentially expressed genes were selected with a s-value (null hypothesis being |adjusted LFC| < 0.5) threshold of 0.05. Significance of consistency between NSD1-WT versus KO and NSD1-WT versus MT was evaluated using RRHO2 (Cahill et al., 2018) v1.0 with hypergeometric testing and stratified (split) presentation. Active genes were identified using zFPKM (Hart et al., 2013) v1.8.0 with a threshold of −3. Rank aggregation was performed using Robus-tRankAggreg (Kolde et al., 2012) v1.1 with aggregateRanks (method = RRA). Gene set enrichment analyses were performed using fgsea (Korotkevich et al., 2019) v1.12.0 with fgseaMultilevel (minSize = 15, maxSize = 500, absEps = 0.0) against MSigDB (Liberzon et al., 2015) v7.1.
Statistical Considerations
Enrichment testing was performed using one-sided Fisher’s exact test of enrichment unless otherwise stated. P values were converted to symbols through: 0 “***” 0.001 “**” 0.01 “*” 0.05 “” 0.1 “" 1. Logistic regression was performed using a generalized linear model as implemented in the R stats package (R v3.6.1, The R Project for Statistical Computing). Differences between NSD1-WT and MT samples involved first averaging within conditions whereas those between NSD1-WT and KO involved subtracting within lines before averaging across. Unless otherwise stated: Cal27-KO corresponds to replicate 1, Det562-KO to replicate 2, and FaDu-KO to replicate 1. For all the box plots, the lower and upper hinge correspond to the first and third quartile, and the upper whiskers extend to the largest value ≤ 1.5 * IQR and vice versa for the lower whiskers.
Supplementary Material
Highlights.
NSD1 directs the interplay between H3K36, H3K27, and DNA methylation in HNSCC
Loss of NSD1 negatively affects the strength of distal intergenic regulatory elements
Downregulated targets of weakened enhancers bridge NSD1 LOF to cancer phenotypes
Primary tumor data from TCGA reflect molecular alterations observed in cell culture
ACKNOWLEDGMENTS
The work in J.M.’s lab is supported by the Large-Scale Applied Research Project grant Bioinformatics and Computational Biology grant from Genome Quebec, Genome Canada, the government of Canada, the Ministère de l’Économie, de la Science et de l’Innovation du Québec, and NIH grant P01-CA196539. The work in B.A.G.’s lab is supported by NIH grants R01AI118891 and P01CA196539 and Leukemia and Lymphoma Robert Arceci Scholar award. C.L. is supported by NIH grant R00CA212257 and Pew-Stewart Scholars for Cancer Research award. B.H. is supported by studentship awards from the Canadian Institutes of Health Research and the Fonds de Recherche Québec - Santé. Computational analysis was performed using infrastructure provided by Compute Canada and Calcul Quebec.
Footnotes
SUPPLEMENTAL INFORMATION
Supplemental Information can be found online at https://doi.org/10.1016/j.celrep.2021.108769.
DECLARATION OF INTERESTS
The authors declare no competing interests.
REFERENCES
- Abugessaisa I, Noguchi S, Hasegawa A, Kondo A, Kawaji H, Carninci P, and Kasukawa T (2019). refTSS: a reference data set for human and mouse transcription start sites. J. Mol. Biol 431, 2407–2422. [DOI] [PubMed] [Google Scholar]
- Amemiya HM, Kundaje A, and Boyle AP (2019). The ENCODE blacklist: identification of problematic regions of the genome. Sci. Rep 9, 9354. [DOI] [PMC free article] [PubMed] [Google Scholar]
- Ang KK, Harris J, Wheeler R, Weber R, Rosenthal DI, Nguyen-Tân PF, Westra WH, Chung CH, Jordan RC, Lu C, et al. (2010). Human papillomavirus and survival of patients with oropharyngeal cancer. N. Engl. J. Med 363, 24–35. [DOI] [PMC free article] [PubMed] [Google Scholar]
- Barutcu AR, Lajoie BR, McCord RP, Tye CE, Hong D, Messier TL, Browne G, van Wijnen AJ, Lian JB, Stein JL, et al. (2015). Chromatin interaction analysis reveals changes in small chromosome and telomere clustering between epithelial and breast cancer cells. Genome Biol 16, 214. [DOI] [PMC free article] [PubMed] [Google Scholar]
- Baxi S, Fury M, Ganly I, Rao S, and Pfister DG (2012). Ten years of progress in head and neck cancers. J. Natl. Compr. Canc. Netw 10, 806–810. [DOI] [PMC free article] [PubMed] [Google Scholar]
- Brennan K, Shin JH, Tay JK, Prunello M, Gentles AJ, Sunwoo JB, and Gevaert O (2017). NSD1 inactivation defines an immune cold, DNA hypomethylated subtype in squamous cell carcinoma. Sci. Rep 7, 17064. [DOI] [PMC free article] [PubMed] [Google Scholar]
- Brettingham-Moore KH, Taberlay PC, and Holloway AF (2015). Interplay between transcription factors and the epigenome: insight from the role of RUNX1 in leukemia. Front. Immunol 6, 499. [DOI] [PMC free article] [PubMed] [Google Scholar]
- Bruse N, and Heeringen S.J.v. (2018). GimmeMotifs: an analysis framework for transcription factor motif analysis. bioRxiv, 474403. [Google Scholar]
- Bui N, Huang JK, Bojorquez-Gomez A, Licon K, Sanchez KS, Tang SN, Beckett AN, Wang T, Zhang W, Shen JP, et al. (2018). Disruption of NSD1 in head and neck cancer promotes favorable chemotherapeutic responses linked to hypomethylation. Mol. Cancer Ther 17, 1585–1594. [DOI] [PMC free article] [PubMed] [Google Scholar]
- Cahill KM, Huo Z, Tseng GC, Logan RW,andSeney ML(2018). Improved identification of concordant and discordant gene expression signatures using an updated rank-rank hypergeometric overlap approach. Sci. Rep 8, 9588. [DOI] [PMC free article] [PubMed] [Google Scholar]
- Cancer Genome Atlas Network (2015). Comprehensive genomic characterization of head and neck squamous cell carcinomas. Nature 517, 576–582. [DOI] [PMC free article] [PubMed] [Google Scholar]
- Cancer Genome Atlas Research Network (2012). Comprehensive genomic characterization of squamous cell lung cancers. Nature 489, 519–525. [DOI] [PMC free article] [PubMed] [Google Scholar]
- Chang JS, Lo HI, Wong TY, Huang CC, Lee WT, Tsai ST, Chen KC, Yen CJ, Wu YH, Hsueh WT, et al. (2013). Investigating the association between oral hygiene and head and neck cancer. Oral Oncol 49, 1010–1017. [DOI] [PubMed] [Google Scholar]
- Cheong CM, Mrozik KM, Hewett DR, Bell E, Panagopoulos V, Noll JE, Licht JD, Gronthos S, Zannettino ACW, and Vandyke K (2020). Twist-1 is upregulated by NSD2 and contributes to tumour dissemination and an epithelial-mesenchymal transition-like gene expression signature in t(4;14)-positive multiple myeloma. Cancer Lett 475, 99–108. [DOI] [PMC free article] [PubMed] [Google Scholar]
- Chesi M, Nardini E, Lim RSC, Smith KD, Kuehl WM, and Bergsagel PL (1998). The t(4;14) translocation in myeloma dysregulates both FGFR3 and a novel gene, MMSET, resulting in IgH/MMSET hybrid transcripts. Blood 92, 3025–3034. [PubMed] [Google Scholar]
- Choufani S, Cytrynbaum C, Chung BH, Turinsky AL, Grafodatskaya D, Chen YA, Cohen AS, Dupuis L, Butcher DT, Siu MT, et al. (2015). NSD1 mutations generate a genome-wide DNA methylation signature. Nat. Commun 6, 10207. [DOI] [PMC free article] [PubMed] [Google Scholar]
- Chung CH, and Gillison ML (2009). Human papillomavirus in head and neck cancer: its role in pathogenesis and clinical implications. Clin. Cancer Res 15, 6758–6762. [DOI] [PubMed] [Google Scholar]
- Corces MR, Granja JM, Shams S, Louie BH, Seoane JA, Zhou W, Silva TC, Groeneveld C, Wong CK, Cho SW, et al. ; Cancer Genome Atlas Analysis Network (2018). The chromatin accessibility landscape of primary human cancers. Science 362, eaav1898. [DOI] [PMC free article] [PubMed] [Google Scholar]
- Cresswell KG, Stansfield JC, and Dozmorov MG (2019). SpectralTAD: an R package for defining a hierarchy of topologically associated domains using spectral clustering. bioRxiv, 549170. [DOI] [PMC free article] [PubMed] [Google Scholar]
- D’Ippolito AM, McDowell IC, Barrera A, Hong LK, Leichter SM, Bartelt LC, Vockley CM, Majoros WH, Safi A, Song L, et al. (2018). Pre-established chromatin interactions mediate the genomic response to glucocorticoids. Cell Syst 7, 146–160. e7. [DOI] [PubMed] [Google Scholar]
- DePristo MA, Banks E, Poplin R, Garimella KV, Maguire JR, Hartl C, Philippakis AA, del Angel G, Rivas MA, Hanna M, et al. (2011). A framework for variation discovery and genotyping using next-generation DNA sequencing data. Nat. Genet 43, 491–498. [DOI] [PMC free article] [PubMed] [Google Scholar]
- Derar N, Al-Hassnan ZN, Al-Owain M, Monies D, Abouelhoda M, Meyer BF, Moghrabi N, and Alkuraya FS (2019). De novo truncating variants in WHSC1 recapitulate the Wolf-Hirschhorn (4p16.3 microdeletion) syndrome phenotype. Genet. Med 21, 185–188. [DOI] [PubMed] [Google Scholar]
- Dillon MT, and Harrington KJ (2015). Human papillomavirus-negative pharyngeal cancer. J. Clin. Oncol 33, 3251–3261. [DOI] [PubMed] [Google Scholar]
- Dixon JR, Selvaraj S, Yue F, Kim A, Li Y, Shen Y, Hu M, Liu JS, and Ren B (2012). Topological domains in mammalian genomes identified by analysis of chromatin interactions. Nature 485, 376–380. [DOI] [PMC free article] [PubMed] [Google Scholar]
- Dobin A, Davis CA, Schlesinger F, Drenkow J, Zaleski C, Jha S, Batut P, Chaisson M, and Gingeras TR (2013). STAR: ultrafast universal RNA-seq aligner. Bioinformatics 29, 15–21. [DOI] [PMC free article] [PubMed] [Google Scholar]
- Donaldson-Collier MC, Sungalee S, Zufferey M, Tavernari D, Katanayeva N, Battistello E, Mina M, Douglass KM, Rey T, Raynaud F, et al. (2019). EZH2 oncogenic mutations drive epigenetic, transcriptional, and structural changes within chromatin domains. Nat. Genet 51, 517–528. [DOI] [PubMed] [Google Scholar]
- Douglas J, Coleman K, Tatton-Brown K, Hughes HE, Temple IK, Cole TR, and Rahman N; Childhood Overgrowth Collaboration (2005). Evaluation of NSD2 and NSD3 in overgrowth syndromes. Eur. J. Hum. Genet 13, 150–153. [DOI] [PubMed] [Google Scholar]
- Emran AA, Chatterjee A, Rodger EJ, Tiffen JC, Gallagher SJ, Eccles MR, and Hersey P (2019). Targeting DNA methylation and EZH2 activity to overcome melanoma resistance to immunotherapy. Trends Immunol 40, 328–344. [DOI] [PubMed] [Google Scholar]
- Enríquez P (2016). CRISPR-mediated epigenome editing. Yale J. Biol. Med 89, 471–486. [PMC free article] [PubMed] [Google Scholar]
- Ezponda T, Popovic R, Shah MY, Martinez-Garcia E, Zheng Y, Min DJ, Will C, Neri A, Kelleher NL, Yu J, and Licht JD (2013). The histone methyltransferase MMSET/WHSC1 activates TWIST1 to promote an epithelial-mesenchymal transition and invasive properties of prostate cancer. Oncogene 32, 2882–2890. [DOI] [PMC free article] [PubMed] [Google Scholar]
- Fakhry C, Westra WH, Li S, Cmelak A, Ridge JA, Pinto H, Forastiere A, and Gillison ML (2008). Improved survival of patients with human papillomavirus-positive head and neck squamous cell carcinoma in a prospective clinical trial. J. Natl. Cancer Inst 100, 261–269. [DOI] [PubMed] [Google Scholar]
- Farquhar DR, Divaris K, Mazul AL, Weissler MC, Zevallos JP, and Olshan AF (2017). Poor oral health affects survival in head and neck cancer. Oral Oncol 73, 111–117. [DOI] [PMC free article] [PubMed] [Google Scholar]
- Fishilevich S, Nudel R, Rappaport N, Hadar R, Plaschkes I, Iny Stein T, Rosen N, Kohn A, Twik M, Safran M, et al. (2017). GeneHancer: genome-wide integration of enhancers and target genes in GeneCards. Database (Oxford) 2017, bax028. [DOI] [PMC free article] [PubMed] [Google Scholar]
- Fleming JC, Woo J, Moutasim K, Mellone M, Frampton SJ, Mead A, Ahmed W, Wood O, Robinson H, Ward M, et al. (2019). HPV, tumour metabolism and novel target identification in head and neck squamous cell carcinoma. Br. J. Cancer 120, 356–367. [DOI] [PMC free article] [PubMed] [Google Scholar]
- Frankish A, Diekhans M, Ferreira A-M, Johnson R, Jungreis I, Loveland J, Mudge JM, Sisu C, Wright J, Armstrong J, et al. (2019). GENCODE reference annotation for the human and mouse genomes. Nucleic Acids Res 47 (D1), D766–D773. [DOI] [PMC free article] [PubMed] [Google Scholar]
- García-Carpizo V, Sarmentero J, Han B, Graña O, Ruiz-Llorente S, Pisano DG, Serrano M, Brooks HB, Campbell RM, and Barrero MJ (2016). NSD2 contributes to oncogenic RAS-driven transcription in lung cancer cells through long-range epigenetic activation. Sci. Rep 6, 32952. [DOI] [PMC free article] [PubMed] [Google Scholar]
- Gevaert O, Tibshirani R, and Plevritis SK (2015). Pancancer analysis of DNA methylation-driven genes using MethylMix. Genome Biol 16, 17. [DOI] [PMC free article] [PubMed] [Google Scholar]
- Gillison ML, Koch WM, Capone RB, Spafford M, Westra WH, Wu L, Zahurak ML, Daniel RW, Viglione M, Symer DE, et al. (2000). Evidence for a causal association between human papillomavirus and a subset of head and neck cancers. J. Natl. Cancer Inst 92, 709–720. [DOI] [PubMed] [Google Scholar]
- Han X, Piao L, Yuan X, Wang L, Liu Z, and He X (2019). Knockdown of NSD2 suppresses renal cell carcinoma metastasis by inhibiting epithelial-mesenchymal transition. Int. J. Med. Sci 16, 1404–1411. [DOI] [PMC free article] [PubMed] [Google Scholar]
- Hart T, Komori HK, LaMere S, Podshivalova K, and Salomon DR (2013). Finding the active genes in deep RNA-seq gene expression studies. BMC Genomics 14, 778. [DOI] [PMC free article] [PubMed] [Google Scholar]
- Hashim D, Sartori S, Brennan P, Curado MP, Wünsch-Filho V, Divaris K, Olshan AF, Zevallos JP, Winn DM, Franceschi S, et al. (2016). The role of oral hygiene in head and neck cancer: results from International Head and Neck Cancer Epidemiology (INHANCE) consortium. Ann. Oncol 27, 1619–1625. [DOI] [PMC free article] [PubMed] [Google Scholar]
- Heinz S, Benner C, Spann N, Bertolino E, Lin YC, Laslo P, Cheng JX, Murre C, Singh H, and Glass CK (2010). Simple combinations of lineage-determining transcription factors prime cis-regulatory elements required for macrophage and B cell identities. Mol. Cell 38, 576–589. [DOI] [PMC free article] [PubMed] [Google Scholar]
- Herz HM, Garruss A, and Shilatifard A (2013). SET for life: biochemical activities and biological functions of SET domain-containing proteins. Trends Biochem. Sci 38, 621–639. [DOI] [PMC free article] [PubMed] [Google Scholar]
- Huang N, vom Baur E, Garnier JM, Lerouge T, Vonesch JL, Lutz Y, Chambon P, and Losson R (1998). Two distinct nuclear receptor interaction domains in NSD1, a novel SET protein that exhibits characteristics of both corepressors and coactivators. EMBO J 17, 3398–3412. [DOI] [PMC free article] [PubMed] [Google Scholar]
- Hunter JD (2007). Matplotlib: a 2D graphics environment. Comput. Sci. Eng 9, 90–95. [Google Scholar]
- Jaffe JD, Wang Y, Chan HM, Zhang J, Huether R, Kryukov GV, Bhang HE, Taylor JE, Hu M, Englund NP, et al. (2013). Global chromatin profiling reveals NSD2 mutations in pediatric acute lymphoblastic leukemia. Nat. Genet 45, 1386–1391. [DOI] [PMC free article] [PubMed] [Google Scholar]
- Jaju RJ, Fidler C, Haas OA, Strickson AJ, Watkins F, Clark K, Cross NC, Cheng JF, Aplan PD, Kearney L, et al. (2001). A novel gene, NSD1, is fused to NUP98 in the t(5;11)(q35;p15.5) in de novo childhood acute myeloid leukemia. Blood 98, 1264–1267. [DOI] [PubMed] [Google Scholar]
- Ji Z, He L, Regev A, and Struhl K (2019). Inflammatory regulatory network mediated by the joint action of NF-kB, STAT3, and AP-1 factors is involved in many human cancers. Proc. Natl. Acad. Sci. USA 116, 9453–9462. [DOI] [PMC free article] [PubMed] [Google Scholar]
- Jin B, Li Y, and Robertson KD (2011). DNA methylation: superior or subordinate in the epigenetic hierarchy? Genes Cancer 2, 607–617. [DOI] [PMC free article] [PubMed] [Google Scholar]
- Jones PA, and Baylin SB (2002). The fundamental role of epigenetic events in cancer. Nat. Rev. Genet 3, 415–428. [DOI] [PubMed] [Google Scholar]
- King KE, and Weinberg WC (2007). p63: defining roles in morphogenesis, homeostasis, and neoplasia of the epidermis. Mol. Carcinog 46, 716–724. [DOI] [PubMed] [Google Scholar]
- Kolde R, Laur S, Adler P, and Vilo J (2012). Robust rank aggregation for gene list integration and meta-analysis. Bioinformatics 28, 573–580. [DOI] [PMC free article] [PubMed] [Google Scholar]
- Korotkevich G, Sukhov V, and Sergushichev A (2019). Fast gene set enrichment analysis. bioRxiv, 060012. [Google Scholar]
- Kurotaki N, Imaizumi K, Harada N, Masuno M, Kondoh T, Nagai T, Ohashi H, Naritomi K, Tsukahara M, Makita Y, et al. (2002). Haploinsufficiency of NSD1 causes Sotos syndrome. Nat. Genet 30, 365–366. [DOI] [PubMed] [Google Scholar]
- Lhoumaud P, Badri S, Rodriguez-Hernaez J, Sakellaropoulos T, Sethia G, Kloetgen A, Cornwell M, Bhattacharyya S, Ay F, Bonneau R, et al. (2019). NSD2 overexpression drives clustered chromatin and transcriptional changes in a subset of insulated domains. Nat. Commun 10, 4843. [DOI] [PMC free article] [PubMed] [Google Scholar]
- Li H, and Durbin R (2009). Fast and accurate short read alignment with Burrows-Wheeler transform. Bioinformatics 25, 1754–1760. [DOI] [PMC free article] [PubMed] [Google Scholar]
- Liberzon A, Birger C, Thorvaldsdóttir H, Ghandi M, Mesirov JP, and Tamayo P (2015). The Molecular Signatures Database (MSigDB) hallmark gene set collection. Cell Syst 1, 417–425. [DOI] [PMC free article] [PubMed] [Google Scholar]
- Love MI, Huber W, and Anders S (2014). Moderated estimation of fold change and dispersion for RNA-seq data with DESeq2. Genome Biol 15, 550. [DOI] [PMC free article] [PubMed] [Google Scholar]
- Lu C, Jain SU, Hoelper D, Bechet D, Molden RC, Ran L, Murphy D, Venneti S, Hameed M, Pawel BR, et al. (2016). Histone H3K36 mutations promote sarcomagenesis through altered histone methylation landscape. Science 352, 844–849. [DOI] [PMC free article] [PubMed] [Google Scholar]
- Majchrzak E, Szybiak B, Wegner A, Pienkowski P, Pazdrowski J, Luczewski L, Sowka M, Golusinski P, Malicki J, and Golusinski W (2014). Oral cavity and oropharyngeal squamous cell carcinoma in young adults: a review of the literature. Radiol. Oncol 48, 1–10. [DOI] [PMC free article] [PubMed] [Google Scholar]
- McInnes L, Healy J, and Astels S (2017). hdbscan: hierarchical density based clustering. J. Open Source Softw 2, 205. [Google Scholar]
- Mootha VK, Lindgren CM, Eriksson KF, Subramanian A, Sihag S, Lehar J, Puigserver P, Carlsson E, Ridderstråle M, Laurila E, et al. (2003). PGC-1alpha-responsive genes involved in oxidative phosphorylation are coordinately downregulated in human diabetes. Nat. Genet 34, 267–273. [DOI] [PubMed] [Google Scholar]
- Oyer JA, Huang X, Zheng Y, Shim J, Ezponda T, Carpenter Z, Allegretta M, Okot-Kotber CI, Patel JP, Melnick A, et al. (2014). Point mutation E1099K in MMSET/NSD2 enhances its methyltranferase activity and leads to altered global chromatin methylation in lymphoid malignancies. Leukemia 28, 198–201. [DOI] [PMC free article] [PubMed] [Google Scholar]
- Pan C, Izreig S, Yarbrough WG, and Issaeva N (2019). NSD1 mutations by HPV status in head and neck cancer: differences in survival and response to DNA-damaging agents. Cancers Head Neck 4, 3. [DOI] [PMC free article] [PubMed] [Google Scholar]
- Papillon-Cavanagh S, Lu C, Gayden T, Mikael LG, Bechet D, Karamboulas C, Ailles L, Karamchandani J, Marchione DM, Garcia BA, et al. (2017). Impaired H3K36 methylation defines a subset of head and neck squamous cell carcinomas. Nat. Genet 49, 180–185. [DOI] [PMC free article] [PubMed] [Google Scholar]
- Patro R, Duggal G, Love MI, Irizarry RA, and Kingsford C (2017). Salmon provides fast and bias-aware quantification of transcript expression. Nat. Methods 14, 417–419. [DOI] [PMC free article] [PubMed] [Google Scholar]
- Peri S, Izumchenko E, Schubert AD, Slifker MJ, Ruth K, Serebriiskii IG, Guo T, Burtness BA, Mehra R, Ross EA, et al. (2017). NSD1- and NSD2-damaging mutations define a subset of laryngeal tumors with favorable prognosis. Nat. Commun 8, 1772. [DOI] [PMC free article] [PubMed] [Google Scholar]
- Pfister DG, Spencer S, Brizel DM, Burtness B, Busse PM, Caudell JJ, Cmelak AJ, Colevas AD, Dunphy F, Eisele DW, et al. (2015). Head and neck cancers, version 1.2015. J. Natl. Compr. Canc. Netw 13, 847–855, quiz 856. [DOI] [PMC free article] [PubMed] [Google Scholar]
- Qiao Q, Li Y, Chen Z, Wang M, Reinberg D, and Xu RM (2011). The structure of NSD1 reveals an autoregulatory mechanism underlying histone H3K36 methylation. J. Biol. Chem 286, 8361–8368. [DOI] [PMC free article] [PubMed] [Google Scholar]
- Quinlan AR, and Hall IM (2010). BEDTools: a flexible suite of utilities for comparing genomic features. Bioinformatics 26, 841–842. [DOI] [PMC free article] [PubMed] [Google Scholar]
- Ramírez F, Ryan DP, Grüning B, Bhardwaj V, Kilpert F, Richter AS, Heyne S, Dündar F, and Manke T (2016). deepTools2: a next generation web server for deep-sequencing data analysis. Nucleic Acids Res 44 (W1), W160–W165. [DOI] [PMC free article] [PubMed] [Google Scholar]
- Ramírez F, Bhardwaj V, Arrigoni L, Lam KC, Grüning BA, Villaveces J, Habermann B, Akhtar A, and Manke T (2018). High-resolution TADs reveal DNA sequences underlying genome organization in flies. Nat. Commun 9, 189. [DOI] [PMC free article] [PubMed] [Google Scholar]
- Rauch A, Schellmoser S, Kraus C, Dörr HG, Trautmann U, Altherr MR, Pfeiffer RA, and Reis A (2001). First known microdeletion within the Wolf-Hirschhorn syndrome critical region refines genotype-phenotype correlation. Am. J. Med. Genet 99, 338–342. [DOI] [PubMed] [Google Scholar]
- Ritchie ME, Phipson B, Wu D, Hu Y, Law CW, Shi W, and Smyth GK (2015). limma powers differential expression analyses for RNA-sequencing and microarray studies. Nucleic Acids Res 43, e47. [DOI] [PMC free article] [PubMed] [Google Scholar]
- Robinson JT, Thorvaldsdóttir H, Winckler W, Guttman M, Lander ES, Getz G, and Mesirov JP (2011). Integrative genomics viewer. Nat. Biotechnol 29, 24–26. [DOI] [PMC free article] [PubMed] [Google Scholar]
- Rona GB, Eleutherio ECA, and Pinheiro AS (2016). PWWP domains and their modes of sensing DNA and histone methylated lysines. Biophys. Rev 8, 63–74. [DOI] [PMC free article] [PubMed] [Google Scholar]
- Ross-Innes CS, Stark R, Teschendorff AE, Holmes KA, Ali HR, Dunning MJ, Brown GD, Gojis O, Ellis IO, Green AR, et al. (2012). Differential oestrogen receptor binding is associated with clinical outcome in breast cancer. Nature 481, 389–393. [DOI] [PMC free article] [PubMed] [Google Scholar]
- Saloura V, Izumchenko E, Zuo Z, Bao R, Korzinkin M, Ozerov I, Zhavoronkov A, Sidransky D, Bedi A, Hoque MO, et al. (2019). Immune profiles in primary squamous cell carcinoma of the head and neck. Oral Oncol 96, 77–88. [DOI] [PMC free article] [PubMed] [Google Scholar]
- Seiwert TY, Zuo Z, Keck MK, Khattri A, Pedamallu CS, Stricker T, Brown C, Pugh TJ, Stojanov P, Cho J, et al. (2015). Integrative and comparative genomic analysis of HPV-positive and HPV-negative head and neck squamous cell carcinomas. Clin. Cancer Res 21, 632–641. [DOI] [PMC free article] [PubMed] [Google Scholar]
- Serefidou M, Venkatasubramani AV, and Imhof A (2019). The impact of one carbon metabolism on histone methylation. Front. Genet 10, 764. [DOI] [PMC free article] [PubMed] [Google Scholar]
- Sheffield NC, and Bock C (2016). LOLA: enrichment analysis for genomic region sets and regulatory elements in R and Bioconductor. Bioinformatics 32, 587–589. [DOI] [PMC free article] [PubMed] [Google Scholar]
- Sidoli S, Bhanu NV, Karch KR, Wang X, and Garcia BA (2016). Complete workflow for analysis of histone post-translational modifications using bottom-up mass spectrometry: from histone extraction to data analysis. J. Vis. Exp, 54112. [DOI] [PMC free article] [PubMed] [Google Scholar]
- Staff PM; PLOS Medicine Staff (2015). Correction: intra-tumor genetic heterogeneity and mortality in head and neck cancer: analysis of data from the Cancer Genome Atlas. PLoS Med 12, e1001818. [DOI] [PMC free article] [PubMed] [Google Scholar]
- Streubel G, Watson A, Jammula SG, Scelfo A, Fitzpatrick DJ, Oliviero G, McCole R, Conway E, Glancy E, Negri GL, et al. (2018). The H3K36me2 methyltransferase Nsd1 demarcates PRC2-mediated H3K27me2 and H3K27me3 domains in embryonic stem cells. Mol. Cell 70, 371–379. e5. [DOI] [PubMed] [Google Scholar]
- Subramanian A, Tamayo P, Mootha VK, Mukherjee S, Ebert BL, Gillette MA, Paulovich A, Pomeroy SL, Golub TR, Lander ES, and Mesirov JP (2005). Gene set enrichment analysis: a knowledge-based approach for interpreting genome-wide expression profiles. Proc. Natl. Acad. Sci. USA 102, 15545–15550. [DOI] [PMC free article] [PubMed] [Google Scholar]
- Suderman M, Staley JR, French R, Arathimos R, Simpkin A, and Tilling K (2018). dmrff: identifying differentially methylated regions efficiently with power and control. bioRxiv, 508556. [Google Scholar]
- Tatton-Brown K, and Rahman N (2013). The NSD1 and EZH2 overgrowth genes, similarities and differences. Am. J. Med. Genet. C. Semin. Med. Genet 163C, 86–91. [DOI] [PMC free article] [PubMed] [Google Scholar]
- Van Rossum G, and Drake FL (2009). Python 3 Reference Manual (Create-Space; ). [Google Scholar]
- Vann WF Jr., Lee JY, Baker D, and Divaris K (2010). Oral health literacy among female caregivers: impact on oral health outcomes in early childhood. J. Dent. Res 89, 1395–1400. [DOI] [PMC free article] [PubMed] [Google Scholar]
- Visser R, Landman EB, Goeman J, Wit JM, and Karperien M (2012). Sotos syndrome is associated with deregulation of the MAPK/ERK-signaling pathway. PLoS ONE 7, e49229. [DOI] [PMC free article] [PubMed] [Google Scholar]
- Wagih O (2017). ggseqlogo: a versatile R package for drawing sequence logos. Bioinformatics 33, 3645–3647. [DOI] [PubMed] [Google Scholar]
- Wang GG, Cai L, Pasillas MP, and Kamps MP (2007). NUP98-NSD1 links H3K36 methylation to Hox-A gene activation and leukaemogenesis. Nat. Cell Biol 9, 804–812. [DOI] [PubMed] [Google Scholar]
- Weinberg DN, Papillon-Cavanagh S, Chen H, Yue Y, Chen X, Rajagopalan KN, Horth C, McGuire JT, Xu X, Nikbakht H, et al. (2019). The histone mark H3K36me2 recruits DNMT3A and shapes the intergenic DNA methylation landscape. Nature 573, 281–286. [DOI] [PMC free article] [PubMed] [Google Scholar]
- Wickham H (2009). Ggplot2: Elegant Graphics for Data Analysis (Springer; ). [Google Scholar]
- Yates AD, Achuthan P, Akanni W, Allen J, Allen J, Alvarez-Jarreta J, Amode MR, Armean IM, Azov AG, Bennett R, et al. (2020). Ensembl 2020. Nucleic Acids Res 48 (D1), D682–D688. [DOI] [PMC free article] [PubMed] [Google Scholar]
- Yu G, Wang LG, and He QY (2015). ChIPseeker: an R/Bioconductor package for ChIP peak annotation, comparison and visualization. Bioinformatics 31, 2382–2383. [DOI] [PubMed] [Google Scholar]
- Yuan ZF, Sidoli S, Marchione DM, Simithy J, Janssen KA, Szurgot MR, and Garcia BA (2018). EpiProfile 2.0: a computational platform for processing epi-proteomics mass spectrometry data. J. Proteome Res 17, 2533–2541. [DOI] [PMC free article] [PubMed] [Google Scholar]
- Yuan S, Natesan R, Sanchez-Rivera FJ, Li J, Bhanu NV, Yamazoe T, Lin JH, Merrell AJ, Sela Y, Thomas SK, et al. (2020). Global regulation of the histone mark H3K36me2 underlies epithelial plasticity and metastatic progression. Cancer Discov 10, 854–871. [DOI] [PMC free article] [PubMed] [Google Scholar]
- Zaravinos A (2014). An updated overview of HPV-associated head and neck carcinomas. Oncotarget 5, 3956–3969. [DOI] [PMC free article] [PubMed] [Google Scholar]
- Zerbino DR, Wilder SP, Johnson N, Juettemann T, and Flicek PR (2015). The ensembl regulatory build. Genome Biol 16, 56. [DOI] [PMC free article] [PubMed] [Google Scholar]
- Zhang Y, Liu T, Meyer CA, Eeckhoute J, Johnson DS, Bernstein BE, Nusbaum C, Myers RM, Brown M, Li W, and Liu XS (2008). Model-based analysis of ChIP-seq (MACS). Genome Biol 9, R137. [DOI] [PMC free article] [PubMed] [Google Scholar]
- Zhu A, Ibrahim JG, and Love MI (2019). Heavy-tailed prior distributions for sequence count data: removing the noise and preserving large differences. Bioinformatics 35, 2084–2092. [DOI] [PMC free article] [PubMed] [Google Scholar]
Associated Data
This section collects any data citations, data availability statements, or supplementary materials included in this article.
Supplementary Materials
Data Availability Statement
The accession number for the WGBS data, RNA-seq data, and ChIP-seq data for histone H3 post-translational modifications in human head and neck squamous cell carcinoma cell lines reported in this paper isNCBI GEO: GSE149670.
Custom scripts used to generate the results and figures are also available at https://github.com/bhu/hnscc_nsd1.
All other relevant data supporting the key findings of this study are available within the article and its Supplemental information files.