Abstract
Pyocyanin (PYO) is one of many toxins secreted by the opportunistic human pathogenic bacterium Pseudomonas aeruginosa. Direct detection of PYO in biofilms is crucial because PYO can provide important information about infection-related virulence mechanisms in P. aeruginosa. Because PYO is both redox-active and Raman-active, we seek to simultaneously acquire both spectroscopic and redox state information about PYO. The combination of surface-enhanced Raman spectroscopy (SERS) and voltammetry is used here to provide insights into the molecular redox behavior of PYO while controlling the SERS and electrochemical (EC) response of PYO with external stimuli, such as pH and applied potential. Furthermore, PYO secretion from biofilms of different P. aeruginosa strains is compared. Both SERS spectra and EC behavior are observed to change with pH, and several pH-dependent bands are identified in the SERS spectra, which can potentially be used to probe the local environment. Comparison of the voltammetric behavior of wild-type and a PYO-deficient mutant unequivocally identifies PYO as a major component of the secretome. Spectroelectrochemical studies of the PYO standard reveal decreasing SERS intensities of PYO bands under reducing conditions. Extending these experiments to pellicle biofilms shows similar behavior with applied potential, and SERS imaging indicates that secreted PYO is localized in regions approximately the size of P. aeruginosa cells. The in situ spectroelectrochemical biofilm characterization approach developed here suggests that EC–SERS monitoring of secreted molecules can be used diagnostically and correlated with the progress of infection.
Keywords: Biofilms, Infectious diseases, Redox reactions, Bacteria, Raman spectroscopy
Graphical Abstract
INTRODUCTION
In natural and clinical settings, bacteria commonly grow as surface-attached biofilms—highly structured surface-associated communities, in which most bacteria are sessile and encased by a matrix composed of extracellular polymeric substances (EPSs). Such biofilms are known to resist the action of antibiotics1 as well as body’s natural immune response,2-4 allowing for the high rates of morbidity and mortality associated with Pseudomonas aeruginosa infections.5
P. aeruginosa biofilms are known to secrete numerous molecules including phenazines,6 a class of redox-active heterocyclic small-molecule metabolites,7 which are also diffusible quorum-sensing molecules used by bacteria to regulate gene expression in response to population density.8. Phenazines have also been implicated in several functions critical to the survival of the bacteria, such as biofilm formation and growth. Among the phenazines, the blue pigment pyocyanin, (5-N-methyl-1-hydroxy-phenazine, PYO) is widely studied because it plays a primary role in pathogenesis,9 and it serves as a main virulence factor of P. aeruginosa.10 The presence of PYO in the cystic fibrosis lung has been directly correlated to lung damage.10 A significant factor which suggests the use of PYO as an infection biomarker is that it may be produced prior to virulent colonization; therefore, it may be detectable before hospital-contracted infections become symptomatic.11,12 Therefore, in addition to its general utility in following the development of P. aeruginosa communities, early detection of PYO, signaling the presence of P. aeruginosa infection, could be used as an advance indication for the application of antibiotic treatment at the presymptomatic onset of infection.11 Despite the promise of PYO as an early biomarker of infection, its detection is challenging, principally because the matrix in which PYO is secreted is a complex mixture of bacterial cells, EPS, and a host of chemical messengers, all contained within a surface-associated complex, the biofilm, which complicates its direct detection.
Properties of PYO (as shown in Scheme 1) suggest that it may be possible to follow its behavior spectroelectrochemically. Electrochemical (EC) measurements are attractive because they are rapid, sensitive, and inexpensive,13 allowing in situ monitoring of the redox states of target molecules,14 and they can be used to extract quantitative information about electroactive species, even in complex sample matrices.15 Previous studies have reported EC detection of PYO at varying concentrations12 and pH values,14 and it is known to be secreted in P. aeruginosa biofilms functioning under a wide range of conditions.16-19 However, EC detection provides relatively little chemical identification information,15 which is required for comprehensive chemical characterization of complex samples. Thus, it makes sense to couple the sensitivity and robustness of EC detection with a more information-rich spectroscopy method to allow characterization of behavior within surface-associated communities over spatiotemporal scales.
Scheme 1.
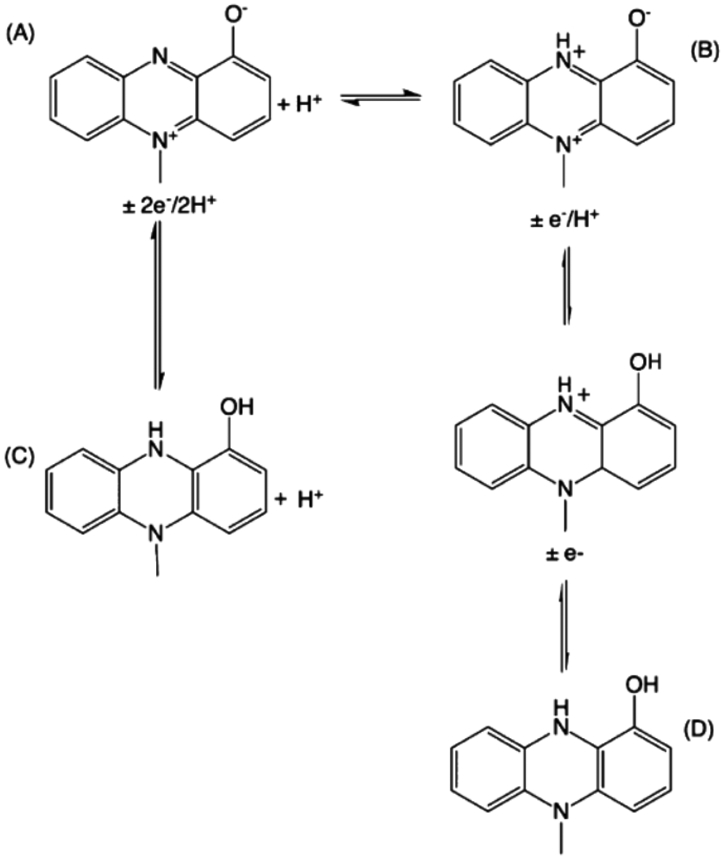
Postulated Redox Reactions of Oxidized (A) and Reduced (C) PYO in Basic Conditions and Oxidized (B) and Reduced (D) PYO in Acidic Conditions
Surface-enhanced Raman scattering (SERS) is a powerful method with the ability to identify elements of the bacterial secretome using the unique Raman fingerprint in the 400–1800 cm−1 region.10,20-22 In addition, SERS produces enhanced signals that lower detection limits relative to unenhanced Raman scattering, making it a powerful tool for investigating species in situ in complex matrices.15 SERS has been applied extensively to studies of biological samples, and it is a particularly powerful tool for detecting and characterizing microorganisms.23,24 Moreover, SERS imaging offers the possibility of acquiring spatial information about the chemical compositions of complex samples.25 Recently, SERS imaging of PYO from the P. aeruginosa biofilm communities on fabricated plasmonic substrates has been reported.26 Moreover, numerous studies have successfully used Raman imaging to analyze secreted molecules from the bacterial communities, such as biofilms, swarming communities, bacteria under antibiotic stress, and cocultures.5,10 Additionally, recent studies have extended the power of spatiotemporal mapping in microbial communities by combining SERS imaging and principal component analysis (PCA) in order to identify mechanisms of chemical communication in heterogenous biological samples.5,10,27 In addition to SERS, other label-free, multiplex imaging techniques, such as mass spectrometry imaging, have also been employed to visualize components of the microbial secretome, such as metabolites, lipids, and other chemical messengers.28-31
In order to realize the potential of combined EC and SERS measurements for the detection and characterization of PYO and other virulence factors in bacterial communities, in general, and P. aeruginosa, in particular, it is necessary to map out the response surface as a function of pH and applied EC potential for both model and bacteria-derived PYO. Here, we first characterize the potential- and pH-dependent SERS behavior of PYO in model systems. With this information in-hand, we proceed to characterize PYO secreted by different P. aeruginosa strain-derived biofilms, using a combination of SERS and voltammetric methods applied in situ, that is, under oxygen-rich conditions.
EXPERIMENTAL SECTION
Chemicals and Materials.
PYO, KNO3, Ag nanoparticles (AgNPs), and HPLC-grade ethanol were purchased (Sigma-Aldrich, St. Louis, MO) as were Si substrates (WRS Materials, San Jose, CA). Copper wire was obtained from Digi-Key, Thief River Falls, MN. All aqueous solutions for EC measurements were prepared using deionized (DI) water (18.2 MΩ cm, Millipore Milli-Q system).
Raman Measurements.
SERS was performed on a laser scanning confocal Raman microscope (Alpha 300R, WITec GmbH), as previously reported.10 Laser excitation at 532 nm was provided by a doubled Nd:YAG laser. SERS spectra and images were obtained using either a Nikon 40X air objective (NA 0.6) or water immersion 60X objective (NA 1.0). SERS images of biofilms were obtained by acquiring a Raman spectrum from each image pixel (60 X 60 pixels or 3600 spectra) over either a 15 μm X 15 μm or a 10 μm X 10 μm region on the sample with an integration time of 100 ms per spectrum. Individual SERS spectra were acquired using an integration time of 0.5 s and averaging 10 accumulations. Concentrated 40 nm AgNPs were deposited onto cured gold pastes on disposable screen-printed devices, which were used as substrates to increase the SERS signal. Previously developed MATLAB procedures were used to pretreat the SERS spectra and perform PCA on image data.16 This analysis yields a number of components, ordered according to the magnitude of their contribution to the signal variance. The first and second strongest components from this analysis, PC1 and PC2, were identified and rendered as loading plots (score vs Raman shift). Heat maps showing the spatial distribution of PC1 and PC2 scores were then plotted.
EC Measurements.
Disposable screen-printed electrodes (220BT) were purchased from DropSens (Oviedo, Spain). Each substrate consisted of a 4 mm Au working electrode, Au counter electrode, and Ag reference electrode. EC measurements were performed using a CHI 842C potentiostat, (CH Instruments, Austin, TX). Working and counter electrodes from the screen-printed device were connected with copper wire to the potentiostat. A proximal Ag/AgCl reference electrode and 60 mM KNO3 supporting electrolyte were used for all experiments, and pH was adjusted using citrate buffer. A 6 mm thick polydimethylsiloxane monolith was used to cover the sensing surface and to hold the reference electrode in place. The scan rate was 100 mV s−1 for all cyclic voltammetry (CV) experiments, and square-wave voltammetry (SWV) was accomplished by sweeping the potential from −0.8 to 0.0 V in 4 mV increments, with an amplitude of 25 mV and frequency of 15 Hz.
Sample Preparation.
Pellicle biofilms were grown following a previously described protocol.10 Biofilms were obtained from P. aeruginosa strains PA14 wt (clinical isolate strain),32 FRD1 (mucoid, cystic fibrosis isolated strain),33 and PA14 phenazine null mutants (Δphz).34 Cell cultures were grown in 6 mL of FAB medium with 30 mM glucose at 37 °C with shaking at 240 rpm overnight. Pellicle biofilms were incubated at 37 °C in a test tube with 6 mL of FAB medium with 150 μL of 1.2 M glucose, containing 200 μL of overnight broth culture (OD600 = 1) for 120 and 48 h for PA14 and FRD1 strains, respectively. For non-EC SERS detection, pellicle biofilms were transferred to Si, after which twice the volume of a 90 pM solution of 40 nm AgNP solution was added, and the sample was dried overnight in the dark at room temperature.
RESULTS AND DISCUSSION
EC Characterization of PYO as a Function of pH.
The EC response of PYO as a function of pH has been described previously.12,14,35 Figure S1 shows CVs of PYO at pH 2, 5, and 7. As expected, the redox peak potential shifts linearly to more positive potentials with pH exhibiting a slope, ΔE/ΔpH =−63.8 ± 2.1 mV/pH unit, which is close to the theoretical Nernstian value of the −59 mV/pH unit.35 Unlike PYO at pH 5 and 7, the CV of PYO in the acidic form at pH 2 clearly shows two well-defined oxidation and reduction peaks. At pH values higher than its pKa ≈ 4.9, PYO exhibits a single 2e−/2H+ transition which shows up as one reversible peak.35 At pH values below PYO pKa, the redox peak starts to broaden, ultimately spitting into two separate peaks. In this state, the position of the redox peak at more positive potential is pH-dependent and is associated with a 1e−/1H+ transition, while the more negative redox peak is pH-independent, indicating that it involves a pure 1e− transfer.35,36 The two pH-dependent paths are summarized in Scheme 1.
SERS Characterization of PYO as a Function of pH.
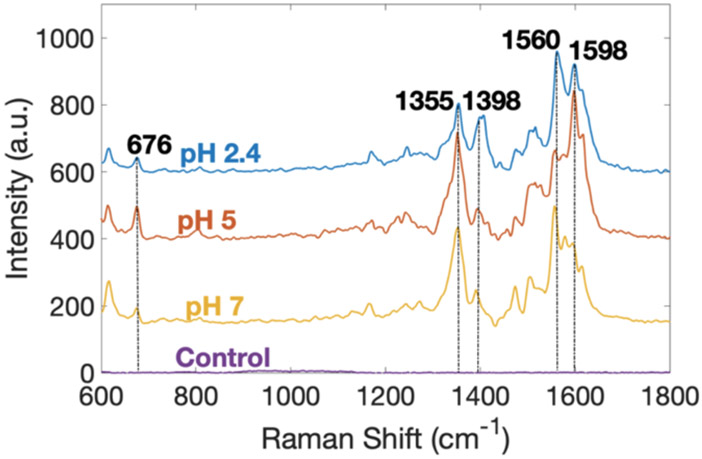
In order to characterize the SERS spectra of PYO in a system poised for spectroelectrochemical measurements, a solution containing 500 μM in PYO and 900 pM in 40 nm AgNP was added to the working electrode of a screen-printed device. Figure 1 displays SERS spectra of PYO at pH 2.4, 5, and 7. Distinctive SERS peaks at 676, 1355, 1560, and 1598 cm−1 clearly characterize the presence of PYO, as described by referring to previously cited vibrational mode assignments. 8,26,36,37 The bands near 1355 and 1398 cm−1 have been assigned to complex modes involving C–C stretching and in-plane C–H bending (with some C–N stretching contribution at 1355 cm−1) of the central aromatic ring,8 and peaks at 676, 1560, and 1598 cm−1 arise from ring deformations.36 The main differences in the SERS spectra of PYO as a function of pH are (a) lower intensity of the 1355 cm−1 peak and (b) the appearance of a moderately strong peak near 1398 cm−1 at acidic pH values. The electronic structure of PYO at higher pH especially the electron density in the center ring, Scheme 1A, is disrupted in acidic states, Scheme 1B, due to proton exchange, which is likely responsible for the changes in the SERS intensities at 1355 and 1398 cm−1. These model compound data make it clear that the SERS spectra reflect the effects of pH of the local environment.
Figure 1.
Averaged SERS spectra of PYO at pH 2.4 (blue), 5 (red), 7 (yellow), and control spectrum (purple). Five spectra were averaged for each pHs. The control spectrum was acquired using the same concentrations of ethanol and AgNP but without PYO.
SERS Characterization of PYO as a Function of Potential.
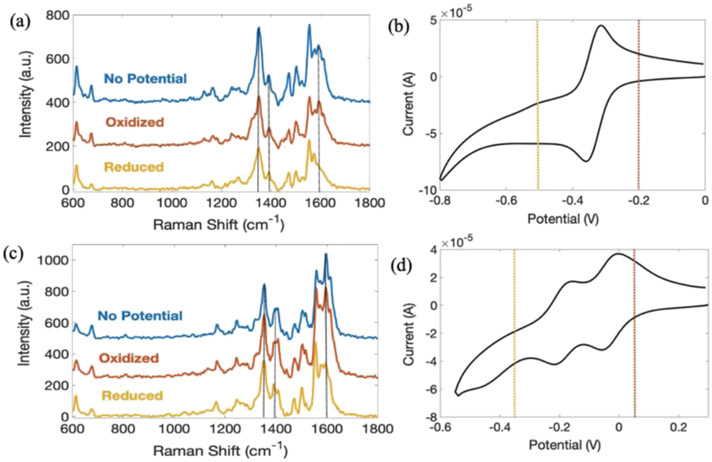
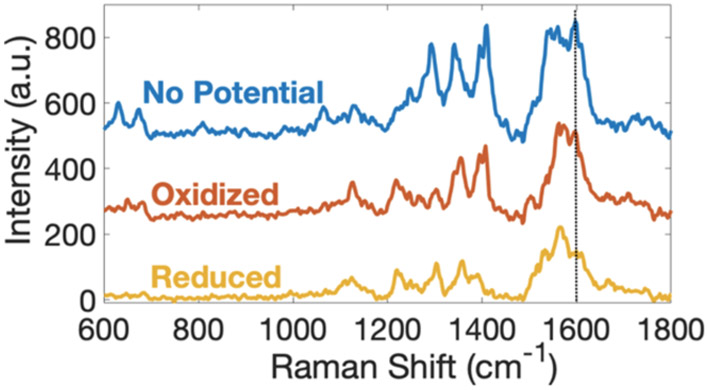
SERS spectra of PYO model systems were also acquired as a function of applied potential, as shown in Figure 2. It is immediately evident that the control, that is “no potential”, SERS spectra without applied potential are almost identical to the oxidized spectra in Figure 2a,c, at pH 7 and pH 2.4, respectively. This confirms that PYO is initially in its oxidized form in the laboratory ambient, as would be expected in an O2-containing atmosphere. However, when reducing potentials are applied to the sample, the SERS intensity at 1598 cm−1, black dashed line in Figure 2a,c, significantly decreases at both pH 7 and pH 2.4. Comparing the oxidized form of PYO, Scheme 1A,B, to the reduced form, Scheme 1C,D, clearly shows that the conjugation of the ring structure is decreased upon reduction, consistent with the decrease in intensity of the 1598 cm−1 peak ring deformation mode in the reduced form. Interestingly, the 1398 cm−1 band, which is ascribed to a pH-dependent mode, changes very little with applied potential, making it possible to independently assess the effect of pH and applied potential on SERS spectra. Interestingly, the acidic pathway shows an intermediate redox state, and SERS spectra acquired at potential intermediate between the fully oxidized and fully reduced acid form, Figure S2, are distinct from either fully oxidized or fully reduced forms.
Figure 2.
SERS spectra of PYO at pH 7 (a) and pH 2.4 (c) as a function of applied potential and corresponding CV of PYO at pH 7 (b) and pH 2.4 (d). All spectra were obtained at an integration time of 0.5 s with 10 accumulations, and potentials were applied for 20 s. At pH 7, oxidizing potential, red dashed line in (b), Eox = −0.2 V, and reducing potential, yellow dashed line in (b), Ered = −0.5 V, both vs Ag/AgCl, were applied. At pH 2.4, oxidizing potential, red dashed line in (d), Eox = 0.05 V and reducing potential, yellow dashed line in (d), Ered = −0.35 V, both vs Ag/AgCl, were applied.
EC Characterization of PYO from P. aeruginosa Pellicle Biofilms.
To study PYO present in P. aeruginosa pellicle biofilms electrochemically, the biofilms were first formed in a test tube, and then carefully transferred to the working electrode of the screen-printed electrode assembly, along with the biofilm residue from the top of the broth and 60 mM KNO3 supporting electrolyte. SWV was used to characterize PYO production, as shown in Figure S4. First, the SWV of the PA14 wt pellicle biofilm with 100 μM standard PYO added confirms the assignment of the peak at ca. −0.25 V versus Ag/AgCl to PYO. Then, comparing the behavior between wild-type (wt) and mutant (Δphz) strains clearly indicates that PYO is secreted in pellicle biofilms derived from PA14 wt but not from those derived from the mutant Δphz strain. SWV of the FRD1 strain produces a wave shifted negative by ~30 mV relative to the positively identified PYO wave obtained from PA14 wt. This may be another phenazine, such as a precursor of PYO (vide infra). Independent of the exact origin, these data strongly suggest that PYO is produced in larger quantities from PA14 wt than the compound responsible for the −0.30 V wave in FRD1 biofilms, although the longer time (~120 h) needed for the PA14 wt strain to produce a pellicle biofilm, relative to FRD1 (48 h), may account for a part of the difference.
SERS Imaging of PYO in Pellicle Biofilms.
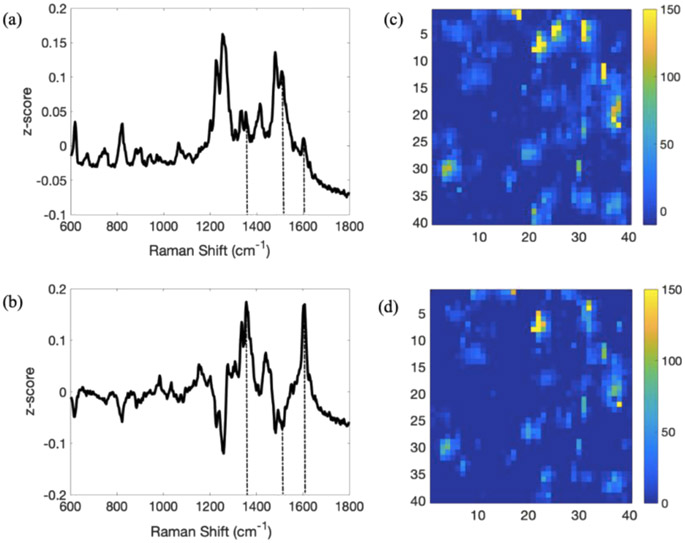
SERS imaging coupled with PCA is a powerful approach to obtain details of the chemical messaging behavior of complex multicomponent biological architectures, such as biofilms.10,28 PA14 wt and FRD1 pellicle biofilms, grown in glucose, secrete significant amounts of PYO, as shown as Figures 3 and 4. The first principal component of the 120 h pellicle biofilm from PA14 wt, Figure 3a, shows strong z-score features at ~1355 cm−1 (combined C–C and C–N stretch), 1511 cm−1 (ring deformation), and 1603 cm−1 (ring deformation),36 confirming the secretion of PYO by PA14 wt. In addition, large signals are observed in the range 1230–1300 cm−1 (amide III) and around 1482 cm−1 (adenine37), which may be assigned to non-PYO components of the EPS. Moreover, the PC heat maps in Figure 3c,d indicate that while substantial amounts of PYO exist over the entire imaged region, the high signal features are characteristically ca. 1–2 μm in the spatial extent, suggesting that under these conditions, secreted PYO remains localized near the bacterial cell from which it is derived. Finally, PC2 from the PA14 wt analysis shows features near 1600 cm−1, which were identified in 2 as being associated with oxidizing local environment, suggesting that this is the character of the local pellicle biofilm environment.
Figure 3.
PCA of the SERS images from a 120 h PA14 wt pellicle biofilm. (a,b) are PC1 and PC2 loading plots produced from the SERS image. Significant features at 1355, 1511, and 1603 cm−1 are marked with dashed vertical lines. (c,d) Heat maps of PC1 and PC2, respectively. The images in (c,d) are 10 μm X 10 μm.
Figure 4.
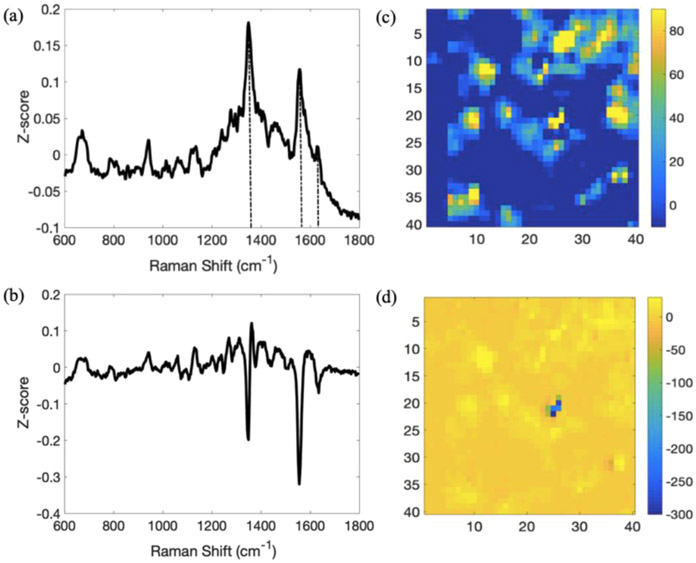
PCA of the SERS images from a 48 h FRD1 pellicle biofilm. (a,b) PC1 and PC2 loading plots produced from the SERS image. Significant features at 1351, 1560, and 1627 cm−1 in the PC1 loading plot are marked with dashed vertical lines. (c,d) Heat maps of PC1 and PC2, respectively. The images in (c,d) are 15 μm X 15 μm.
PCA of the 48 h FRD1 pellicle biofilm, Figure 4, shows both similarities and differences relative to the PCA of 120 h PA14 wt. PC1 presents distinct features at 1351, 1560, and 1627 cm−1. The first, and strongest feature at 1351 cm−1, matches reasonably well with the phenazine ring stretch (1355 cm−1) from PA14 wt. However, even though the bands at 1560 and 1627 cm−1 from the FRD1 sample align with previously published features of PYO (different ring deformations), they do not reproduce the strong features from the PCA of the PA14 wt SERS image.36 Furthermore, the SWV data, Figure S4, show that the wave obtained from FRD1 is shifted to more negative potentials by 30 mV—a small but significant shift. Taken together, the shift in the position of the SWV wave coupled with the distinct peaks in the SERS PCA analysis suggest that another component may be present in the FRD1 sample in sufficient quantities to determine the overall spectroelectrochemical behavior. Two possibilities, phenazine-1-carboxamide and phenazine-1-carboxylic acid, are sufficiently close in structure to be plausible. Finally, the PC heat map for PC1, Figure 4c, exhibits the same 1–2 μm in spatial extent features observed in the PA14 wt sample behavior, which can reasonably be ascribed to the same explanation, that is localized phenazine secretion.
EC–SERS of PYO from Bacterial Communities.
Finally, we examined the SERS spectra of pellicle biofilms under EC potential control, that is EC–SERS, as shown in Figure 5. The SERS spectra from the heterogeneous biofilms, without extraction, should reflect the presence not only of PYO but also other component characteristic of both the secretome and the cells making up the biofilm, Figure S5. Major peaks are observed at 1227, 1307, 1361, 1410, 1574, and 1605 cm−1, all of which are consistent in the position between oxidizing and reducing conditions. The major differences between SERS spectra acquired under different redox conditions are the decrease in intensity of the 1605 cm−1 band under reducing conditions. The intensity behavior of the band is similar to that observed for comparable bands (1600 cm−1) in the PYO model spectra, Figure 2, in the reduced state. Furthermore, SERS spectra obtained from FRD1 pellicle biofilms as a function of applied potential plotted in Figure S6 show the same trend—spectral intensities are even more reduced at reducing potentials than that for PA14 wt. The reduced SERS intensities for FRD1 under reducing conditions could plausibly arise either because the molecular components responsible for the bands are down-regulated and thus do not appear as abundantly in the secretome or because the intrinsic light scattering cross section is diminished under reducing conditions. The fact that the PYO standard spectra shown in Figure 2 exhibit similar behavior as the PA14 wt pellicle biofilm indicates that the latter explanation plays a role in explaining the potential-dependent behavior of the SERS intensities.
Figure 5.
SERS spectra of 120 h PA14 wt pellicle biofilms under EC potential control. 0.0 and −0.6 V potentials vs Ag/AgCl were applied to achieve oxidized and reduced conditions, respectively. All spectra were obtained at an integration time of 0.5 s with 10 accumulations, and potentials were applied for 20 s.
CONCLUSIONS
Pathogenic bacteria such as P. aeruginosa often express numerous virulence factors that enable bacterial growth of human cells in concurrence with disease. At present, there are no diagnostic tools to distinguish infected cells from healthy cells in vivo. In this study, we have characterized the virulence biomarker, PYO, through combined EC and SERS experiments applied both to model PYO systems and to pellicle biofilms derived from PA14 wt, FRD1, and Δphz mutant strains of P. aeruginosa under varying conditions of pH and applied potential. Specific molecular information related to electron transfer events of PYO in biofilm communities was obtained with both electrochemistry (square-wave and CV) and SERS applied to pellicle biofilms in situ. This confirms that specific virulence molecules such as PYO can be detected in early stages of infection and suggests that EC–SERS may be applicable to the detection of other bacterial biomarkers in P. aeruginosa, as well.
With respect to the use of PYO as a molecular sentinel in bacterial communities, a number of interesting observations were made. Both SERS spectra and EC behavior change with pH, and several pH-dependent bands were identified in the SERS spectra, which can potentially be used to probe the local environment. A comparison of the SWV behavior between PA14 wt and Δphz mutant strains unequivocally identified PYO as a major component of the secretome. Spectroelectrochemical studies began with the observation of decreasing SERS intensities of PYO standard under reducing conditions. Extending these experiments to pellicle biofilms showed similar behavior with applied potential, and SERS imaging indicated that secreted PYO was localized in regions approximately the size of P. aeruginosa cells. Altogether, the combination of SERS and electrochemistry is a powerful tool for the characterization of the P. aeruginosa secretome and its behavior under varying pH and applied potential conditions.
Supplementary Material
ACKNOWLEDGMENTS
This work was supported by the National Institute of Allergy and Infectious Diseases (NIAID) of NIH through grant R01AI113219 and the Department of Energy Office of Science through grant DE-SC0019312.
Footnotes
Supporting Information
CV of PYO at pH 2, 5, and 7; SWV of P. aeruginosa pellicle biofilms from various strains; SERS spectra of the P. aeruginosa pellicle biofilm; EC–SERS of PYO from the 48 h FRD1 pellicle biofilm; and a scanning electron microscopy image of concentrated 40 nm AgNP deposition on the gold paste-cured working electrode and SERS substrate.
The authors declare no competing financial interest.
REFERENCES
- (1).Drenkard E Antimicrobial resistance of Pseudomonas aeruginosa biofilms. Microbes Infect. 2003, 5, 1213–1219. [DOI] [PubMed] [Google Scholar]
- (2).Stewart PS; William Costerton J Antibiotic resistance of bacteria in biofilms. Lancet 2001, 358, 135–138. [DOI] [PubMed] [Google Scholar]
- (3).Høiby N; Ciofu O; Bjarnsholt T Pseudomonas aeruginosa biofilms in cystic fibrosis. Future Microbiol. 2010, 5, 1663–1674. [DOI] [PubMed] [Google Scholar]
- (4).Antibiotic Resistance Threats in the United States; Centers for Disease Control and Prevention: Atlanta, GA, 2013. [Google Scholar]
- (5).Baig N; Polisetti S; Morales-Soto N; Dunham SJB; Sweedler JV; Shrout JD; Bohn PW Label-free molecular imaging of bacterial communities of the opportunistic pathogen Pseudomonas aeruginosa. Proc. SPIE-Int. Soc. Opt. Eng 2016, 9930, 993004. [DOI] [PMC free article] [PubMed] [Google Scholar]
- (6).Briard B; Bomme P; Lechner BE; Mislin GLA; Lair V; Prévost M-C; Latgé J-P; Haas H; Beauvais A Pseudomonas aeruginosa manipulates redox and iron homeostasis of its microbiota partner Aspergillus fumigatus via phenazines. Sci. Rep 2015, 5, 8220. [DOI] [PMC free article] [PubMed] [Google Scholar]
- (7).Price-Whelan A; Dietrich LEP; Newman DK Rethinking “secondary” metabolism: physiological roles for phenazine antibiotics (vol 2, pg 71, 2006). Nat. Chem. Biol 2006, 2, 221. [DOI] [PubMed] [Google Scholar]
- (8).Altunbek M; Kelestemur S; Culha M In situ monitoring of biomolecular processes in living systems using surface-enhanced Raman scattering. Biophotonics Japan 2015; International Society for Optics and Photonics, 2015; p 979206. [Google Scholar]
- (9).Pierson LS 3rd; Pierson EA Metabolism and function of phenazines in bacteria: impacts on the behavior of bacteria in the environment and biotechnological processes. Appl. Microbiol. Biotechnol 2010, 86, 1659–1670. [DOI] [PMC free article] [PubMed] [Google Scholar]
- (10).Polisetti S; Baig NF; Morales-Soto N; Shrout JD; Bohn PW Spatial Mapping of Pyocyanin in Pseudomonas Aeruginosa Bacterial Communities Using Surface Enhanced Raman Scattering. Appl. Spectrosc 2017, 71,215–223. [DOI] [PMC free article] [PubMed] [Google Scholar]
- (11).Sharp D; Gladstone P; Smith RB; Forsythe S; Davis J Approaching intelligent infection diagnostics: Carbon fibre sensor for electrochemical pyocyanin detection. Bioelectrochemistry 2010, 77, 114–119. [DOI] [PubMed] [Google Scholar]
- (12).Elliott J; Simoska O; Karasik S; Shear JB; Stevenson KJ Transparent Carbon Ultramicroelectrode Arrays for the Electrochemical Detection of a Bacterial Warfare Toxin, Pyocyanin. Anal. Chem 2017, 89, 6285–6289. [DOI] [PubMed] [Google Scholar]
- (13).Cai X; Klauke N; Glidle A; Cobbold P; Smith GL; Cooper JM Ultra-low-volume, real-time measurements of lactate from the single heart cell using microsystems technology. Anal. Chem 2002, 74, 908–914. [DOI] [PubMed] [Google Scholar]
- (14).Buzid A; Shang F; Reen FJ; Muimhneacháin EÓ; Clarke SL; Zhou L; Luong JH; O’Gara F; McGlacken GP; Glennon JD Molecular signature of Pseudomonas aeruginosa with simultaneous nanomolar detection of quorum sensing signaling molecules at a boron-doped diamond electrode. Sci. Rep 2016, 6, 30001. [DOI] [PMC free article] [PubMed] [Google Scholar]
- (15).Bailey MR; Pentecost AM; Selimovic A; Martin RS; Schultz ZD Sheath-flow microfluidic approach for combined surface enhanced Raman scattering and electrochemical detection. Anal.Chem 2015, 87, 4347–4355. [DOI] [PMC free article] [PubMed] [Google Scholar]
- (16).Ahlf DR; Masyuko RN; Hummon AB; Bohn PW Correlated mass spectrometry imaging and confocal Raman microscopy for studies of three-dimensional cell culture sections. Analyst 2014, 139, 4578–4585. [DOI] [PubMed] [Google Scholar]
- (17).Bellin DL; Sakhtah H; Rosenstein JK; Levine PM; Thimot J; Emmett K; Dietrich LE; Shepard KL Integrated circuit-based electrochemical sensor for spatially resolved detection of redox-active metabolites in biofilms. Nat. Commun 2014, 5, 3256. [DOI] [PMC free article] [PubMed] [Google Scholar]
- (18).Sismaet HJ; Pinto AJ; Goluch ED Electrochemical sensors for identifying pyocyanin production in clinical Pseudomonas aeruginosa isolates. Biosens. Bioelectron 2017, 97, 65–69. [DOI] [PubMed] [Google Scholar]
- (19).Webster TA; Sismaet HJ; Chan I.-p. J.; Goluch ED Electrochemically monitoring the antibiotic susceptibility of Pseudomonas aeruginosa biofilms. Analyst 2015, 140, 7195–7201. [DOI] [PubMed] [Google Scholar]
- (20).Ma C; Trujillo MJ; Camden JP Nanoporous silver film fabricated by oxygen plasma: a facile approach for SERS substrates. ACS Appl. Mater. Interfaces 2016, 8, 23978–23984. [DOI] [PubMed] [Google Scholar]
- (21).Baig NF; Dunham SJB; Morales-Soto N; Shrout JD; Sweedler JV; Bohn PW Multimodal Chemical Imaging of Molecular Messengers in Emerging Pseudomonas aeruginosa Bacterial Communities. Analyst 2015, 140, 6544–6552. [DOI] [PMC free article] [PubMed] [Google Scholar]
- (22).Masyuko RN; Lanni E; Driscoll CM; Shrout JD; Sweedler JV; Bohn PW Spatial Organization of Pseudomonas Aeruginosa Biofilms Probed by Correlated Laser Desorption Ionization Mass Spectrometry and Confocal Raman Microscopy. Analyst 2014, 139, 5700–5708. [DOI] [PubMed] [Google Scholar]
- (23).Jarvis RM; Brooker A; Goodacre R Surface-enhanced Raman scattering for the rapid discrimination of bacteria. Faraday Discuss. 2006, 132, 281–292. [DOI] [PubMed] [Google Scholar]
- (24).Efrima S; Zeiri L Understanding SERS of bacteria. J. Raman Spectrosc 2009, 40, 277–288. [Google Scholar]
- (25).Zhang Y; Hong H; Cai W Imaging with Raman spectroscopy. Curr. Pharm. Biotechnol 2010, 11, 654–661. [DOI] [PMC free article] [PubMed] [Google Scholar]
- (26).Bodelón G; Montes-García V; López-Puente V; Hill EH; Hamon C; Sanz-Ortiz MN; Rodal-Cedeira S; Costas C; Celiksoy S; Pérez-Juste I; Scarabelli L; La Porta A; Pérez-Juste J; Pastoriza-Santos I; Liz-Marzán LM Detection and imaging of quorum sensing in Pseudomonas aeruginosa biofilm communities by surface-enhanced resonance Raman scattering. Nat. Mater 2016, 15, 1203. [DOI] [PMC free article] [PubMed] [Google Scholar]
- (27).Morales-Soto N; Dunham SJB; Baig NF; Ellis JF; Madukoma CS; Bohn PW; Sweedler JV; Shrout JD Spatially dependent alkyl quinolone signaling responses to antibiotics in Pseudomonas aeruginosa swarms. J. Biol. Chem 2018, 293, 9544–9552. [DOI] [PMC free article] [PubMed] [Google Scholar]
- (28).Masyuko RN; Lanni EJ; Driscoll CM; Shrout JD; Sweedler JV; Bohn PW Spatial organization of Pseudomonas aeruginosa biofilms probed by combined matrix-assisted laser desorption ionization mass spectrometry and confocal Raman microscopy. Analyst 2014, 139, 5700–5708. [DOI] [PubMed] [Google Scholar]
- (29).Lanni EJ; Masyuko RN; Driscoll CM; Aerts JT; Shrout JD; Bohn PW; Sweedler JV MALDI-guided SIMS: Multiscale Imaging of Metabolites in Bacterial Biofilms. Anal. Chem 2014, 86, 9139–9145. [DOI] [PMC free article] [PubMed] [Google Scholar]
- (30).Lanni EJ; Masyuko RN; Driscoll CM; Dunham SJB; Shrout JD; Bohn PW; Sweedler JV Correlated Imaging with C60-SIMS and Confocal Raman Microscopy: Visualization of Cell-Scale Molecular Distributions in Bacterial Biofilms. Anal. Chem 2014, 86, 10885–10891. [DOI] [PMC free article] [PubMed] [Google Scholar]
- (31).Dunham SJB; Comi TJ; Ko K; Li B; Baig NF; Morales-Soto N; Shrout JD; Bohn PW; Sweedler JV Metal-assisted polyatomic SIMS and laser desorption/ionization for enhanced small molecule imaging of bacterial biofilms. Biointerphases 2016, 11, 02A325. [DOI] [PMC free article] [PubMed] [Google Scholar]
- (32).Shrout JD; Chopp DL; Just CL; Hentzer M; Givskov M; Parsek MR The impact of quorum sensing and swarming motility on Pseudomonas aeruginosa biofilm formation is nutritionally conditional. Mol. Microbiol 2006, 62, 1264–1277. [DOI] [PubMed] [Google Scholar]
- (33).Malhotra S; Limoli DH; English AE; Parsek MR; Wozniak DJ Mixed communities of mucoid and nonmucoid Pseudomonas aeruginosa exhibit enhanced resistance to host antimicrobials. mBio 2018, 9, No. e00275. [DOI] [PMC free article] [PubMed] [Google Scholar]
- (34).Dietrich LEP; Price-Whelan A; Petersen A; Whiteley M; Newman DK The phenazine pyocyanin is a terminal signaling factor in the quorum sensing network of Pseudomonas aeruginosa. Mol. Microbiol 2006, 61, 1308–1321. [DOI] [PubMed] [Google Scholar]
- (35).Oziat J; Gougis M; Malliaras GG; Mailley P Electrochemical Characterizations of four Main Redox-metabolites of Pseudomonas aeruginosa. Electroanalysis 2017, 29, 1332–1340. [Google Scholar]
- (36).Wu X; Chen J; Li X; Zhao Y; Zughaier SM Culture-free diagnostics of Pseudomonas aeruginosa infection by silver nanorod array based SERS from clinical sputum samples. Nanomed. Nanotechnol. Biol. Med 2014, 10, 1863–1870. [DOI] [PMC free article] [PubMed] [Google Scholar]
- (37).Barhoumi A; Zhang D; Tam F; Halas NJ Surface-enhanced Raman spectroscopy of DNA. J. Am. Chem. Soc 2008, 130, 5523–5529. [DOI] [PubMed] [Google Scholar]
Associated Data
This section collects any data citations, data availability statements, or supplementary materials included in this article.


