Abstract
INTRODUCTION:
Current views of human evolution, as supported by the fossil record, indicate that many hominin lineage branches arose, but only one survived to the present. Neanderthals and Denisovans, two of these extinct lineages, are our closest evolutionary relatives and therefore provide the most subtle genetic and phenotypic contrast to our species. Comparison of Neanderthal, Denisovan, and extant human genomes has shown that many humans today carry genes introduced through past admixture events and has allowed enumeration of human-specific genetic differences that may have been important for recent human evolution. Neuro-oncological ventral antigen 1 (NOVA1) includes one of the few protein-coding differences between modern human and archaic hominin genomes that could affect human neurodevelopment.
RATIONALE:
NOVA1 regulates alternative splicing in the developing nervous system and is a master regulator of splicing genes responsible for synapse formation. Altered NOVA1 splicing activity in humans is associated with neurological disorders, underscoring the role of NOVA1 in neural function. Using CRISPR-Cas9 genome-editing technology in human induced pluripotent stem cells (iPSCs), we replaced the modern human allele of the NOVA1 gene with the ancestral allele found in Neanderthals and Denisovans, which contains a single-nucleotide substitution at position 200 that causes an isoleucine-to-valine change. To investigate the functional importance of this amino acid change in humans, we followed iPSC neural development through functional cortical organoids.
RESULTS:
The reintroduction of the archaic version of NOVA1 into a human genetic background causes changes in alternative splicing in genes involved in neurodevelopment, proliferation, and synaptic connectivity. These changes co-occur with differences in organoid morphology and neural network function, suggesting a functional role for the derived human-specific substitution in NOVA1. Furthermore, cortical organoids carrying the archaic NOVA1 displayed distinct excitatory synaptic changes, which may have led to the observed alterations in neural network development. Collectively, our data suggest that expression of the archaic NOVA1 leads to modified synaptic protein interactions, affects glutamatergic signaling, underlies differences in neuronal connectivity, and promotes higher heterogeneity of neurons regarding their electrophysiological profiles.
CONCLUSION:
A subset of genetic changes may underly the phenotypic traits that separate our species from these extinct relatives. We developed a platform to test the impact of human-specific genetic variants by reintroducing the archaic form found in Neanderthals and Denisovans and measuring its effects during neurodevelopment using human brain organoids. Our results suggest that the human-specific substitution in NOVA1, which became fixed in modern humans after divergence from Neanderthals, may have had functional consequences for our species’ evolution.
Graphical Abstract
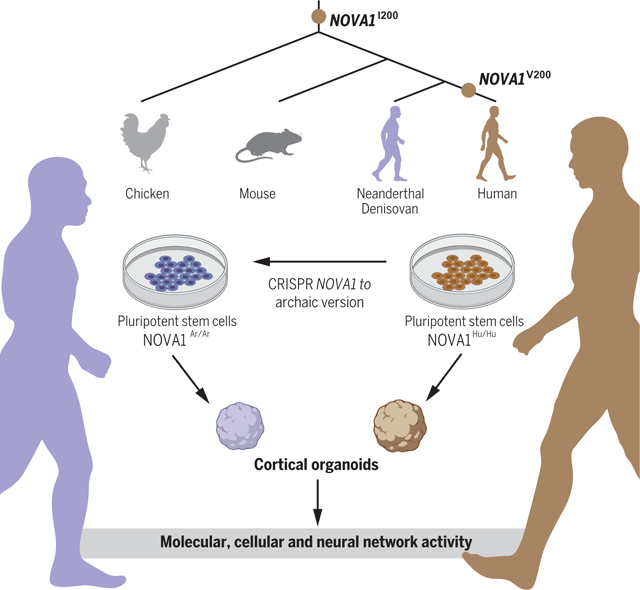
NOVA1 archaic variant in cortical organoids affects cellular, molecular, and neural network activity profiles. During human evolution, modern humans acquired a specific nucleotide substitution in the RNA binding domain of NOVA1. Using genome editing technology, the archaic version of NOVA1 was introduced in human iPSCs and differentiated into cortical organoids. The changes could be observed in different levels, from altered proliferation, different gene expression, and splicing profiles to modified glutamatergic synapsis and neuronal network connectivity. NOVA1I200, NOVA1 gene containing isoleucine archaic variant. NOVA1V200, NOVA1 gene containing valine human variant; NOVA1Ar/Ar, human cell line with homozygous reintroduction of the NOVA1 archaic variant; NOVA1Hu/Hu, human cell line with NOVA1 human variant. Figure created with BioRender.com.
The evolutionarily conserved splicing regulator neuro-oncological ventral antigen 1 (NOVA1) plays a key role in neural development and function. NOVA1 also includes a protein-coding difference between the modern human genome and Neanderthal and Denisovan genomes. To investigate the functional importance of an amino acid change in humans, we reintroduced the archaic allele into human induced pluripotent cells using genome editing and then followed their neural development through cortical organoids. This modification promoted slower development and higher surface complexity in cortical organoids with the archaic version of NOVA1. Moreover, levels of synaptic markers and synaptic protein coassociations correlated with altered electrophysiological properties in organoids expressing the archaic variant. Our results suggest that the human-specific substitution in NOVA1, which is exclusive to modern humans since divergence from Neanderthals, may have had functional consequences for our species’ evolution.
Many hominin lineage branches are represented in the fossil record, but only one survived to the present (1). Neanderthals and Denisovans, two of these extinct lineages, are our closest evolutionary relatives and therefore provide the subtlest genetic and phenotypic contrast to our own species. High-quality genomes are available for both, inferred from DNA recovered from bone remains (2–5). Comparison of Neanderthal, Denisovan, and extant human genomes has shown that many humans today carry genes introduced through past admixture events (6, 7) and has allowed enumeration of human-specific genetic differences that may have been important for recent human evolution (8).
Human genomes share many derived variants with the Neanderthal and Denisovan genomes. Some of these polymorphisms were present in the population that was ancestral to all these groups and remain polymorphic now. Others were genetic variants specific either to both Neanderthals and Denisovans or to each lineage that were introduced into ancestral to modern humans through admixture around 60,000 years ago (1) and not lost by drift or selection in descendants. However, some regions of modern human genomes are devoid of Neanderthal or Denisovan ancestry and carry only modern human-specific genetic variants (4, 5, 9, 10). These regions can result from negative selection on archaic variants, positive selection on human-specific variants, or drift. Comparisons with data from phase I of the 1000 Genomes Project revealed that few genetic substitutions are specific to all or nearly all humans and have not been observed to date in the archaic hominin genomes (4).
Here, we performed a comprehensive analysis of genetic variation available from the 1000 Genomes Project (11) and Simons Genome Diversity Project (SGDP) (12), revealing that only 61 nonsynonymous, derived coding variants are both fixed or nearly fixed in extant humans and are human-specific. These changes provide experimentally tractable candidates for genetic variation that might underlie human-specific phenotypes.
Neuro-oncological ventral antigen 1 (NOVA1) is an RNA binding protein that contains a nearly fixed, derived nonsynonymous change not seen in the Neanderthal or Denisovan genomes or more distantly related species (ancestral allele count is 0 in 1000 Genomes Project, 0 in SGDP, and 3 of 250,246 in gnomAD v2.1.1). NOVA1 regulates alternative splicing in the developing nervous system (13, 14) and is a master regulator of splicing genes responsible for synapse formation (15). Altered NOVA1 splicing activity in humans is associated with neurological disorders (15–17), underscoring the role of NOVA1 in neural function.
Results
Genomic comparison between modern and archaic humans
We compared human genetic data from the 1000 Genomes Project and SGDP (11, 12) and from two high-coverage Neanderthal genomes and one high-coverage Denisovan genome (3, 4). We found a set of 61 positions in which all humans carry an autosomal fixed derived mutation (table S1).
We measured the length of the human-specific haplotype around each fixed human-specific site, i.e., the largest genome region in which no humans carry any substitutions observed in the archaic genomes (Fig. 1A). Among the 61 nonsynonymous differences, the human-specific NOVA1 substitution is on the third-largest human-specific haplotype: 4.4 kb (Fig. 1A). This NOVA1 archaic variant was identified in the comparison using data from phase I of the 1000 Genomes Project (4). The olfactory receptor gene OR8B2 and the nuclear receptor coactivator gene NCOA6 were the only genes found with human-specific nonsynonymous substitutions on longer human-specific haplotypes.
Fig. 1. Catalog of human versus Neanderthal genetic variation and the NOVA1 haplotype.
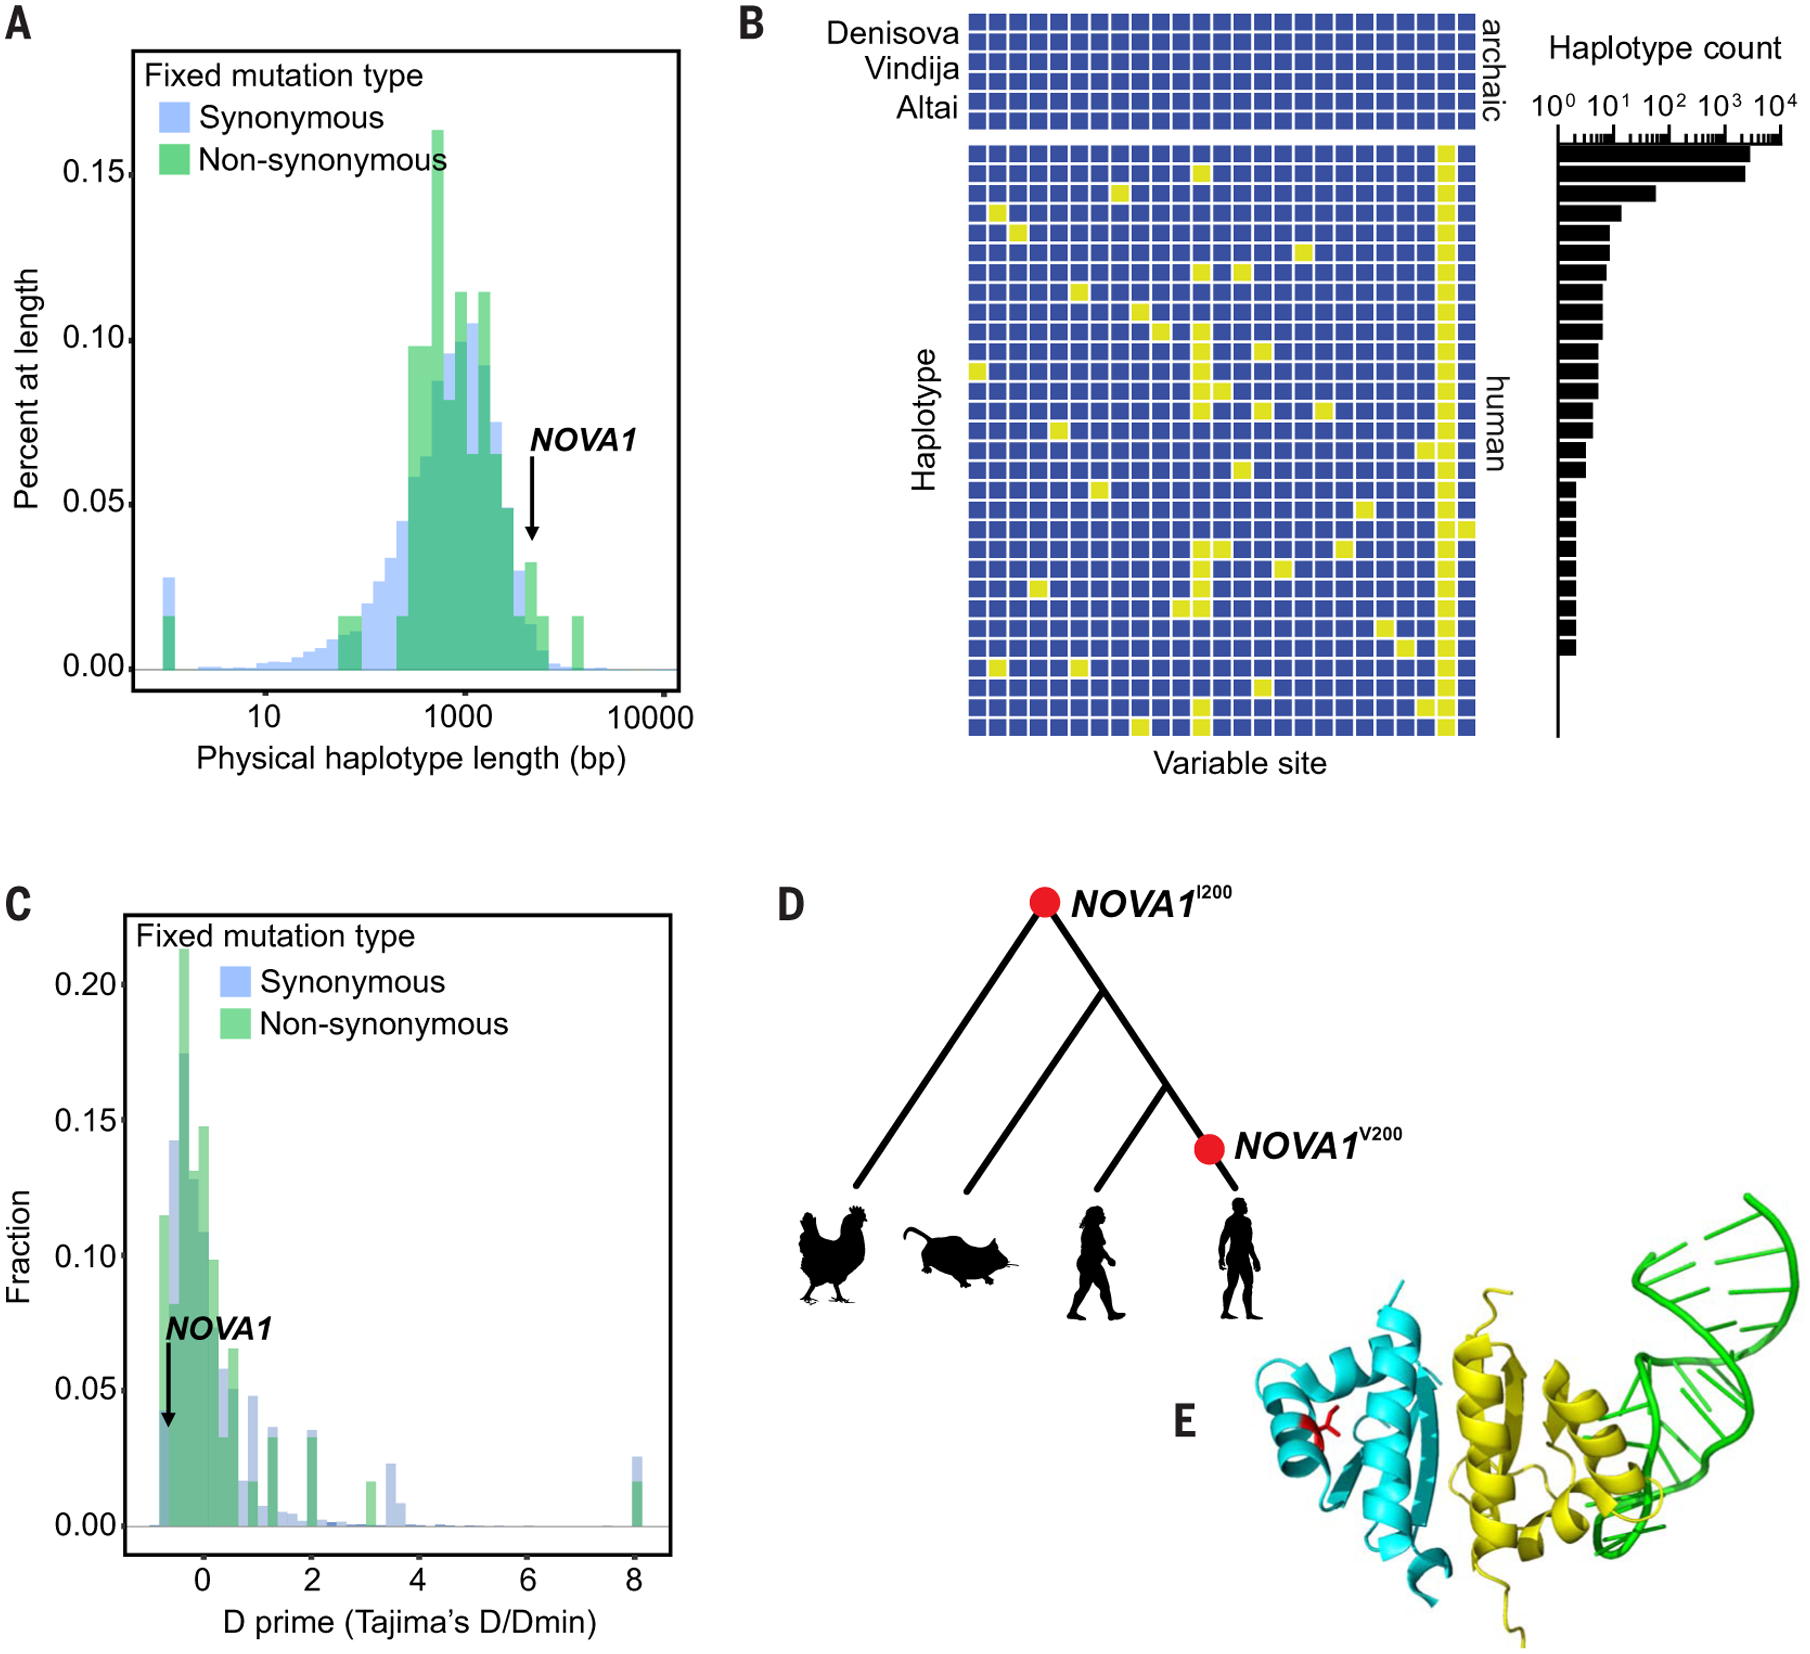
(A) Physical haplotype lengths [in base pairs (bp)] around human-specific fixed derived alleles in the 1000 Genomes Project dataset. We defined a haplotype as the distance upstream and downstream of a human-specific fixed derived allele for which no human in the 1000 Genomes Project dataset shares a derived allele with an archaic hominin. Lengths of haplotypes around both synonymous and nonsynonymous substitutions are shown. (B) Haplotypes around the human-specific fixed derived allele in NOVA1. Rows are individual haplotypes; columns are variable sites. Yellow boxes have a derived allele (different from the 1000 Genomes Project ancestral sequence). Human haplotypes are labeled by the number of (phased, haploid) human genomes that carry them. Only biallelic SNPs with reference alleles are shown, and the region is bounded by sites at which modern humans share derived alleles with archaic hominins. (C) Normalized Tajima’s D of haplotypes around human-specific fixed derived alleles. (D) Phylogeny of modern humans, Neanderthals, mice, and chickens, with their amino acid at position 200 in NOVA1 denoted [NOVA1I200 (isoleucine) and NOVA1V200 (valine)]. (E) Tertiary structure of NOVA1. Partial structure of NOVA1, showing the KH1 (yellow) and KH2 (blue) domains bound to RNA (green). The location of the variable residue at position 200 is shown in red. The structure of the KH3 domain has not been solved. RNA can simultaneously bind to both the KH1 and KH2 domains of NOVA1.
Analysis of the genetic variation found in the 4.4-kb human-specific NOVA1 haplotypes reveals two high-frequency haplotypes (Fig. 1B), the most common of which carries only the fixed nonsynonymous substitution and the second most common of which carries a single derived allele in addition to the fixed nonsynonymous substitution. The haplotype distribution is consistent with a relatively recent emergence of this haplotype, followed by spread to fixation. We measured Tajima’s D of the human-specific haplotypes around all human-specific synonymous and nonsynonymous differences (Fig. 1C). Although the mean of this distribution is positive (0.409; 0.144 for haplotypes around nonsynonymous substitutions), the Tajima’s D′ for the NOVA1 region in humans is −0.655 and is the fourth-lowest value observed in the set of haplotypes around nonsynonymous substitutions. This is consistent with purifying selection on the NOVA1 haplotype.
The human-specific NOVA1 genetic difference causes an isoleucine-to-valine amino acid change in the second of three K homology (KH) domains in NOVA1 (Fig. 1, D and E). KH domains interact with RNA molecules to promote inclusion or exclusion of exon cassettes in mature mRNA (18, 19). The available NOVA1:RNA cocrystal structure does not show protein-RNA contact at the human-specific position (Fig. 1E). However, analysis of NOVA1 has shown that target RNA can bind to the KH1 and KH2 domains simultaneously. Then, NOVA1 dimerizes with contact between the two molecules’ KH2 domains, allowing RNA to interact with both KH1 domains (19).
Generation of human induced pluripotent stem cell lines with archaic NOVA1 variant
To investigate the functional importance of the NOVA1 nonsynonymous substitution, we used CRISPR-Cas9 technology to introduce the archaic variant of NOVA1 into the genome of induced pluripotent stem cells (iPSCs) derived from two neurotypical human individuals with distinct genetic backgrounds (fig. S1). For clarity, we refer to the derived predominant allele in modern humans as NOVA1Hu/Hu and the archaic allele as NOVA1Ar/Ar. As additional controls for downstream experiments, we also refer to NOVA1Ko/Ko, which represents isogenic lines with no functional NOVA1, and NOVA1Ko/Ar, which represents lines in which the NOVA1 archaic variant was reintroduced back into one allele of the knockout (Ko) background. Each cell line is depicted with a symbol for easy visualization of the data on individual genotypes. A description of all experiments performed, clones, and cell lines used can be found in table S2.
We confirmed the expression and integrity of the expected NOVA1 alleles through sequencing of the NOVA1 genomic sequence and mRNA in all cell lines and clones used (fig. S1, A and B). Two iPSC lines and all 13 respective clones for the different genotypes were further characterized for pluripotency status (fig. S1, C and D). Whole-genome copy number variations (CNVs) and single-nucleotide polymorphisms (SNPs) were tracked to exclude any clones with genomic alterations that were not previously present in the original lines (fig. S1, E to G).
To confirm that CRISPR only produced on-target mutations in the NOVA1 gene locus, we also looked for the presence of off-target mutations in our cell lines, focusing on their donor and acceptor splicing sites, i.e., the exons and the borders two bases into introns. Exome sequencing was performed such that exons with coding sequences (open reading frames) of NOVA1 have a sequencing coverage of at least 50 nonrepetitive and high-quality (Phred > 30) reads.
We also investigated whether these isogenic cell lines had any structural chromosomal alterations using BeadChip array for CNV analysis (minimum CNV length of 100 nucleotides). However, only small deletions and duplications were detected (table S3). Further, we investigated whether an expanded region (1-Mb up- and downstream regions) of the NOVA1 gene locus could have a CNV, considering our detection criteria, but no CNV was detected in any analyzed cell line. We thus confirmed that the NOVA1Ar/Ar cells carried the edit in homozygous form. Additionally, we identified a small number of off-target edits in heterozygous form, which were monitored in subsequent gene expression and splicing experiments (tables S3 and S4).
Cortical organoids expressing the archaic NOVA1 genetic variant
We derived functional cortical organoids from edited and unedited isogenic (control) iPSC lines and assessed the impact of the NOVA1Ar/Ar variant on human neural cells. NOVA1 protein expression was confirmed during cortical organoid maturation (fig. S2A). We measured organoid size and morphology after consecutive changes of media containing factors to promote neural induction, proliferation, and maturation (20). Although no difference in size and morphology was observed during neural induction, NOVA1Ar/Ar and NOVA1Ko/Ar cortical organoids were smaller in diameter than NOVA1Hu/Hu organoids during the proliferative and maturation stages (Fig. 2A). To explore other potential morphological differences during these later stages, we extracted two-dimensional (2D) organoid outlines using automatic image processing and watershed segmentation to generate 3D surface models of the cortical organoids (Fig. 2, B and E). The surface rugosity and curvature were measured by the Dirichlet normal surface energy (DNE), where high DNE values correspond to a ridged surface. These models revealed increased surface complexity in NOVA1Ar/Ar and NOVA1Ko/Ar organoids at the proliferative stages (Fig. 2E and fig. S2B).
Fig. 2. The impact of the NOVA1 archaic genetic variant on modern human neurodevelopment.
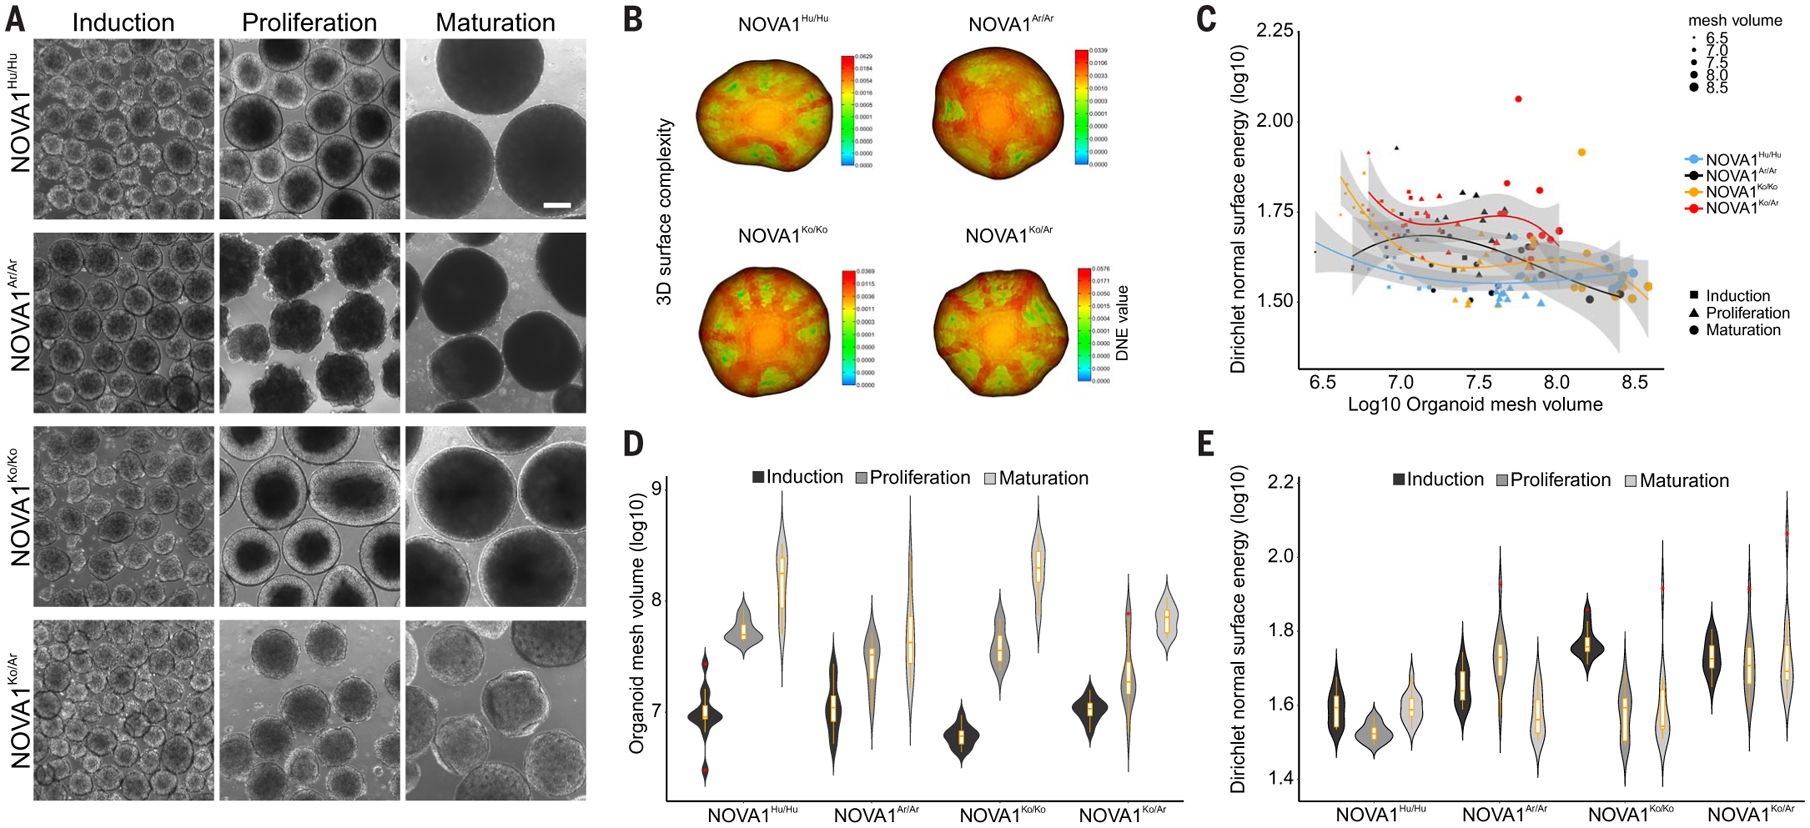
(A) Cellular and molecular development of human cortical organoids. Representative bright-field images captured at different stages of maturation (three replicates from two independent cell lines; NOVA1Hu/Hu n = 5 clones, NOVA1Ar/Ar n = 5 clones, NOVA1Ko/Ko n = 2 clones, and NOVA1Ko/Ar n = 2 clones). For more details, see table S2. Scale bar, 200 μm. (B) Reconstruction and shape quantification of 3D cortical organoid surface models using image processing and 2D outline segmentation. (C) Correlations between organoid size (mesh volume) and shape with DNE. DNE was used as a shape metric or surface rugosity and curvature measure (i.e., the bending of the surface; high DNE values correspond to a ridged surface). A third-degree polynomial was used to fit the data, and the confidence interval is 95%. Note that organoid surface complexity decreases with an increase in organoid size only for NOVA1Ko/Ko. For the rest, the correlations are not significant; organoid surface complexity is relatively independent of organoid size. Fitted values and model predictions (lines) nicely reflect the model; the combination of violin (density) and boxplot tracing changes in size and shape during organoid neurodevelopment is shown. Shading indicates 95% confidence interval. (D and E) NOVA1Ar/Ar cortical organoids showed (D) smaller diameter and (E) increased surface rugosity at the proliferative and maturation stages compared with NOVA1Hu/Hu (n = 36 organoids per genotype and time point, two independent cell lines).
To determine the molecular and cellular changes underlying the reduced size and increased surface rugosity of the NOVA1Ar/Ar organoids, we assessed cell proliferation, cell cycle, apoptosis, and cell-type composition. Similar to human cortical development in vivo, the proliferative zone in cortical organoids is formed by neural progenitor cells (SOX2+, Ki67+, and Nestin+) that gradually mature into neurons (NeuN+ and MAP2+) and develop into concentric structures composed of cortical layer neurons (CTIP2+) (Fig. 3A and fig. S2C). NOVA1Ar/Ar cortical organoids had a reduced number of rosettes and a higher number of apoptotic cells than NOVA1Hu/Hu organoids (Fig. 3B and fig. S2D).
Fig. 3. The transcriptional and cellular alterations of the NOVA1 archaic genetic variant on human neurodevelopment.
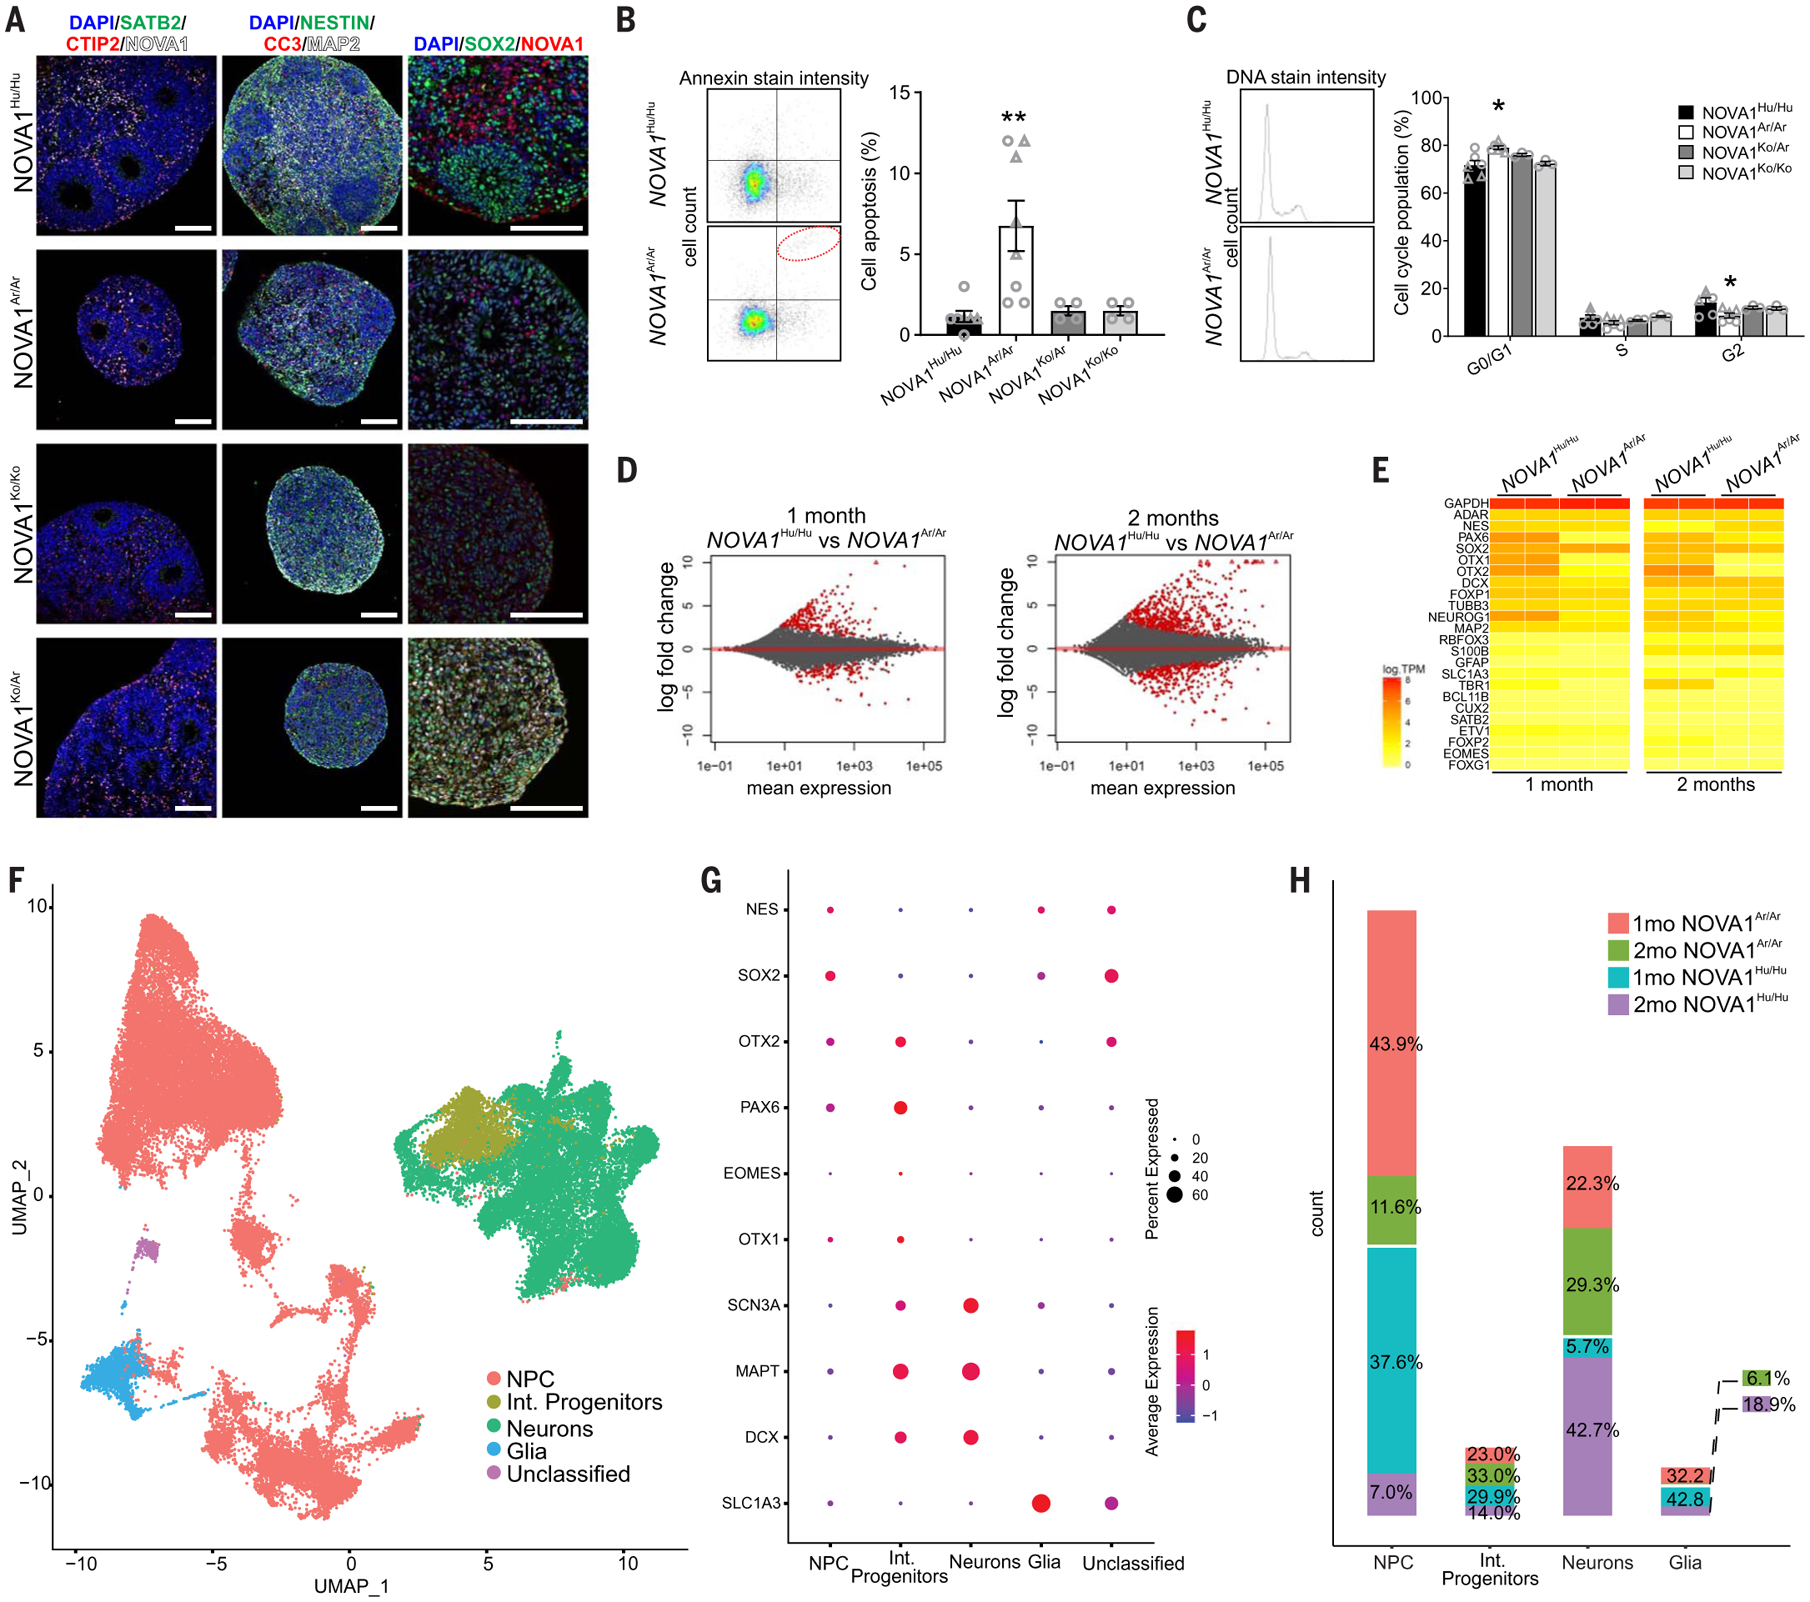
(A) Cryosections of 1-month-old cortical organoids. Organoids are composed of a proliferative region (Ki67+, SOX2+, and Nestin+) surrounded by cortical neurons (NeuN+, MAP2+, and CTIP2+). Scale bars, 100 μm. (B) Annexin cell death assay scatterplot shows an increase in cell death percentage in 1-month-old NOVA1Ar/Ar cortical organoids [NOVA1Hu/Hu n = 6, five clones; NOVA1Ar/Ar n = 8, five clones; NOVA1Ko/Ko n = 4, one clone; and NOVA1Ko/Ar n = 4, one clone; analysis of variance (ANOVA) Kruskal-Wallis test, P = 0.0015 NOVA1Hu/Hu versus NOVA1Ar/Ar]. (C) DNA staining intensity shows a decrease in cell proliferation in 1-month-old NOVA1Ar/Ar cortical organoids (NOVA1Hu/Hu n = 6, five clones; NOVA1Ar/Ar n = 6, three clones; NOVA1Ko/Ko n = 3, one clone; and NOVA1Ko/Ar n = 3, one clone; two-way ANOVA Dunnett test, P = 0.002 NOVA1Hu/Hu versus NOVA1Ar/Ar). For (B) and (C), data are shown as mean ± SEM; *P < 0.05 and **P < 0.01; and individual cell lines are indicated by a different symbol. (D) MA plots of the overall expression on the x axis and log2 fold change on the y axis for every gene. Points colored in red represent genes that were significantly differentially expressed with a false discovery rate α = 0.01. (E) Gene expression heatmap for key genes involved in neural development across all time points and cell lines. (NOVA1Hu/Hu n = 2, two clones from one cell line; NOVA1Ar/Ar n = 2, two clones from one cell line). TPM, transcripts per million. (F) Uniform manifold approximation and projection (UMAP) of 50,418 nuclei from integrating datasets of 1- and 2-month-old cortical organoids. The integrated dataset is colored by four main cell clusters (13,333 nuclei for 1-month NOVA1Hu/Hu, 17,456 nuclei for 1-month NOVA1Ar/Ar, 10,145 nuclei from 2-month NOVA1Hu/Hu, and 9,484 nuclei for 2-month NOVA1Ar/Ar). NPC, neural progenitor cells; Int. progenitors, intermediate progenitors. (G) Dot plots showing cluster-specific gene expression across main cell clusters. See fig. S3 for more gene markers. (H) Bar plots of the proportion of NOVA1Ar/Ar and NOVA1Hu/Hu cell types. Data are shown as mean ± SEM. 1mo, 1 month old; 2mo, 2 month old.
NOVA1Ar/Ar cells proliferated more slowly than NOVA1Hu/Hu cells owing to the reduced number of Ki67+ and SOX2+ cells (Fig. 3C and fig. S2D), and the NOVA1Ar/Ar and NOVA1Ko/Ar organoids developed a progenitor cell layer with aberrant structural morphology. Together, these findings suggest that the reduction of organoid size and the increased surface complexity may be linked to alterations in proliferation and cell death.
Gene expression of cortical organoids carrying the archaic NOVA1 version
Next, we collected and sequenced RNA from cortical organoids at two developmental time points (1 and 2 months) to capture potential alterations in gene expression and alternative splicing. Although NOVA1 is not expected to affect expression directly, splicing changes can have downstream effects on gene expression. We identified 277 differentially expressed genes between NOVA1Ar/Ar and NOVA1Hu/Hu organoids at different stages of maturation, many of which are involved in neural developmental processes (Fig. 3, D and E).
The three genes with the largest ratio of NOVA1Ar/Ar to NOVA1Hu/Hu expression in early cortical organoids are the mRNA-binding ribosomal protein gene RPS4Y1 (21); NNAT, which codes for a protein involved in neural differentiation through calcium signaling (22); and TDGF1, which codes for a membrane signaling protein involved in cell proliferation and migration during neurodevelopment (23). The three genes with the largest ratio of NOVA1Hu/Hu expression to NOVA1Ar/Ar expression at the early time point are FEZF1, which is involved in axon guidance and neural migration (24); PAX6, a transcription factor that regulates gene expression during embryonic brain development (25); and LHX5, a transcription factor that controls cell differentiation during brain development (26). All genes with a significantly different expression between NOVA1Ar/Ar and NOVA1Hu/Hu organoids are listed in table S5, and several were independently validated, as described in fig. S2. Most of the differentially expressed genes in NOVA1Ar/Ar organoids are involved in cell development, proliferation, neuronal organization, and connectivity, as shown by a pathway analysis (fig. S2, E to G).
To characterize the cellular diversity of NOVA1Ar/Ar cortical organoids during development, we performed single-nucleus RNA sequencing (RNA-seq) on 1- and 2-month-old organoids (Fig. 3, F to H, and fig. S3). We used unsupervised clustering on the combined dataset of 50,418 nuclei to identify clusters and their relative abundance at distinct time points. From the expression of gene markers, we combined smaller subclusters into four major cell classes: progenitors, intermediate progenitors, glial cells, and neurons. On the basis of this annotation, 1-month-old organoids consisted of >70% progenitor cells (expressing SOX2 and PAX6) (fig. S3, A to C). At the 2-month stage, cortical organoids are composed mainly of progenitors, glia, and glutamatergic neurons (Fig. 3H and fig. S3, D to H). Differences in cell-type proportion were observed among the genotypes at 1 and 2 months of development, leading to potential differences in regional identity (fig. S3, I to L).
Gene splicing also varied between NOVA1Ko/Ko, NOVA1Ar/Ar, and NOVA1Hu/Hu organoids at the two time points. NOVA1Ko/Ko cortical organoids displayed a distinct principal components analysis (PCA) cluster compared with the other two genetic variants (Fig. 4, A and B). At the early stage, 113 alternative splicing (AS) events occurred at significantly different rates between NOVA1Ar/Ar and NOVA1Hu/Hu organoids, affecting 122 genes. At the later stage, 166 significant AS events affected 156 genes (tables S6 and S7). The most common differential AS events were cassette inclusion and alternative first and last exons (Fig. 4C). Many of the differentially spliced genes in NOVA1Ar/Ar organoids are involved in synaptogenesis and neuronal connectivity, as shown by a gene ontology enrichment analysis (table S8).
Fig. 4. Global analysis of splicing among different samples.
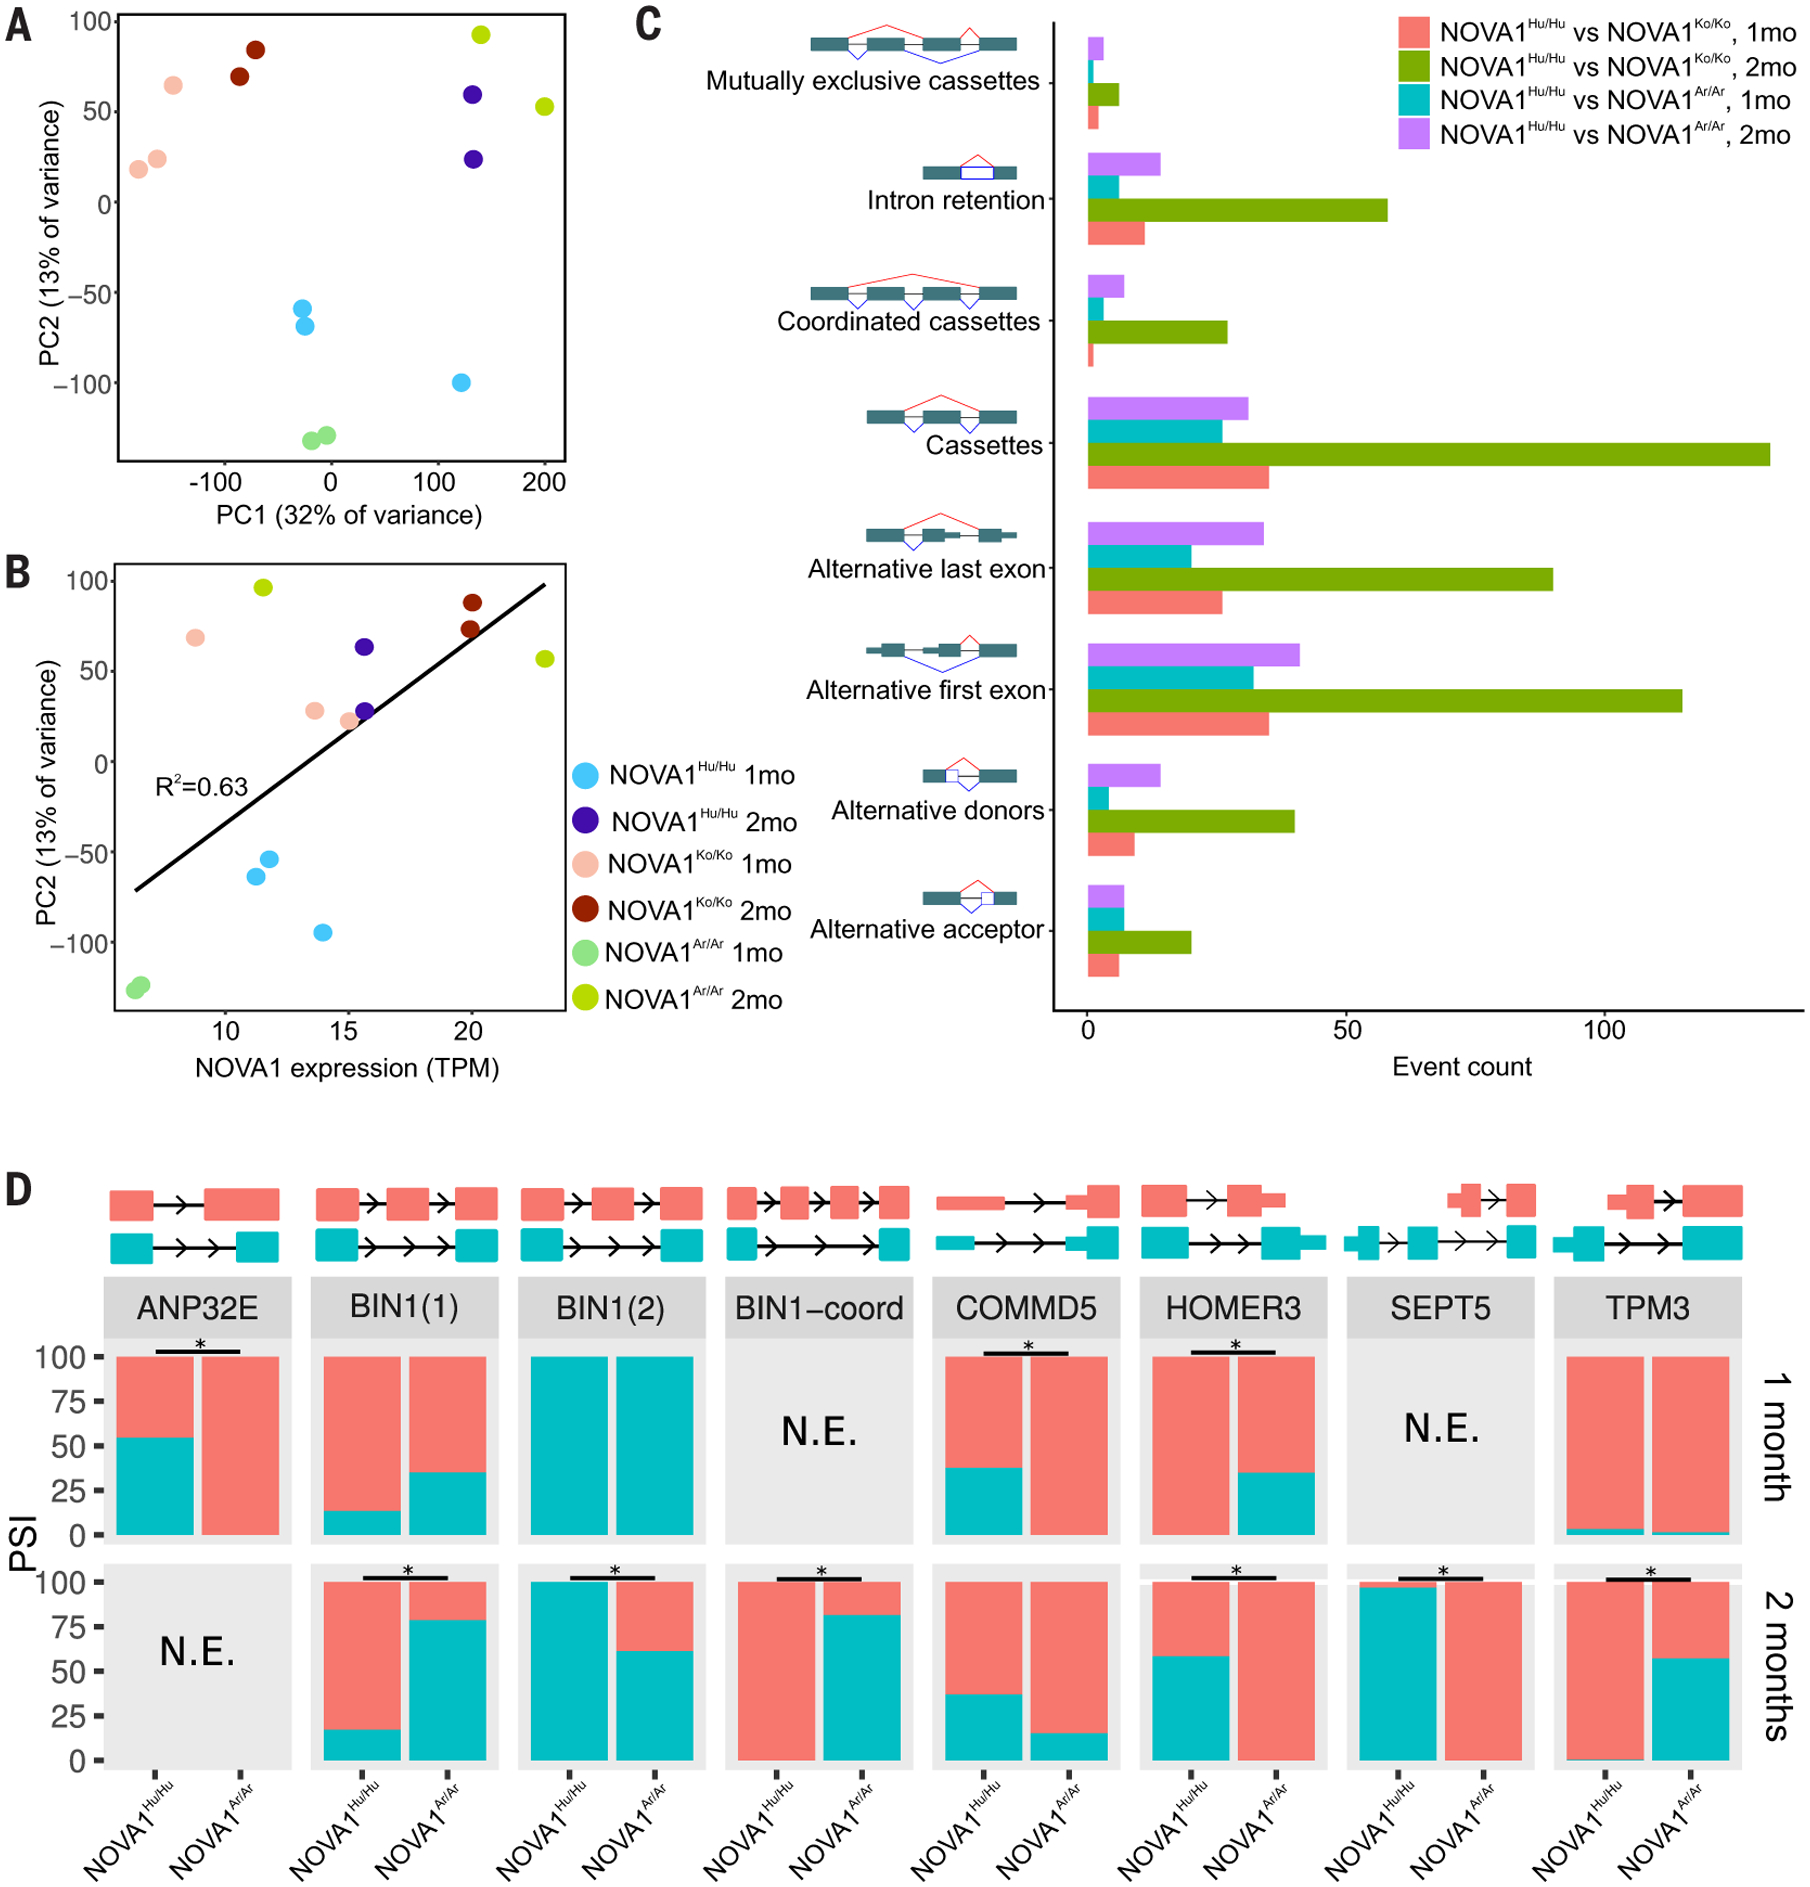
(A) A plot of the first two principal components from a PCA of cassette inclusion frequency shows that replicates from different cell lines cluster together. Note how NOVA1Ko/Ko cluster differently from the other edited versions. (B) The second principal component positively correlates with NOVA1 expression. (C) Numbers of differential splicing events of different types from comparisons between NOVA1Hu/Hu and NOVA1Ar/Ar cortical organoids at early and late stages of maturation. More differential splicing is found between NOVA1Hu/Hu and NOVA1Ko/Ko than between NOVA1Hu/Hu and NOVA1Ar/Ar, and more differential splicing is found at later stages than at early stages. (D) A set of genes exhibiting alternative splicing changes on the basis of NOVA1 variants at different stages of maturation. N.E. (not expressed) refers to splicing events with insufficient expression for splicing analysis.
For example, HOMER3, a member of the HOMER family of scaffold proteins present in the postsynaptic density, was spliced differently by NOVA1Ar/Ar and NOVA1Hu/Hu at distinct time points (Fig. 4D and fig. S2G). Previous work has shown that the different isoforms of HOMER3 have different functions (27), suggesting that these AS forms may have functional consequences.
Binding preferences between modern and archaic NOVA1
To determine the binding preferences of the human and archaic forms of NOVA1 across the transcriptome, we performed enhanced cross-linking and immunoprecipitation (eCLIP) assays on dissociated cortical organoids (28). We identified more than 30,000 significantly enriched (fold change > 4, P < 0.001) binding sites for both forms of NOVA1, of which 84 and 83% occurred in intronic regions in human protein-coding genes for the human and archaic forms, respectively (Fig. 5A and fig. S4). About two-thirds of peak regions are overlapping between the genotypes (Fig. 5B), and the binding sites of both forms of NOVA1 are strongly enriched for the canonical YCAY sequence motif (18) (Fig. 5C). A close inspection of binding events reveals that peak regions between the human and archaic forms of the protein are nearly identical (Fig. 5D). Notably, cells carrying the NOVA1Ar/Ar genotype preferentially select an alternate last exon and shorter 3′ untranslated region (3′UTR) sequence of the NOVA1 transcript, which corresponds to reduced binding density of NOVA1Ar/Ar on the long 3′UTR (Fig. 5D).
Fig. 5. Human and archaic NOVA1 binding profile.
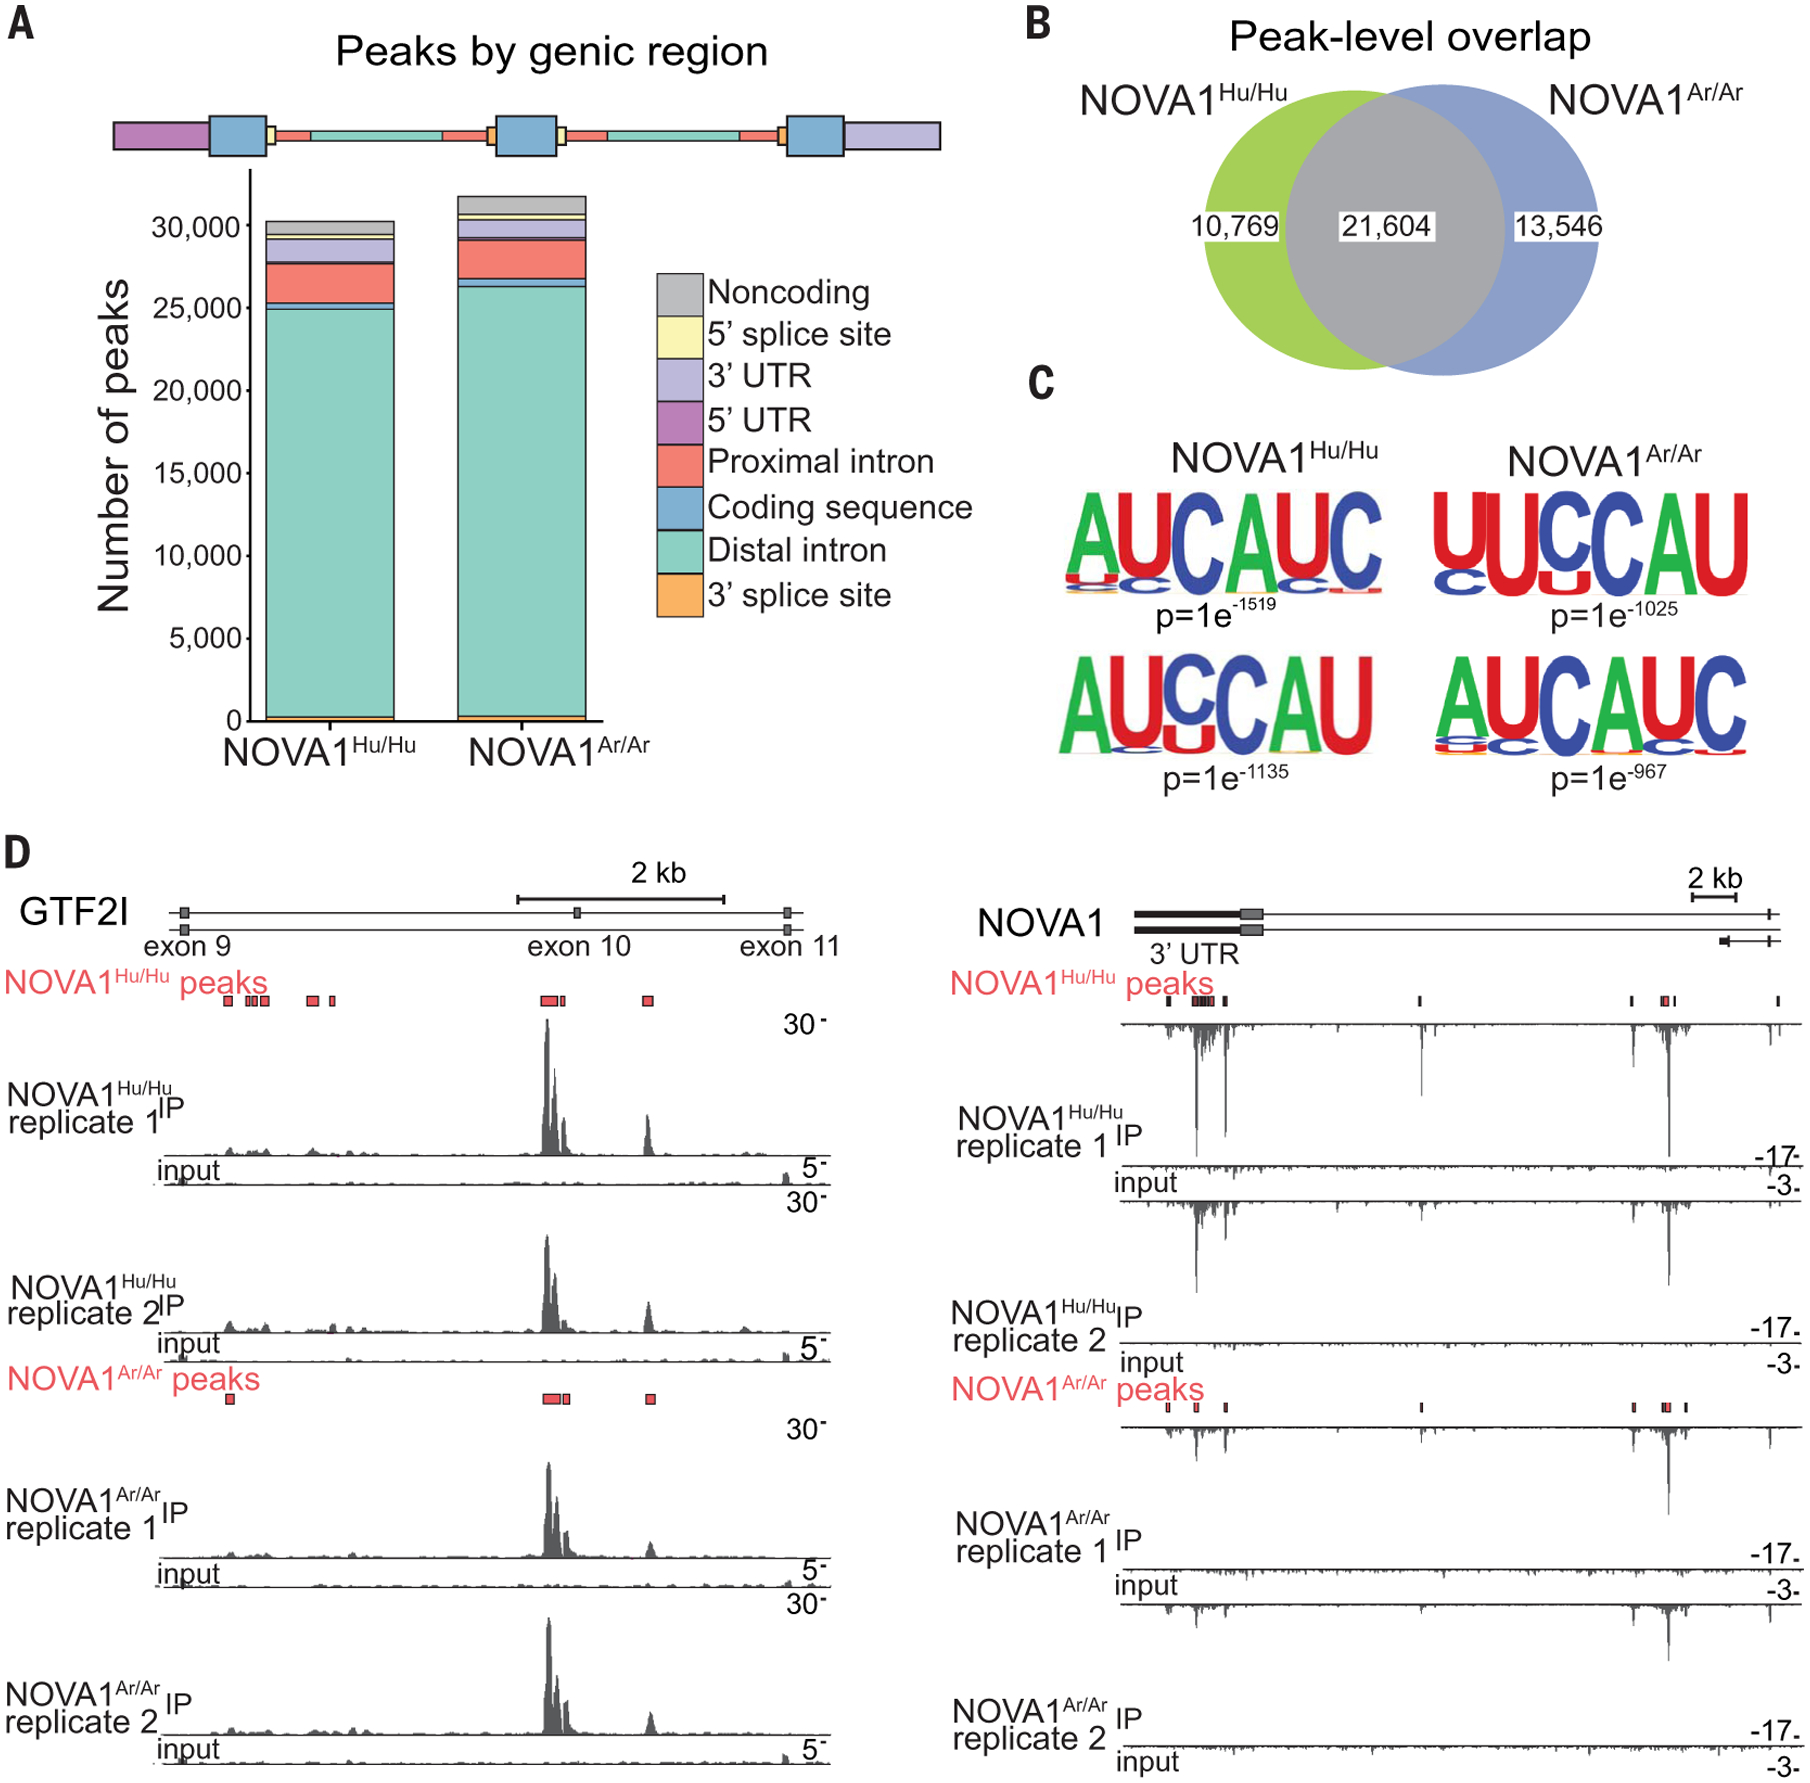
(A) Counts of significantly enriched binding sites (peaks) identified in each genic region indicated (two replicates from one cell line; NOVA1Hu/Hu n = 1 clone, NOVA1Ar/Ar n = 1 clone, NOVA1Ko/Ko n = 1 clone, and NOVA1Ko/Ar n = 1 clone). Significantly enriched peaks are peaks with fold change >4 relative to input and P < 0.001 (chi-square test) in at least one of two replicate experiments. (B) Venn diagram of called peaks for each genotype showing overlap between NOVA1Hu/Hu and NOVA1Ar/Ar binding sites. (C) Top two motifs enriched in HOMER (hypergeometric optimization of motif enrichment) analysis. Motif enrichment of nucleotides in peak regions was calculated relative to background sequences matched for the same genic regions. (D) Normalized read density of input and immunoprecipitation samples for two replicates of NOVA1Hu/Hu and NOVA1Ar/Ar binding events in two target genes: GTF2I and NOVA1. Peaks called are shown in red boxes for each genotype (two replicates from one cell line; NOVA1Hu/Hu n = 1 clone and NOVA1Ar/Ar n = 1 clone).
Altered synaptogenesis and neural network in cortical organoids carrying the archaic NOVA1
Because many genes differentially expressed or spliced in NOVA1Ar/Ar organoids are involved in synaptogenesis and neuronal connectivity, we verified whether synaptic protein levels showed an altered profile. A synaptic ultrastructural organization could be detected by electron microscopy in cortical organoids derived from both genotypes (Fig. 6A). NOVA1Ar/Ar cortical organoids expressed lower levels of pre- and postsynaptic proteins, resulting in reduced colocalized synaptic puncta compared with NOVA1Hu/Hu (Fig. 6, B and C).
Fig. 6. Introduction of NOVA1 archaic genetic variant in modern human alters synaptic proteins.
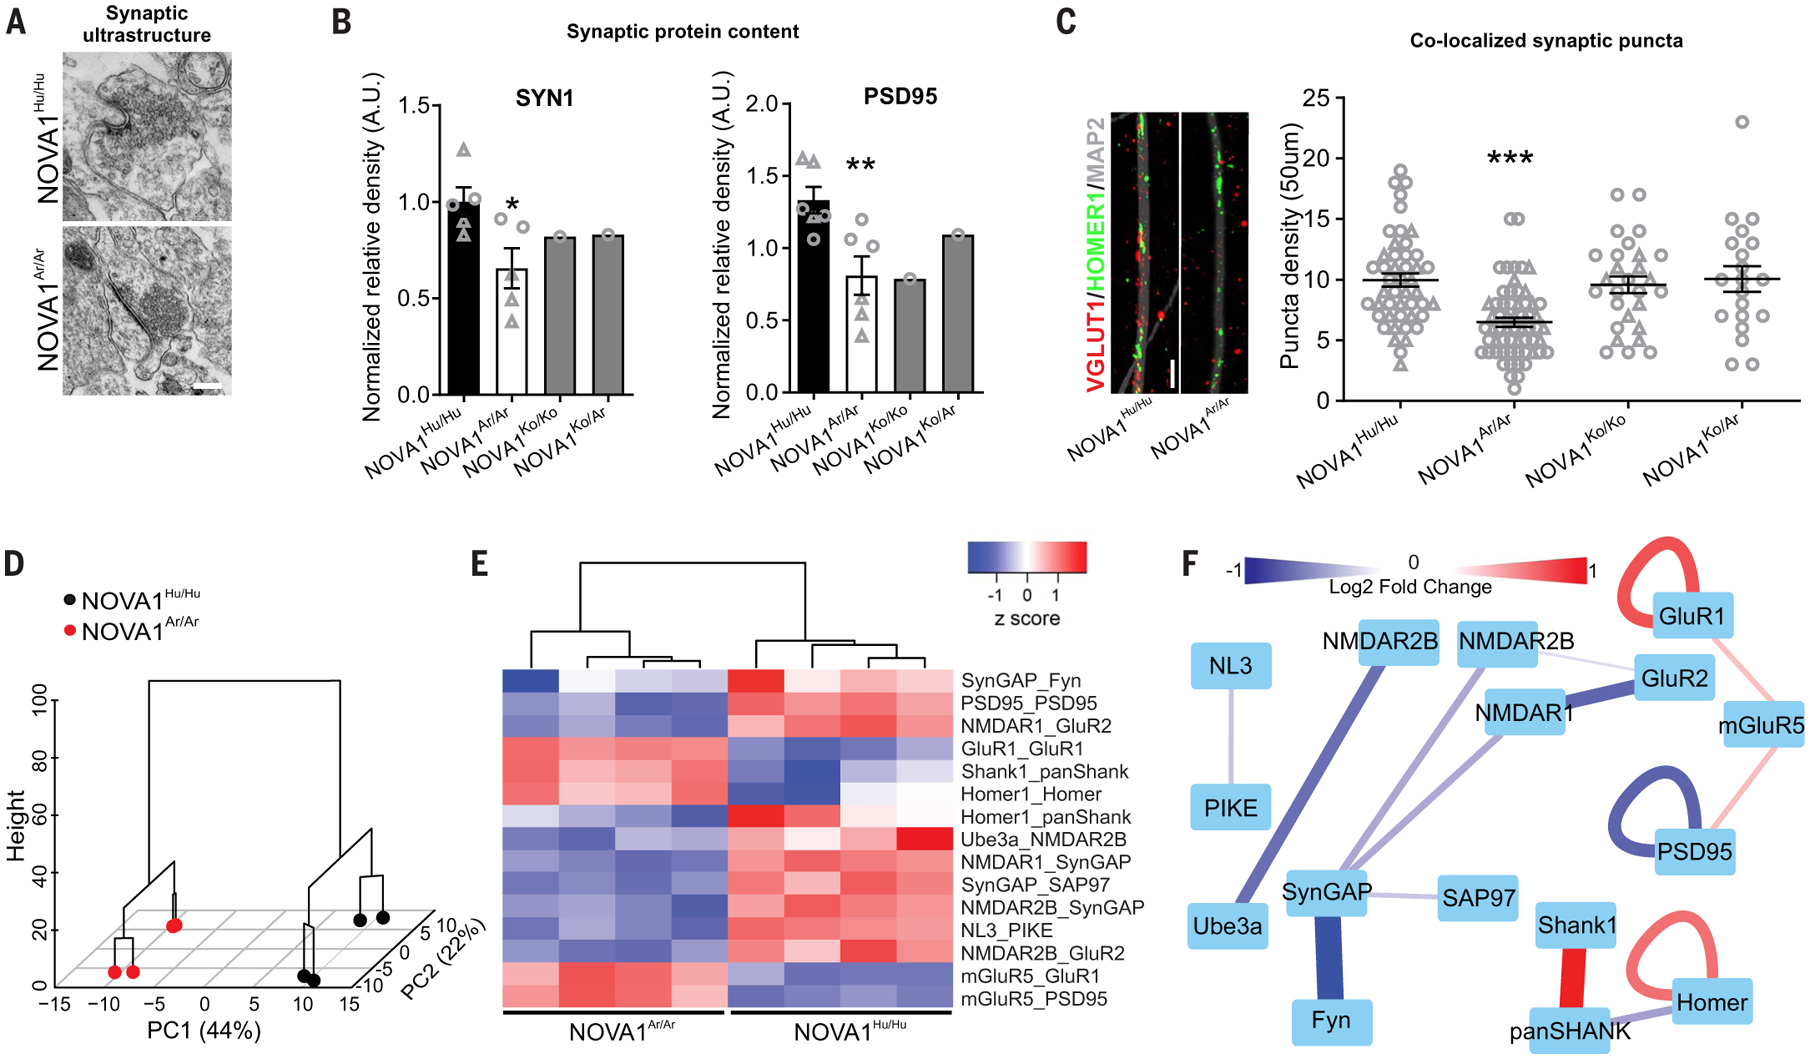
(A) Representative images of electron microscopy of synaptic ultrastructure in cortical organoids with different genotypes. Scale bar, 500 nm. (B) Western blot analysis validated predicted gene expression reduction of synaptic protein markers (NOVA1Hu/Hu SYN1 n = 5, PSD95 n = 6, five clones; NOVA1Ar/Ar SYN1 n = 5, PSD95 n = 6, five clones; NOVA1Ko/Ko n = 1 clone; and NOVA1Ko/Ar n = 1 clone; unpaired t test NOVA1Hu/Hu versus NOVA1Ar/Ar, P = 0.0276 and P = 0.0089). Data are shown as mean ± SEM; individual cell lines are indicated by a different symbol. *P < 0.05; **P < 0.01. (C) Reduction of post- and presynaptic marker colocalization in cortical neurons carrying the NOVA1Ar/Ar variant (47 neurons from three clones of NOVA1Hu/Hu, 61 neurons from three clones of NOVA1Ar/Ar, 28 neurons from two clones of NOVA1Ko/Ko, and 20 neurons from one clone of NOVA1Ko/Ar; ANOVA Kruskal-Wallis test, ***P < 0.001). Data are shown as mean ± SEM; individual cell lines are indicated by a different symbol. Scale bar, 2 μm. (D) Hierarchical clustering by principal components of multiplex coimmunoprecipitation data clustered samples by genotype. The dendrogram is overlaid on a graph of individuals by PC1 and PC2. (E) Heatmap of ANC∩CNA significant interactions, showing the normalized median fluorescent intensity of each interaction in each sample. (F) Dynamic interaction map of protein coassociations shown in (E). Edges connecting protein nodes represent significantly different interactions. Line color and thickness represent the direction and magnitude, respectively, of the difference (one cell line; two clones of NOVA1Hu/Hu and two clones of NOVA1Ar/Ar).
To investigate whether the observed protein alterations affect synaptic protein interaction networks, we used quantitative multiplex coimmunoprecipitation (29) to characterize the abundance of protein coassociations among a set of 20 synaptic proteins in NOVA1Ar/Ar and NOVA1Hu/Hu cortical organoids. Hierarchical clustering by principal components clustered samples by genotype (Fig. 6D). Using a combination of adaptive nonparametric analysis (ANC) (30) and weighted correlation network analysis (CNA) (31), we identified 15 high-confidence protein coassociations that were significantly different between NOVA1Ar/Ar and NOVA1Hu/Hu organoids in four of four replicates (Fig. 6E). Coassociations that were up-regulated in the NOVA1Ar/Ar organoids included SHANK, HOMER, GluR1, and mGluR5, which bind each other to form a receptor scaffolding system that is often dysregulated in neurodevelopmental disorders (32, 33). Coassociations that were down-regulated in the NOVA1Ar/Ar condition included PSD95 and N-methyl-d-aspartate(NMDA)receptors,SynGAP and Fyn, which contribute to activity-dependent plasticity (34) (Fig. 6F). These data demonstrate widespread changes in synaptic protein networks downstream of NOVA1 mutation.
To evaluate the impact of synaptic molecular changes on neural network activity, we plated cortical organoids on a multielectrode array (MEA) and measured the electrophysiological difference between NOVA1Ar/Ar and NOVA1Hu/Hu (Fig. 7A). The MEA technology enables dynamic multisite extracellular electrophysiological recordings for a macroscopic view of neural networks (20). When evaluating the network activity, mature NOVA1Ar/Ar cortical organoids displayed an increased number of bursts and a higher coefficient of variation (CV) while showing lower synchrony levels compared with NOVA1Hu/Hu organoids (Fig. 7B). It was also observed that neurons from NOVA1Ar/Ar cortical organoids displayed higher variability according to their firing rate and CV (Fig. 7, C to F). Collectively, our data suggest that expression of the archaic NOVA1 variant leads to modified synaptic protein interactions, affecting glutamatergic signaling, differences in neuronal connectivity, and higher heterogeneity of neurons regarding their electrophysiological profiles.
Fig. 7. Introduction of NOVA1 archaic genetic variant in modern human alters neuronal network activity.
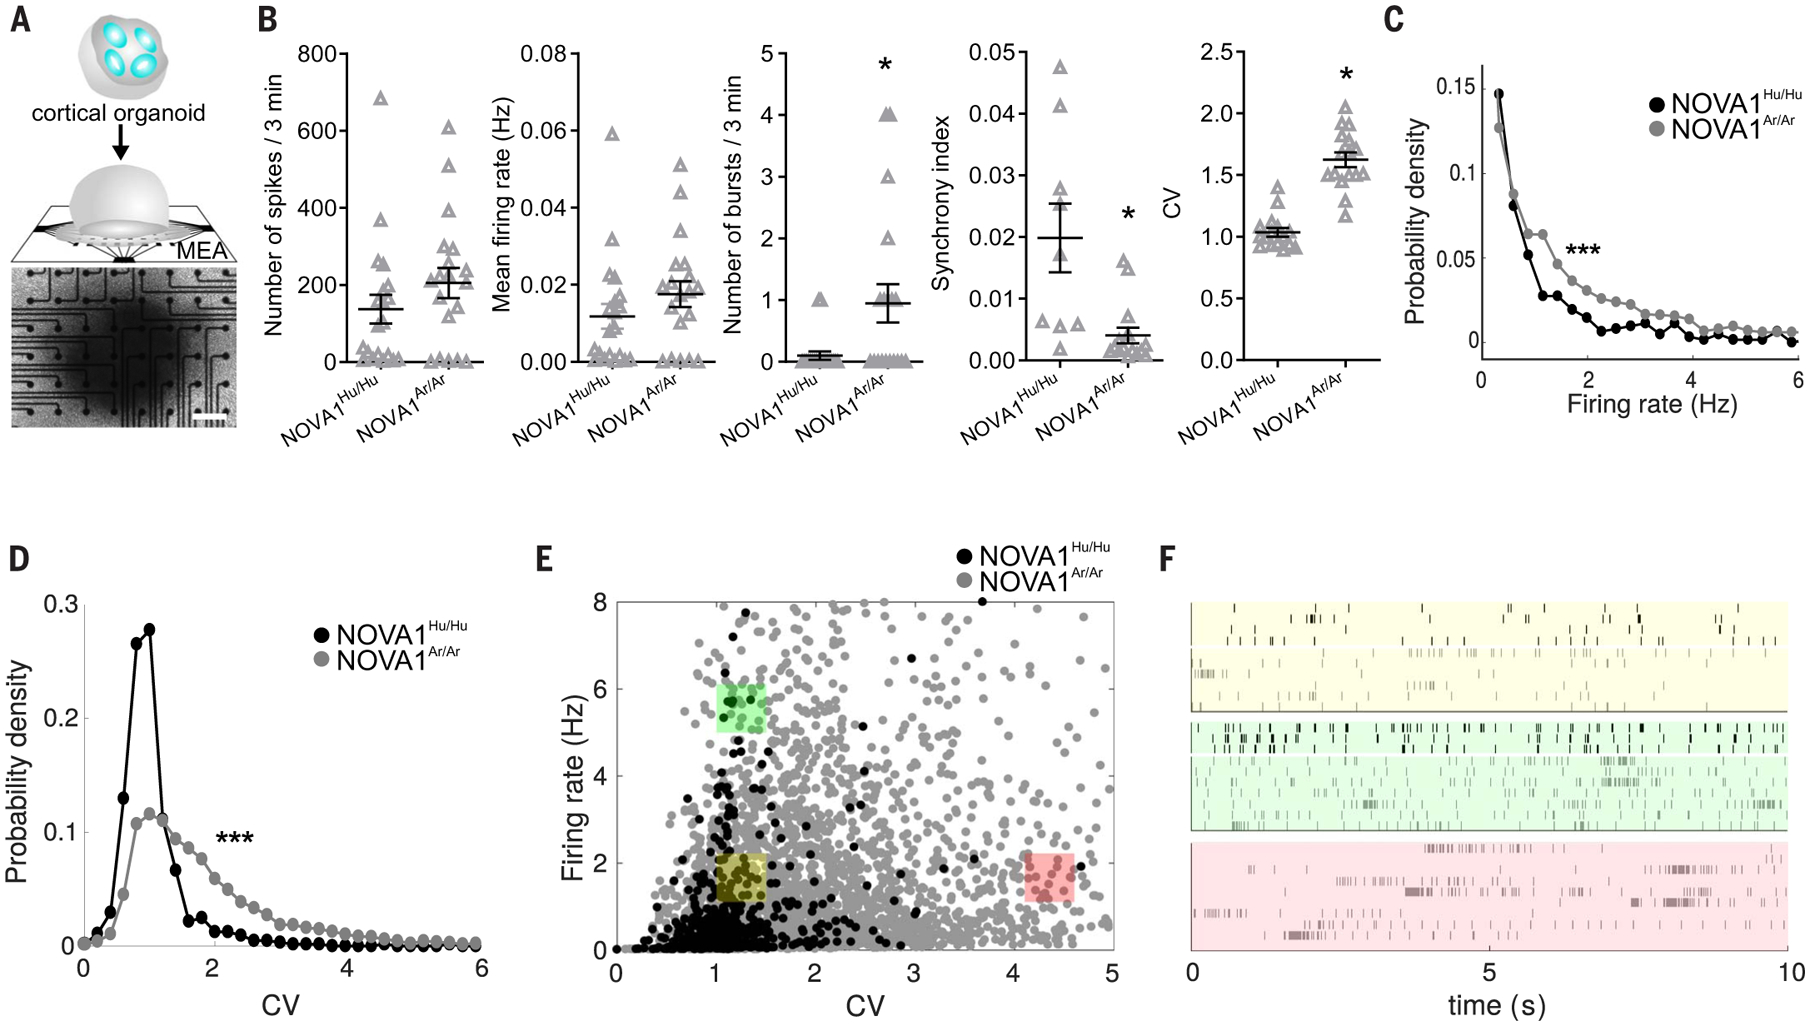
(A) Scheme of a cortical organoid plated on a MEA. Scale bar, 200 μm. (B to F) MEA analyses revealed an increase in spontaneous neuronal bursts in NOVA1Ar/Ar compared with NOVA1Hu/Hu cortical organoids (B). Although the number of total spikes does not differ, NOVA1Ar/Ar shows a reduced synchrony index. Data are shown as mean ± SEM (n = 20 MEA wells per genotype); *P < 0.05, two-sided unpaired Student’s t test. After performing spike sorting, the analysis disclosed a wider variability of neurons considering the firing rate (FR) and the CV in NOVA1Ar/Ar cortical organoids, as shown in the probability densities of (C) firing rate and (D) CV and as displayed in (E) 2D distribution and (F) raster plots from three selected regions (yellow: low CV, low FR; green: low CV, high FR; magenta: high CV, low FR). Data are shown as mean ± SEM; ***P < 0.001, Mann-Whitney test.
Discussion
Comparison of genome sequences from modern humans with those from Neanderthals and Denisovans, our closest evolutionary relatives, reveals mutations exclusive to modern humans. A subset of these genetic changes may underly the phenotypic traits that separate our species from these extinct relatives. We have presented a platform to test the impact of human-specific genetic variants by reintroducing the archaic form found in Neanderthals and Denisovans and measuring the effects during neurodevelopment using human cortical organoids.
Using CRISPR-Cas9 genome-editing technology in human iPSCs, we replaced the modern human allele of the NOVA1 gene with the ancestral allele found in Neanderthals and Denisovans, which contains a single-nucleotide substitution at position 200 that causes an isoleucine-to-valine change. NOVA1 is a conserved neuron-specific splicing factor responsible for producing many brain-specific mRNA isoforms (13–15). Alternative splicing is thought to be particularly important in the brain, because neural tissues express a number of brain-specific splicing factors necessary for proper cortical development (17, 35). The specific role of NOVA1 on alternative splicing of its targets is context dependent (36). Further, the binding targets of NOVA1 are divergent, leading NOVA1 to bind to different pre-mRNAs in the genomes of different species (37).
Our results indicate that the in vivo RNA binding landscape is largely unaltered by the archaic-specific NOVA1 alteration, and the differential splicing activity might be related to other causes, such as binding dynamics or cofactors, for example. We also observed differences in gene expression, organoid morphology, and cell proliferation when comparing cortical organoids carrying the NOVA1Ar/Ar and the NOVA1Hu/Hu genetic variants (Figs. 2 and 3). Furthermore, the NOVA1Ar/Ar cortical organoids displayed distinct excitatory synaptic changes (Fig. 6), which may have led to the observed alterations in neural network development.
There are limitations to our approach. First, our experiments necessarily used a specific human genetic background of NOVA1 target sequences, i.e., those in these human cell lines. It is likely that the genetic backgrounds between the archaic hominin and modern humans differed such that much of the genetic variation in these human cell lines did not coexist with the archaic version of NOVA1. Targets of the human-specific NOVA1 that currently exist in humans may have undergone compensatory genetic changes to adapt to the derived version of NOVA1 prevalent among humans today.
For NOVA1 targets, the NOVA1Ar/Ar splicing phenotype in a human genetic background may have generated a totally new phenotype: neither human nor Neanderthal nor Denisovan. Given the diversity of archaic ancestry within extant human genomes, similar experiments using a panel of human genetic backgrounds, with differing amounts and types of Neanderthal ancestry, could further refine the list of direct targets and splice events specific to human NOVA1 splicing regulation.
However, the splicing differences observed in the NOVA1Ar/Ar cortical organoid compared with those observed in NOVA1Hu/Hu can be interpreted as the first step toward a full understanding of the role of the human-specific version of NOVA1. As with all directed mutagenesis experiments, the genetic background may alter the phenotype. Nevertheless, this approach provides an efficient route for discovering genes and pathways affected by archaic and modern NOVA1 proteins.
Although we tried to mitigate CRISPR-Cas9 off-targets, we cannot exclude the possibility that the phenotypic observations reported here are due to undetectable or untargeted genetic variants with secondary consequences to NOVA1 activity. Our approach also cannot directly compare brain organoids with ancestral brain endocasts. Brain organoids allow for the observation and experimentation of aspects of the developing neural tissue in the dish, whereas studies of human tissue and fossil endocasts describe the phenotypic outcome of such processes.
With these caveats clearly stated, the results described here support the hypothesis that the archaic NOVA1Ar/Ar genetic variant alters cortical organoid development in a modern human background. Thus, we hypothesize that this genetic change was an important event in the evolution of the modern human-specific neural phenotype and should undergo further studies.
Materials and methods summary
Haplotype analyses
Phased variant calls from the 1000 Genomes Project (11) and the SGDP (12) were downloaded, along with high-coverage BAM files for the Vindija (5) and Altai (4) Neanderthals and the high-coverage Denisovan (3). After compiling our list of human-specific fixed derived alleles, we used the 1000 Genomes Project data to scan for unrecombined haplotypes around each. We defined an unrecombined haplotype as the span of sites upstream and downstream of the allele for which no modern human in the 1000 Genomes Project dataset shares a derived allele with an archaic hominin. Any haplotype that fell within a centromeric or telomeric region was discarded. We calculated pairwise nucleotide diversity and Watterson’s estimator of theta (38) within each human-specific haplotype using only biallelic SNPs for which the ancestral allele is known. We calculated Tajima’s D from these two values and then normalized Tajima’s D within each haplotype by dividing it by its minimum possible value (39).
Cell source and NOVA1 cortical organoid generation
Two neurotypical iPSC lines and related clones were previously characterized and validated (20, 40). Human iPSC colonies were expanded on feeder-free conditions on Matrigel-coated dishes (BD Biosciences, San Jose, CA, USA) with mTeSR1 medium (StemCell Technologies, Vancouver, Canada) changed daily. Human edited NOVA1Ar/Ar, NOVA1Ko/Ar, and NOVA1Ko/Ko iPSC lines were generated using the CRISPR-Cas9 genome-editing system to induce a point mutation insertion [Val200→Iso (V200I)] by substituting codon 200 GTA (Val) with ATC (Iso) at both alleles. Then, we used the protocol described elsewhere to generate functional cortical organoids (20).
Immunofluorescence staining and immunoblot
Cortical organoids were fixed with 4% para-formaldehyde, cryopreserved in 30% sucrose, and sliced in a cryostat. The sliced samples were permeabilized and blocked and then incubated with primary antibodies overnight at 4°C. After washing, the slices were incubated with secondary antibodies for 2 hours at room temperature. The nuclei were stained using 4′,6-diamidino-2-phenylindole (DAPI) solution (1 μg/ml). The slides were mounted using ProLong Gold antifade reagent and analyzed under a fluorescence microscope (Axio Observer Apotome, Zeiss).
Cortical organoids were lysed in radioimmunoprecipitation assay (RIPA) buffer with protease inhibitors. NeuN, GFAP, CTIP2, TBR1, FOXG1, Homer1, Syn1, VGlut1, PSD95, and NOVA1 were used as primary antibodies, as previously performed (20). IRDye 800CW goat anti-rabbit and IRDye 680RD goat anti-mouse (1:6000) were used as secondary antibodies. Signal intensities were measured using the Odyssey Image Studio and normalized by actin relative quantification.
eCLIP library preparation and computational analysis
The assay was performed as previously described (28, 41). Briefly, organoids were mechanically and enzymatically dissociated into cell suspension. Two percent of lysate was retained for preparation of a size-matched input library, and the remaining 98% was subject to immunoprecipitation using 50 μl of anti-NOVA1 antibody (Santa Cruz; 512Y sc-100334) coupled to magnetic dynabeads (Invitrogen 11203D). Bound RNA fragments were dephosphorylated and 3′-end ligated with an RNA adapter. Reverse transcription was performed with AffinityScript (Agilent), and cDNAs were 5′-end ligated with a DNA adaptor. The cDNA products were amplified with Q5 PCR mix (NEB) to yield a sequencing library. Libraries were sequenced on the Illumina HiSeq4000 in SE75 mode to a depth of ~40 million reads per library. Reads were processed as described previously (28). Briefly, reads were adapter-trimmed and mapped to human-specific repetitive elements from RepBase (version 18.05) by STAR (42). Peaks passing significance thresholds in either replicate were kept for downstream analyses.
Splicing quantification
To quantify splicing, we used juncBASE (36) to calculate a percent spliced in (PSI) value for each alternative splicing event. We ran juncBASE on the read alignments, using GENCODE v19 (43) as the annotation set. To call differentially spliced events, we used the pairwise Fisher’s test script. We considered a splicing event to be differentially spliced if the replicates of the human control were not significantly different from each other, but the replicates of the sample were all significantly different from the control. To visualize the differences in splicing between the different cell lines and time points, we performed PCA on the PSI values for each sample and cassette exon splicing event.
MEA recording
MEA electrophysiological recordings were performed as described elsewhere (12). Briefly, cortical organoids were plated on 12-well MEA plates (Axion Biosystems, Atlanta, GA, USA). Recordings were performed using the Maestro MEA system and AxIS Software Spontaneous Neural Configuration (Axion Biosystems). Spikes were detected with AxIS software using an adaptive threshold crossing set to 5.5 times the standard deviation of the estimated noise for each electrode. Bright-field images were captured from each well to assess for neural density and electrode coverage over time.
Supplementary Material
ACKNOWLEDGMENTS
We acknowledge K. Jepsen at the UCSD Institute of Genomic Medicine funded by National Institutes of Health (NIH) grant (#S10 OD026929).
Funding:
This work was supported by the Neanderthal Brain Foundation; the NIH through U19MH1073671, part of the National Cooperative Reprogrammed Cell Research Groups (NCRCRG) to Study Mental Illness; and a NARSAD Independent Investigator Grant to A.R.M.; the NSF through DEB-1754451 to N.K.S., R.E.G., and B.S. and BCS-2034037 to R.E.G.; and a grant from the Gordon and Betty Moore Foundation (GBMF 3804). Work at the Center for Epigenomics was supported in part by the UC San Diego School of Medicine. I.A.C. is a San Diego IRACDA Fellow supported by award NIH/NIGMS K12 GM068524. A.H.K. was financed in part by the Coordenação de Aperfeiçoamento de Pessoal de Nível Superior Capes, Finance Code 001, FAPESP (#2019/17892-8), and CNPq (#431000/2016-6, #312047/2017-7). F.S.B. (#2017/18977-1) and M.S.A.F. (#2019/15024-9) were supported by FAPESP. Enhanced CLIP experiments and analysis were supported by NIH grants R01HG009889, R01HG004659, and U19MH107367 to G.W.Y. C.A.T. is partly funded by grants from K01AA026911 (NIAAA) and the CDKL5 Program of Excellence (Loulou Foundation). J.D.L. and S.E.P.S. were supported by NIH grant MH113545.
Footnotes
Competing interests: A.R.M. is a cofounder of and has equity interest in TISMOO, a company dedicated to genetic analysis and brain organoid modeling focusing on therapeutic applications customized for autism spectrum disorder and other neurological disorders with genetic origins. The terms of this arrangement have been reviewed and approved by the University of California, San Diego, in accordance with its conflict-of-interest policies. G.W.Y. is cofounder, member of the board of directors, science advisory board member, and equity holder of and paid consultant for Locanabio and Eclipse BioInnovations. G.W.Y. is a visiting professor at the National University of Singapore. G.W.Y.’s interest(s) have been reviewed and approved by the University of California, San Diego, in accordance with its conflict-of-interest policies.
Data and materials availability: All sequencing data generated by this study, including whole-exome sequencing, single-cell RNA-seq, and pooled RNA-seq data, are available under BioProject accession code PRJNA670687.
SUPPLEMENTARY MATERIALS
science.sciencemag.org/content/371/6530/eaax2537/suppl/DC1
Materials and Methods
Figs. S1 to S4
Tables S1 to S8
References (44–76)
MDAR Reproducibility Checklist
View/request a protocol for this paper from Bio-protocol.
REFERENCES AND NOTES
- 1.Wood B, Collard M, The human genus. Science 284, 65–71 (1999). doi: 10.1126/science.284.5411.65; [DOI] [PubMed] [Google Scholar]
- 2.Green RE et al. , A draft sequence of the Neandertal genome. Science 328, 710–722 (2010). doi: 10.1126/science.1188021; [DOI] [PMC free article] [PubMed] [Google Scholar]
- 3.Meyer M et al. , A high-coverage genome sequence from an archaic Denisovan individual. Science 338, 222–226 (2012). doi: 10.1126/science.1224344; [DOI] [PMC free article] [PubMed] [Google Scholar]
- 4.Prüfer K et al. , The complete genome sequence of a Neanderthal from the Altai Mountains. Nature 505, 43–49 (2014). doi: 10.1038/nature12886; [DOI] [PMC free article] [PubMed] [Google Scholar]
- 5.Prüfer K et al. , A high-coverage Neandertal genome from Vindija Cave in Croatia. Science 358, 655–658 (2017). doi: 10.1126/science.aao1887; [DOI] [PMC free article] [PubMed] [Google Scholar]
- 6.Abi-Rached L et al. , The shaping of modern human immune systems by multiregional admixture with archaic humans. Science 334, 89–94 (2011). doi: 10.1126/science.1209202; [DOI] [PMC free article] [PubMed] [Google Scholar]
- 7.Racimo F, Sankararaman S, Nielsen R, Huerta-Sánchez E, Evidence for archaic adaptive introgression in humans. Nat. Rev. Genet 16, 359–371 (2015). doi: 10.1038/nrg3936; [DOI] [PMC free article] [PubMed] [Google Scholar]
- 8.Juric I, Aeschbacher S, Coop G, The strength of selection against Neanderthal introgression. PLOS Genet. 12, e1006340 (2016). doi: 10.1371/journal.pgen.1006340; [DOI] [PMC free article] [PubMed] [Google Scholar]
- 9.Sankararaman S et al. , The genomic landscape of Neanderthal ancestry in present-day humans. Nature 507, 354–357 (2014). doi: 10.1038/nature12961; [DOI] [PMC free article] [PubMed] [Google Scholar]
- 10.Vernot B, Akey JM, Resurrecting surviving Neandertal lineages from modern human genomes. Science 343, 1017–1021 (2014). doi: 10.1126/science.1245938; [DOI] [PubMed] [Google Scholar]
- 11.Auton A et al. , A global reference for human genetic variation. Nature 526, 68–74 (2015). doi: 10.1038/nature15393; [DOI] [PMC free article] [PubMed] [Google Scholar]
- 12.Mallick S et al. , The Simons Genome Diversity Project: 300 genomes from 142 diverse populations. Nature 538, 201–206 (2016). doi: 10.1038/nature18964; [DOI] [PMC free article] [PubMed] [Google Scholar]
- 13.Buckanovich RJ, Darnell RB, The neuronal RNA binding protein Nova-1 recognizes specific RNA targets in vitro and in vivo. Mol. Cell. Biol 17, 3194–3201 (1997). doi: 10.1128/MCB.17.6.3194; [DOI] [PMC free article] [PubMed] [Google Scholar]
- 14.Jensen KB et al. , Nova-1 regulates neuron-specific alternative splicing and is essential for neuronal viability. Neuron 25, 359–371 (2000). doi: 10.1016/S0896-6273(00)80900-9; [DOI] [PubMed] [Google Scholar]
- 15.Ule J et al. , Nova regulates brain-specific splicing to shape the synapse. Nat. Genet 37, 844–852 (2005). doi: 10.1038/ng1610; [DOI] [PubMed] [Google Scholar]
- 16.Xin Y et al. , Neuro-oncological ventral antigen 1 (NOVA1): Implications in neurological diseases and cancers. Cell Prolif. 50, e12348 (2017). doi: 10.1111/cpr.12348; [DOI] [PMC free article] [PubMed] [Google Scholar]
- 17.Parikshak NN et al. , Genome-wide changes in lncRNA, splicing, and regional gene expression patterns in autism. Nature 540, 423–427 (2016). doi: 10.1038/nature20612; [DOI] [PMC free article] [PubMed] [Google Scholar]
- 18.Ule J et al. , An RNA map predicting Nova-dependent splicing regulation. Nature 444, 580–586 (2006). doi: 10.1038/nature05304; [DOI] [PubMed] [Google Scholar]
- 19.Teplova M et al. , Protein-RNA and protein-protein recognition by dual KH1/2 domains of the neuronal splicing factor Nova-1. Structure 19, 930–944 (2011). doi: 10.1016/j.str.2011.05.002; [DOI] [PMC free article] [PubMed] [Google Scholar]
- 20.Trujillo CA et al. , Complex oscillatory waves emerging from cortical organoids model early human brain network development. Cell Stem Cell 25, 558–569.e7 (2019). doi: 10.1016/j.stem.2019.08.002; [DOI] [PMC free article] [PubMed] [Google Scholar]
- 21.Nygård O, Nika H, Identification by RNA-protein cross-linking of ribosomal proteins located at the interface between the small and the large subunits of mammalian ribosomes. EMBO J. 1, 357–362 (1982). doi: 10.1002/j.1460-2075.1982.tb01174.x; [DOI] [PMC free article] [PubMed] [Google Scholar]
- 22.Lin HH et al. , Neuronatin promotes neural lineage in ESCs via Ca2+ signaling. Stem Cells 28, 1950–1960 (2010). doi: 10.1002/stem.530; [DOI] [PMC free article] [PubMed] [Google Scholar]
- 23.Boles NC et al. , NPTX1 regulates neural lineage specification from human pluripotent stem cells. Cell Rep. 6, 724–736 (2014). doi: 10.1016/j.celrep.2014.01.026; [DOI] [PubMed] [Google Scholar]
- 24.Shimizu T, Hibi M, Formation and patterning of the forebrain and olfactory system by zinc-finger genes Fezf1 and Fezf2. Dev. Growth Differ 51, 221–231 (2009). doi: 10.1111/j.1440-169X.2009.01088.x; [DOI] [PubMed] [Google Scholar]
- 25.Davis LK et al. , Pax6 3′ deletion results in aniridia, autism and mental retardation. Hum. Genet 123, 371–378 (2008). doi: 10.1007/s00439-008-0484-x; [DOI] [PMC free article] [PubMed] [Google Scholar]
- 26.Heide M et al. , Lhx5 controls mamillary differentiation in the developing hypothalamus of the mouse. Front. Neuroanat 9, 113 (2015). doi: 10.3389/fnana.2015.00113; [DOI] [PMC free article] [PubMed] [Google Scholar]
- 27.Szumlinski KK, Kalivas PW, Worley PF, Homer proteins: Implications for neuropsychiatric disorders. Curr. Opin. Neurobiol 16, 251–257 (2006). doi: 10.1016/j.conb.2006.05.002; [DOI] [PubMed] [Google Scholar]
- 28.Van Nostrand EL et al. , Robust transcriptome-wide discovery of RNA-binding protein binding sites with enhanced CLIP (eCLIP). Nat. Methods 13, 508–514 (2016). doi: 10.1038/nmeth.3810; [DOI] [PMC free article] [PubMed] [Google Scholar]
- 29.Lautz JD, Brown EA, Williams VanSchoiack AA, Smith SEP, Synaptic activity induces input-specific rearrangements in a targeted synaptic protein interaction network. J. Neurochem 146, 540–559 (2018). doi: 10.1111/jnc.14466; [DOI] [PMC free article] [PubMed] [Google Scholar]
- 30.Smith SEP et al. , Multiplex matrix network analysis of protein complexes in the human TCR signalosome. Sci. Signal 9, rs7–rs7 (2016). doi: 10.1126/scisignal.aad7279; [DOI] [PMC free article] [PubMed] [Google Scholar]
- 31.Langfelder P, Horvath S, WGCNA: An R package for weighted correlation network analysis. BMC Bioinformatics 9, 559 (2008). doi: 10.1186/1471-2105-9-559; [DOI] [PMC free article] [PubMed] [Google Scholar]
- 32.Monteiro P, Feng G, SHANK proteins: Roles at the synapse and in autism spectrum disorder. Nat. Rev. Neurosci 18, 147–157 (2017). doi: 10.1038/nrn.2016.183; [DOI] [PubMed] [Google Scholar]
- 33.Ronesi JA et al. , Disrupted Homer scaffolds mediate abnormal mGluR5 function in a mouse model of fragile X syndrome. Nat. Neurosci 15, 431–440, S1 (2012). doi: 10.1038/nn.3033; [DOI] [PMC free article] [PubMed] [Google Scholar]
- 34.Walkup IV WGIV et al. , A model for regulation by SynGAP-α1 of binding of synaptic proteins to PDZ-domain ‘Slots’ in the postsynaptic density. eLife 5, e16813 (2016). doi: 10.7554/eLife.16813; [DOI] [PMC free article] [PubMed] [Google Scholar]
- 35.Zhang X et al. , Cell-type-specific alternative splicing governs cell fate in the developing cerebral cortex. Cell 166, 1147–1162. e15 (2016). doi: 10.1016/j.cell.2016.07.025; [DOI] [PMC free article] [PubMed] [Google Scholar]
- 36.Brooks AN et al. , Conservation of an RNA regulatory map between Drosophila and mammals. Genome Res. 21, 193–202 (2011). doi: 10.1101/gr.108662.110; [DOI] [PMC free article] [PubMed] [Google Scholar]
- 37.Jelen N, Ule J, Zivin M, Darnell RB, Evolution of Nova-dependent splicing regulation in the brain. PLOS Genet. 3, e173 (2007). doi: 10.1371/journal.pgen.0030173; [DOI] [PMC free article] [PubMed] [Google Scholar]
- 38.Watterson GA, On the number of segregating sites in genetical models without recombination. Theor. Popul. Biol 7, 256–276 (1975). doi: 10.1016/0040-5809(75)90020-9; [DOI] [PubMed] [Google Scholar]
- 39.Schaeffer SW, Molecular population genetics of sequence length diversity in the Adh region of Drosophila pseudoobscura. Genet. Res 80, 163–175 (2002). doi: 10.1017/S0016672302005955; [DOI] [PubMed] [Google Scholar]
- 40.Hsieh C-H et al. , Functional impairment in miro degradation and mitophagy is a shared feature in familial and sporadic Parkinson’s disease. Cell Stem Cell 19, 709–724 (2016). doi: 10.1016/j.stem.2016.08.002; [DOI] [PMC free article] [PubMed] [Google Scholar]
- 41.Van Nostrand EL et al. , A large-scale binding and functional map of human RNA-binding proteins. Nature 583, 711–719 (2020). doi: 10.1038/s41586-020-2077-3; [DOI] [PMC free article] [PubMed] [Google Scholar]
- 42.Dobin A et al. , STAR: Ultrafast universal RNA-seq aligner. Bioinformatics 29, 15–21 (2013). doi: 10.1093/bioinformatics/bts635; [DOI] [PMC free article] [PubMed] [Google Scholar]
- 43.Harrow J et al. , GENCODE: The reference human genome annotation for The ENCODE Project. Genome Res. 22, 1760–1774 (2012). doi: 10.1101/gr.135350.111; [DOI] [PMC free article] [PubMed] [Google Scholar]
Associated Data
This section collects any data citations, data availability statements, or supplementary materials included in this article.


